
In the last few economic cycles, investors knew what a defensive allocation looked like.
In fixed income the main shift was to increase sovereign debt holdings. In equities a defensive position involved adding a combination of bond proxies and the early cycle beneficiaries of lower interest rates.
The problem this time is that sovereign bonds may no longer be defensive and interest rates may stay high. If this is the case, the traditional defensive playbook will not work, and a new one needs to be found.
A well-established formula
There is a broad formula deployed by many investors ahead of a downturn. As interest rates go up and the economy is expected to slow, investors’ first step is to increase sovereign bond holdings, usually at the expense of equities. The expectation is that interest rates will fall and corporate earnings will fall, and therefore low-risk bond-like income streams will become more attractive.
The same logic applies to equities. Investors tend to make two strategic moves once the consensus sees interest rate hikes nearing an end. The first is to buy bond-like defensives, e.g. Consumer Staples, Utilities and Healthcare. The second is to own early cycle beneficiaries. These early cycle companies are those that should do well from an interest rate decline, with Consumer Discretionary and Technology typically the most favoured.
A peak in interest rates is also seen as negative for commodities. With the economy expected to decline, commodity demand should fall, which should reduce commodity prices. Lower oil prices and the like should act as a further support to the rest of the portfolio. Cheaper energy is a support for early cycle companies, sovereign bonds and bond proxies. Consumer-facing companies are assisted by lower energy prices and bond yields are also supported, given anticipated lower inflation.
This algorithm was validated from January to May
We can see that this asset allocation shift has played out over the first five months of 2023. Investors followed this simple algorithm because it has worked well over the last few cycles. The sheer weight of money that moves according to this formula is enough to impact relative price performance as the allocations are changed.
Investors poured money into sovereign bonds, and for a few months yields declined. In equities we saw a sharp move higher in Consumer Discretionary and Technology companies from January through May, whilst commodity-facing equities lagged.
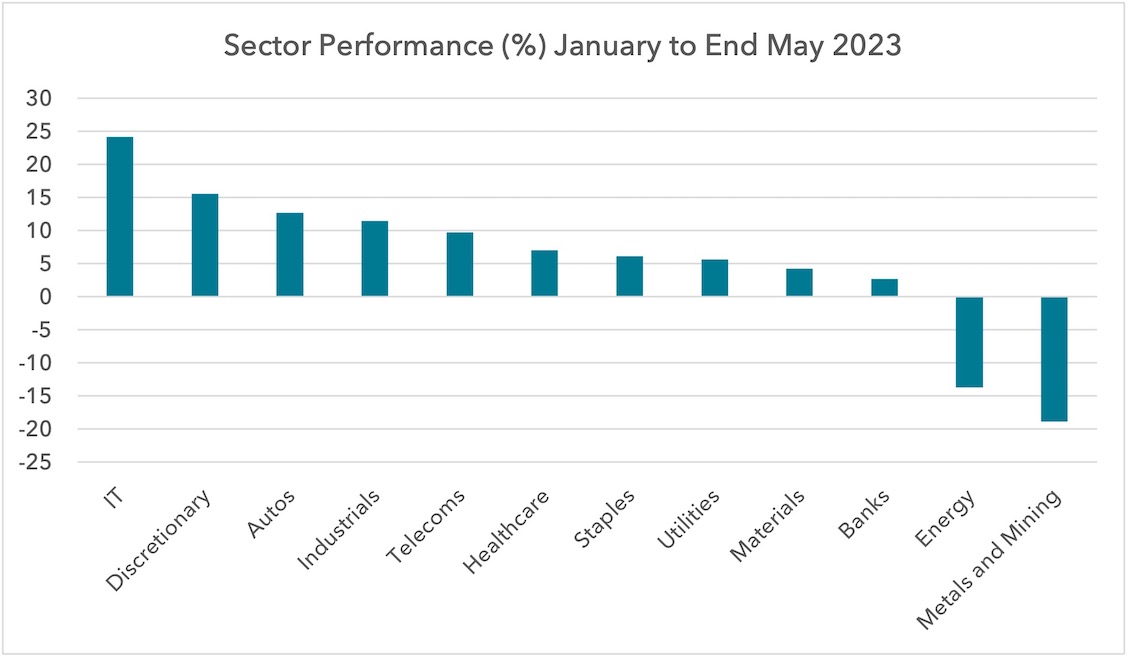 Inflation’s decline in 2023 has allowed real consumer incomes to rise and so the improvement in Consumer Discretionary and Technology has been supported by fundamentals to some degree. To this extent, we would not say the direction of relative prices in equities has been wrong in the early months of this year.
But what about for the remainder of the year?
Our assessment is that the major moves in investor flows from these asset allocation shifts are now over, likely ending in late May. Fund manager survey data and ETF flows show large moves have been completed into Technology and Treasuries and investors have liquidated commodity positions. This means only fundamentals can support this divergence in relative performance from here.
To support further fundamental moves in favour of Consumer Discretionary and Technology, we need to see real incomes rise more than expected. This requires lower inflation and lower interest rates than are already discounted. To see a sharp outperformance from bond proxies, we need to see lower bond yields. As we shall discuss further below, we do not consider these outcomes to be likely.
The algorithm is now being challenged
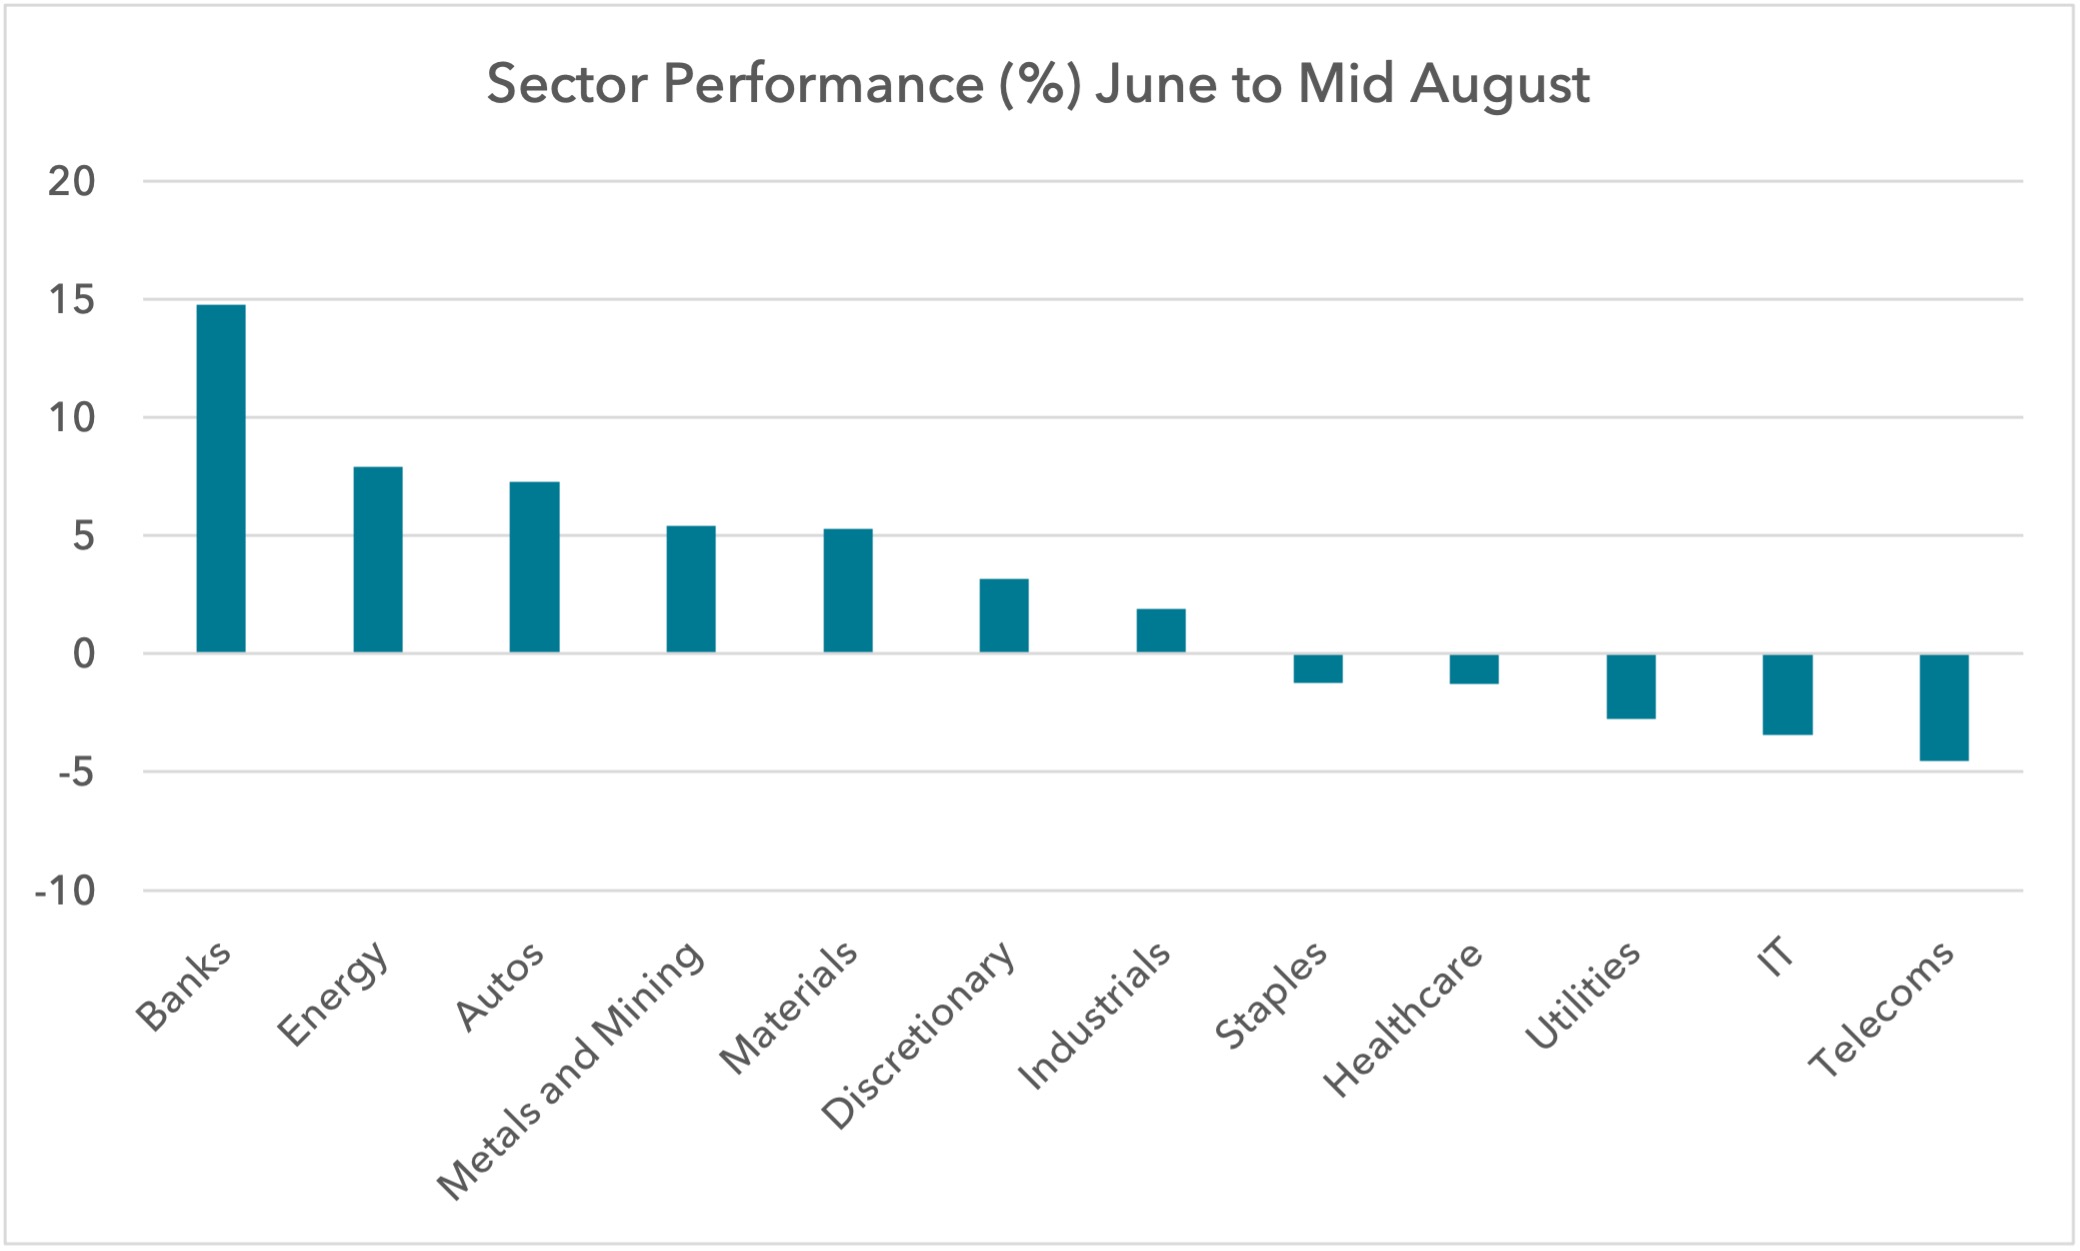
Since the end of May, sector performance has been diverging from what the classic formula or algorithm would predict. Commodities have started to fare better. Early cycle sectors like IT and some bond proxies have started to fare worse.
 The above assessment begs the question: if we could see this shift coming, why did the Lightman European funds not make more tactical adjustments at the end of 2022 in anticipation?
We see this cycle as very different to the last 2-3 cycles. Our structural thesis is that interest rates are set to stay high, and so playing for a tactical move on expected declines in interest rates that are not likely to materialise was too risky and too difficult to time correctly.
The duration and magnitude of the price moves earlier this year were larger than we expected, but this probably says something about how well-followed and implemented this “market cycle formula” way of investing is today. This makes us believe that once the algorithm breaks, relative price moves could be violent, and hopefully in our favour.
When the algorithm breaks
We have written before about the likelihood of bond yields remaining high. We cited three possible reasons: an economy more resilient than expected; inflation failing to fall as much as expected; and concerns over debt sustainability.
Investors are laser-focused on the growth and inflation outlook. But we believe debt sustainability concerns are becoming as important, and may be underappreciated.
Government bond supply vs demand
When we assess the difference in supply and demand for sovereign bonds, the imbalance appears worrying.
We can assess the short-term imbalance via three areas: central banks and large foreign holders on the demand side; and new issuance volumes by governments on the supply side.
On the demand side, it is important to know how big the Treasury market is and who owns it.
The total value of Treasury securities outstanding is $31.5tn, but approximately $6.9tn of this is owned by the Government, in particular the Social Security Trust Fund. For the sake of this exercise we remove this intergovernmental debt (in red), leaving the public debt valued at $24.6tn.
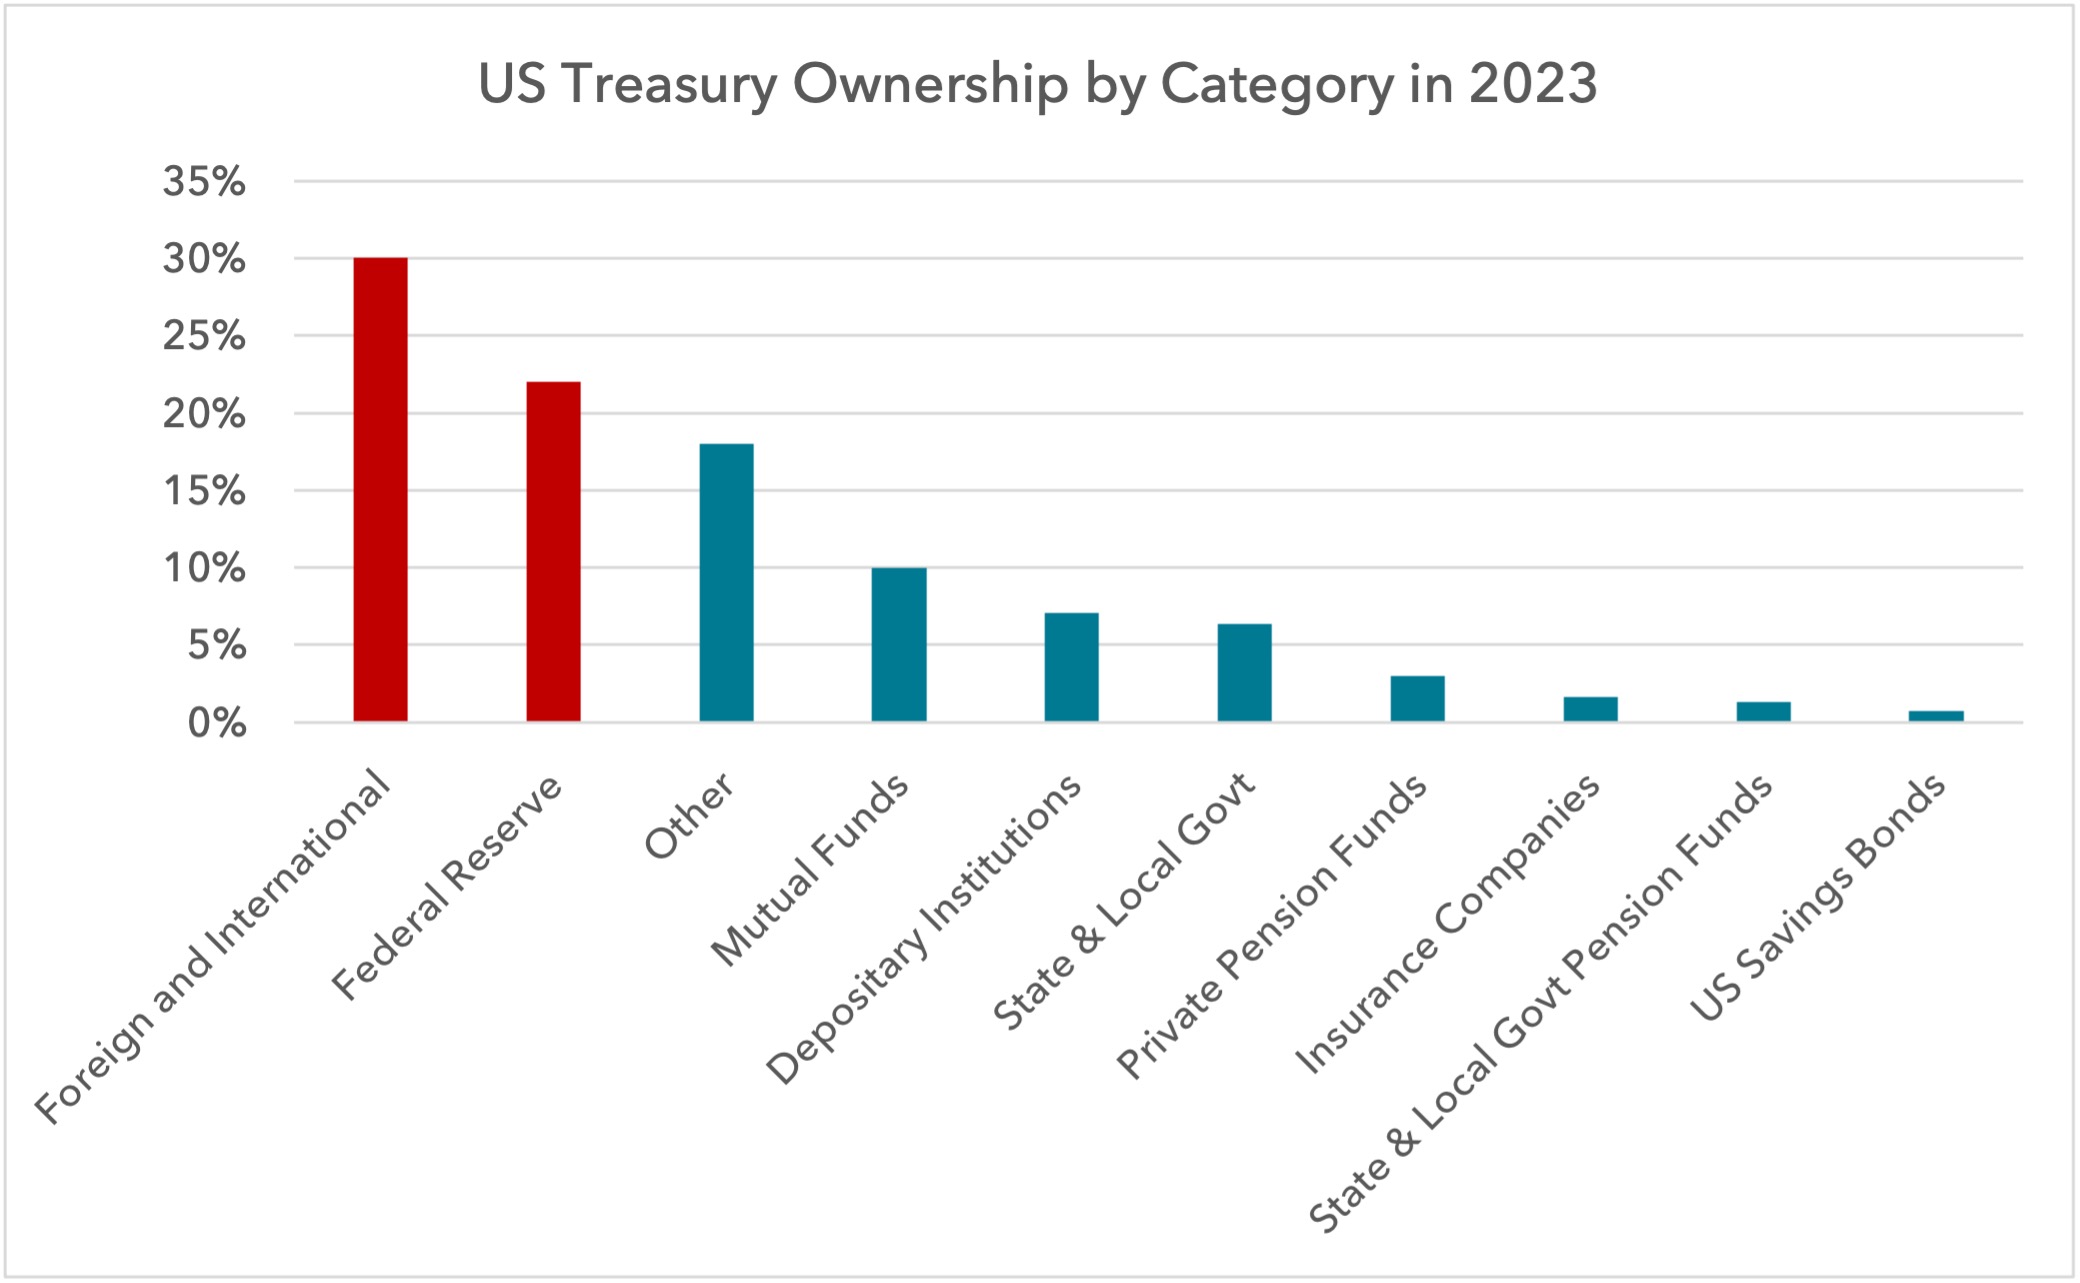
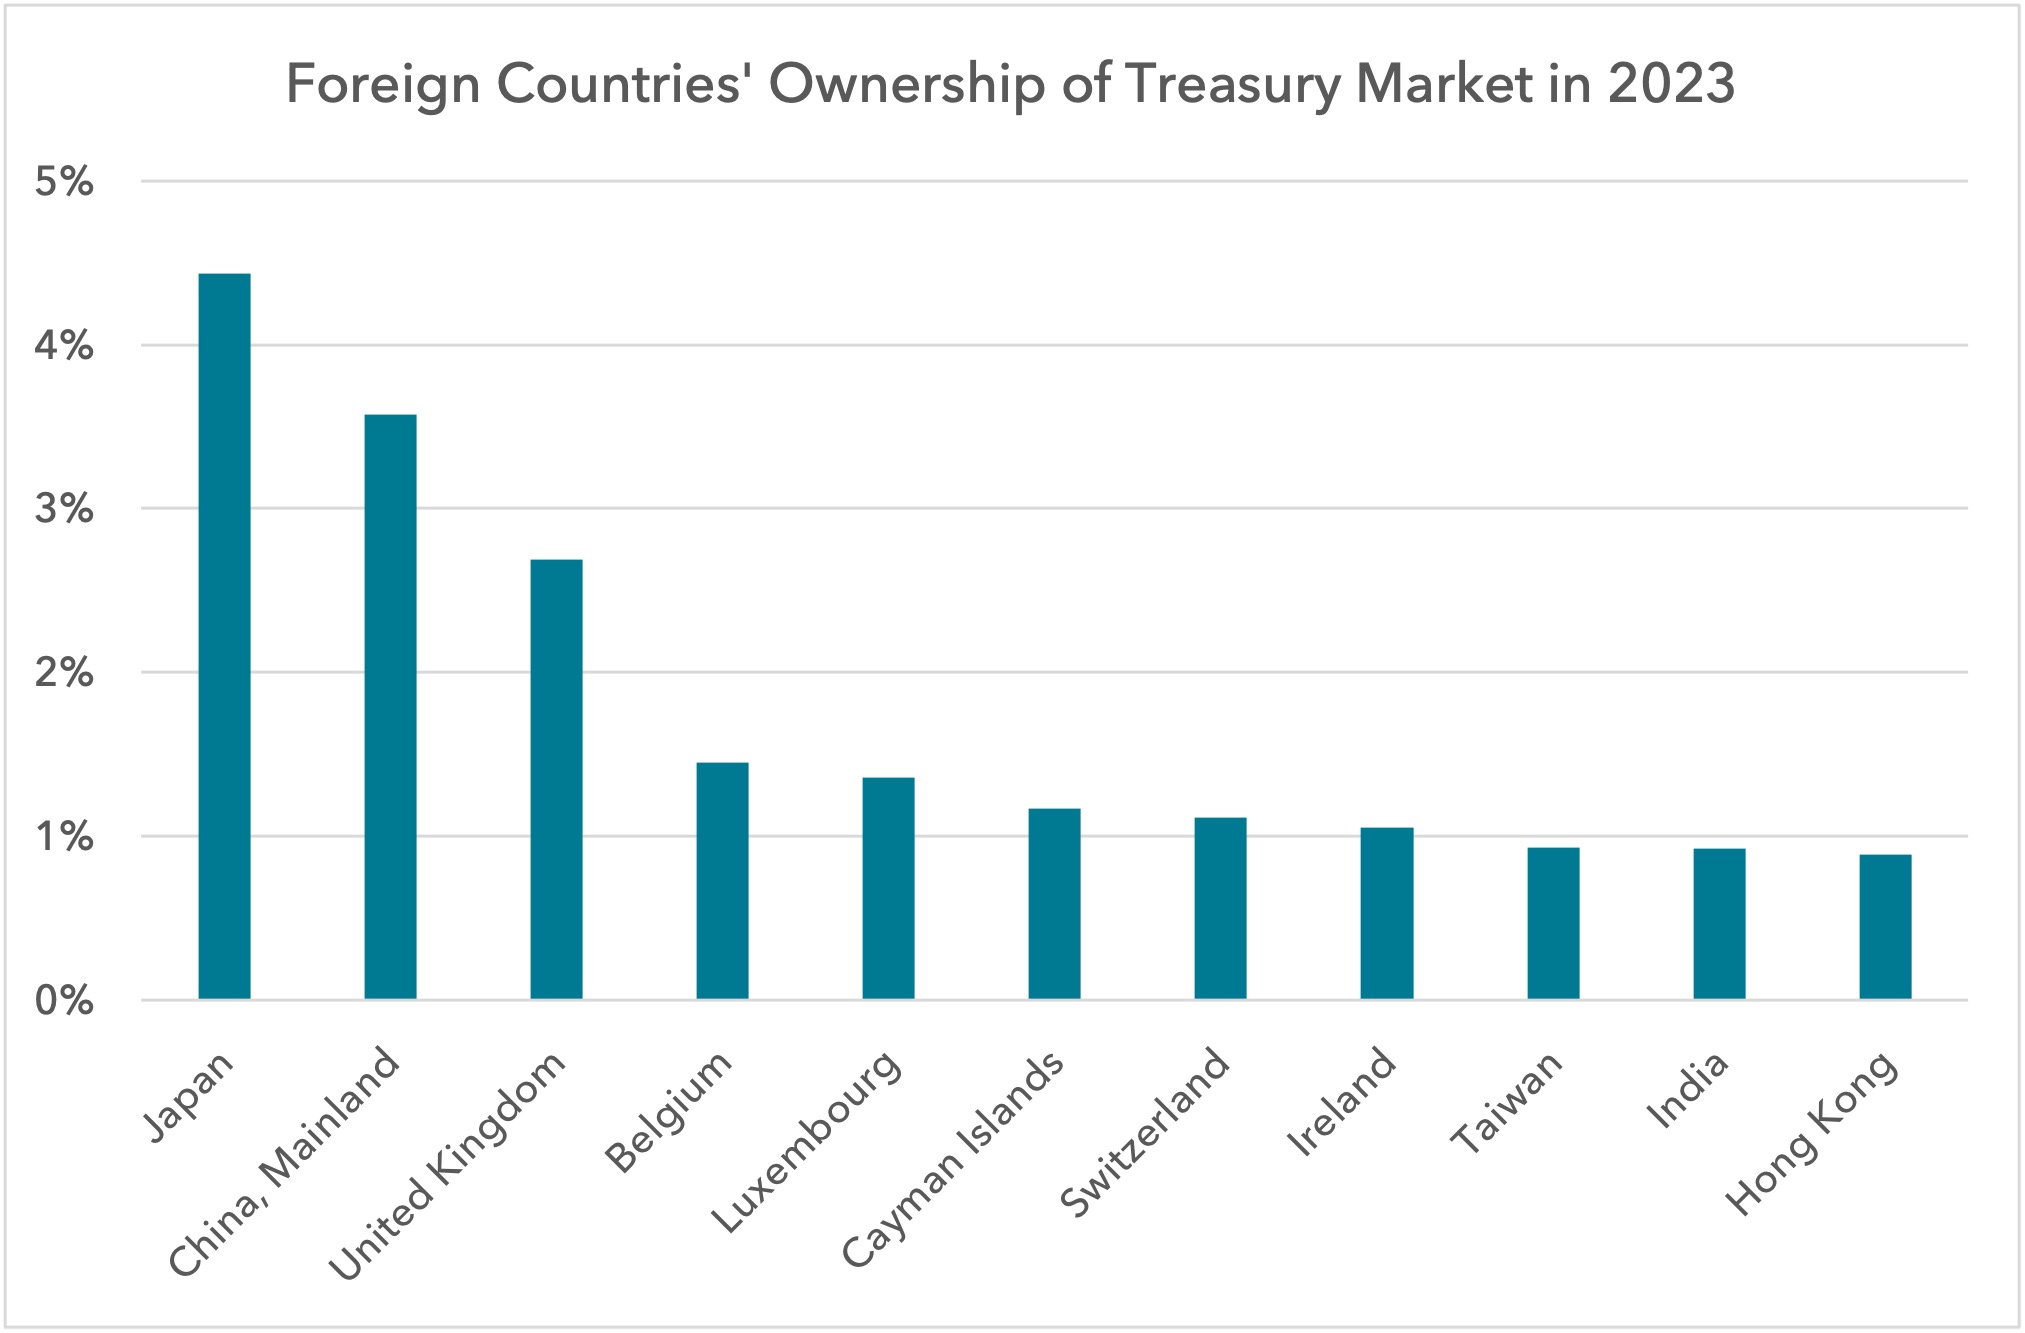
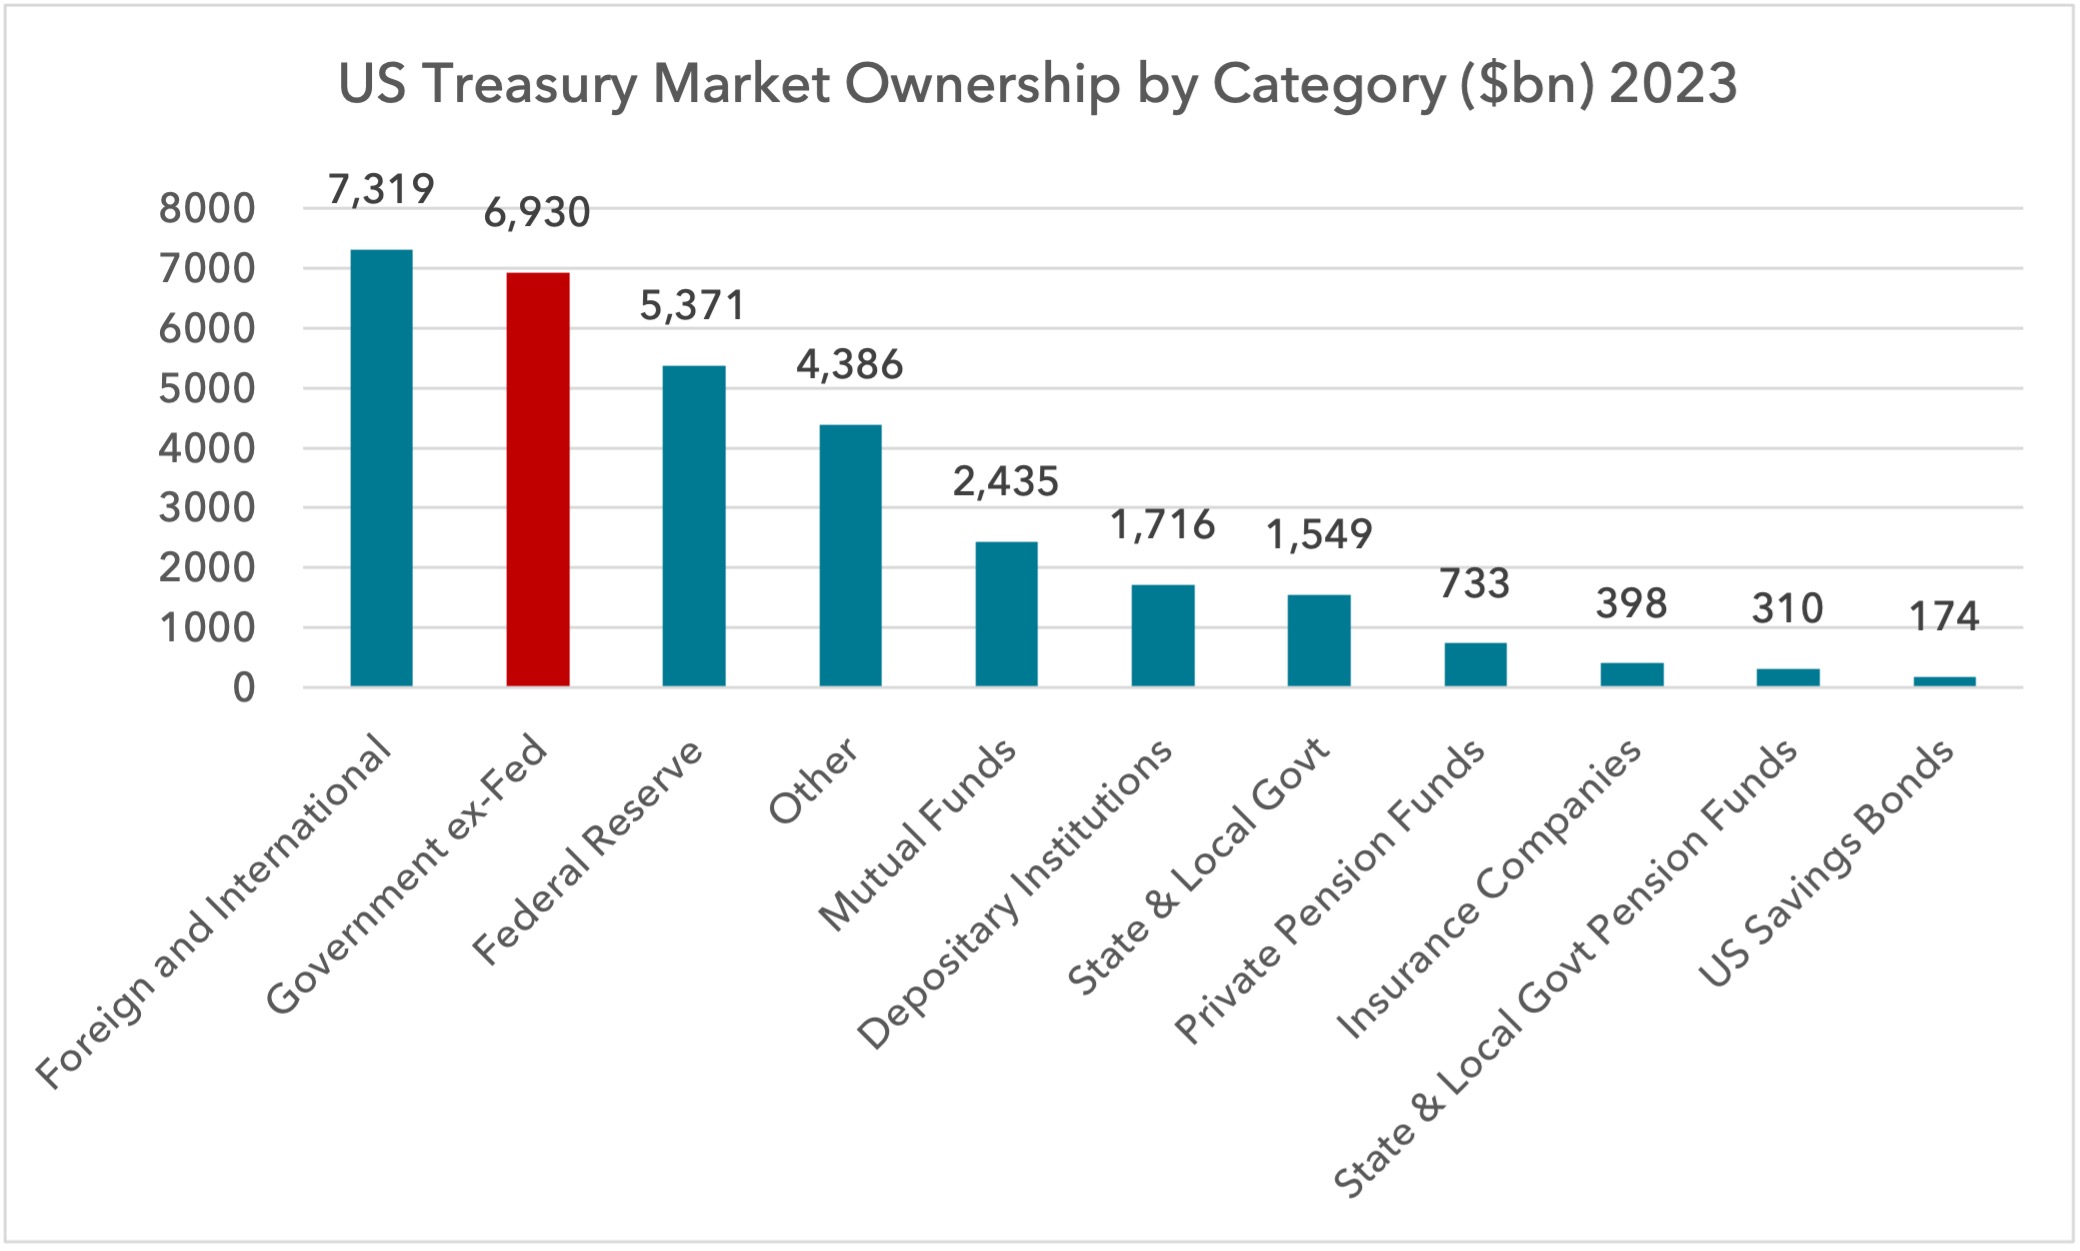 Below we show the market share of public debt in percentages by category. The largest owners of Treasuries are foreigners, followed by the Fed. Together they own over 50% of the market.
“Other” is a category that represents individuals, broker dealers, corporates, trusts, government-sponsored enterprises and other investors.
 For this exercise we will focus on the recent behaviour of central banks and some large foreign investors, and how this has changed the balance of supply and demand.
Central banks
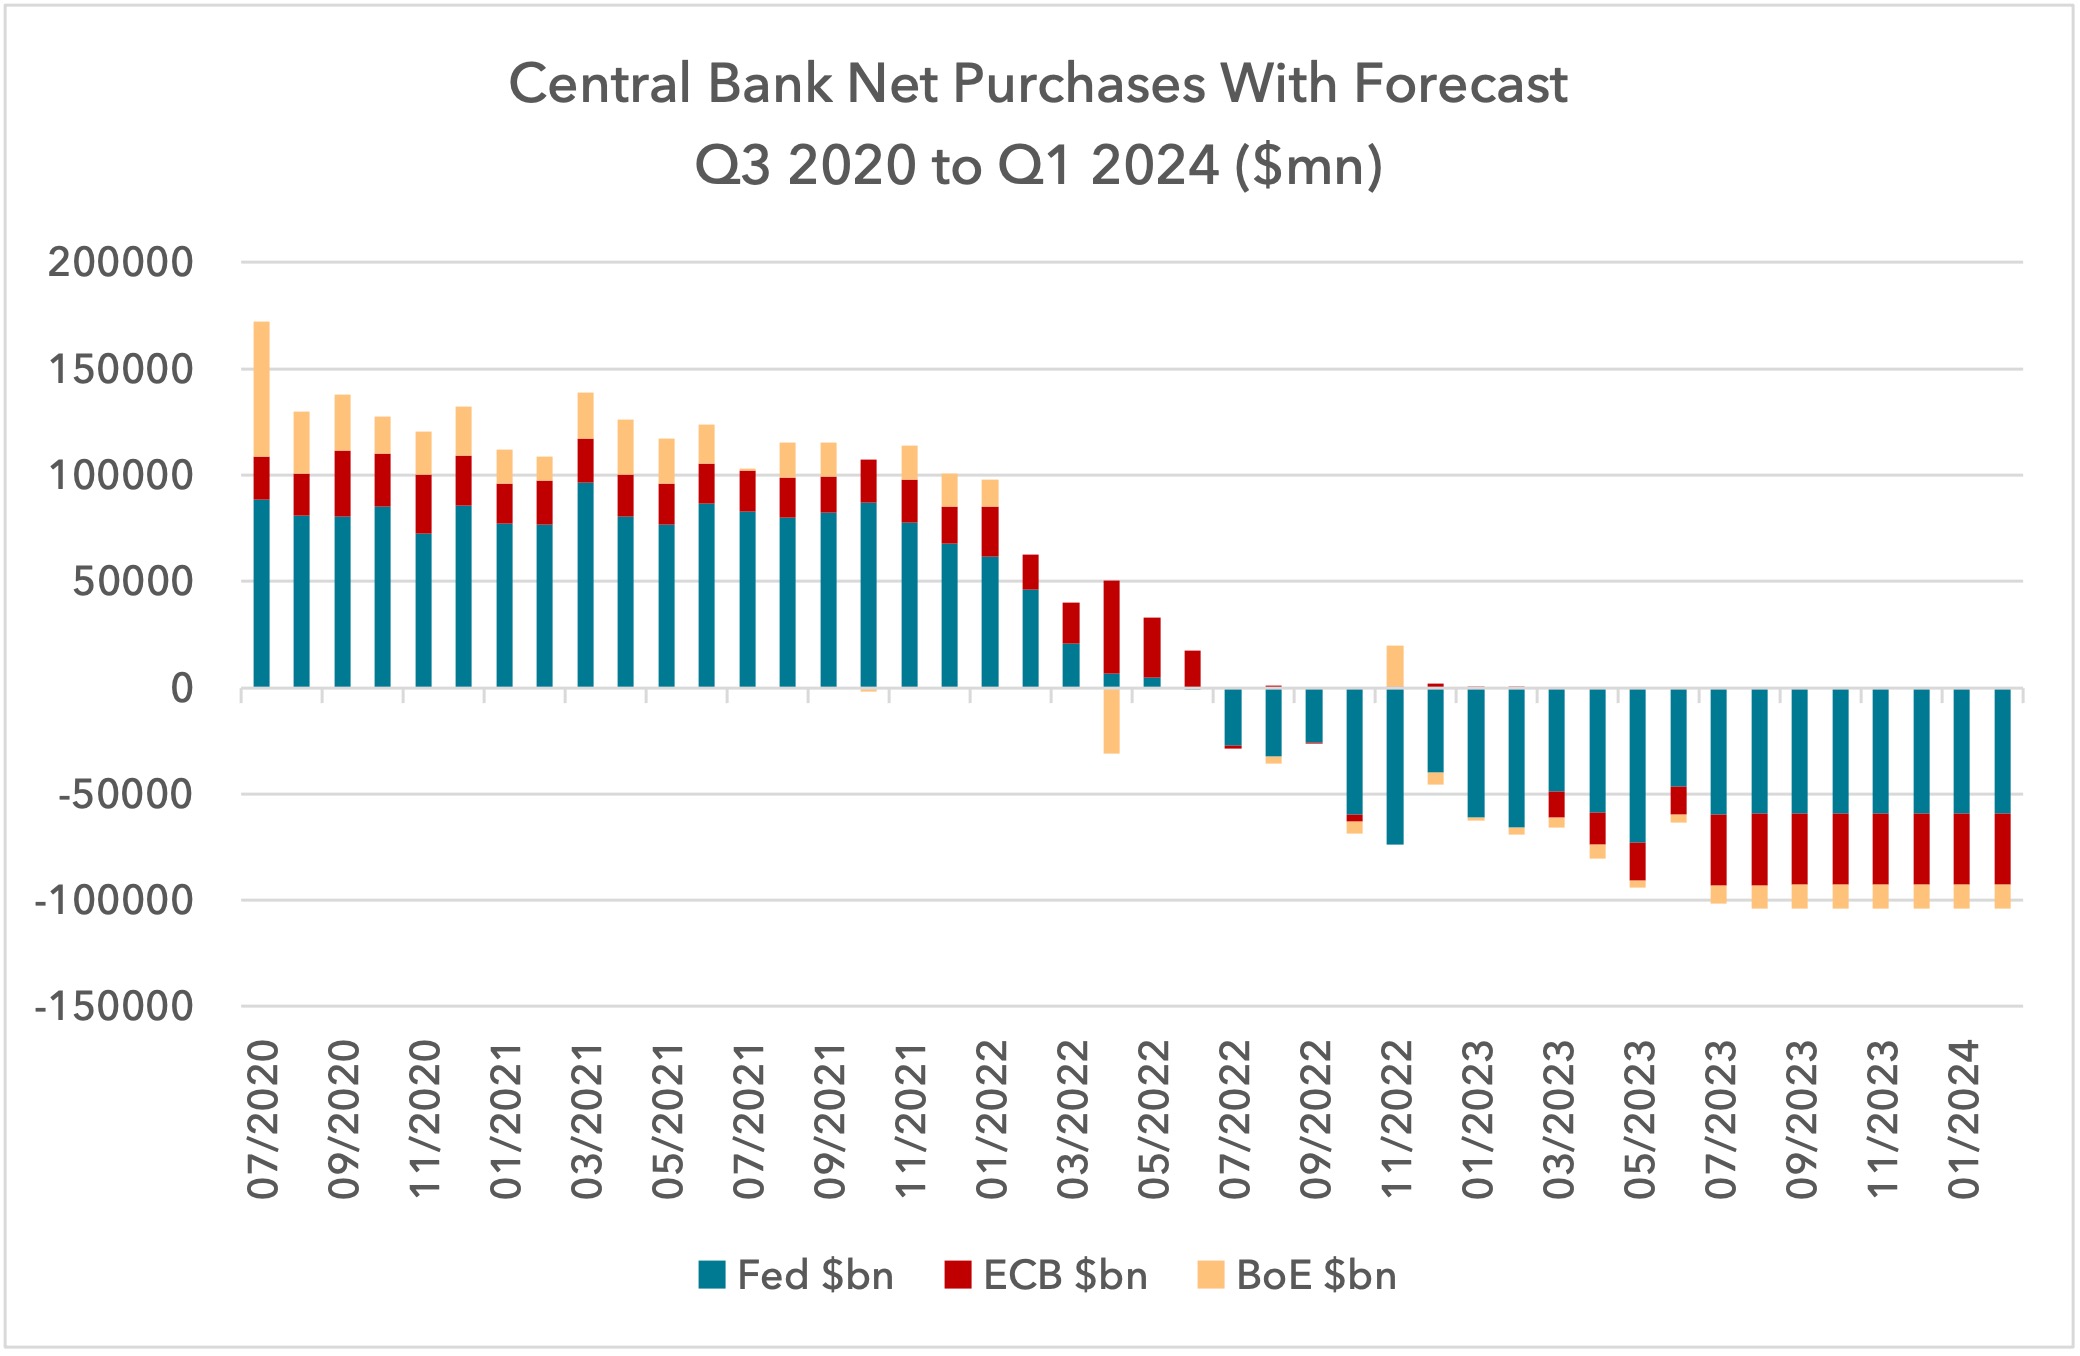
Central banks shifting from QE to QT is making a huge impact and it will continue for the foreseeable future. If we include the Fed, the ECB and the BoE, we have had a net shift in the market balance of government bonds of $2tn per year.
In June 2022, the trailing 12 month sum of purchases of government bonds by these three central banks was just under $1tn. As of June 2023, this had reversed to an increase in supply of bonds (from divestments and maturities) of $700bn. By Christmas 2023, the trailing 12 month increase in supply will be $1tn.
If we include just the Fed, the net change is $1.4tn. Below we show how the pattern of buying has shifted to selling, showing a time series from Q4 2020 out to a forecast to Q1 2024. The change started last summer with the supply of bonds deepening this July to $100bn per month.
 Changing appetite of large foreign owners of Treasuries
At the country level, the largest owners are Japan and China. Collectively they own $2tn or 8% of the market.
 Recently, both countries have seen a reduction in their holdings of Treasuries. This data is published by the US Treasury under its Treasury International Capital System (TIC). The data uses approximations of market values, and given that we have seen a sell-off in government bonds in 2021, some of the reductions will be driven by market movement.
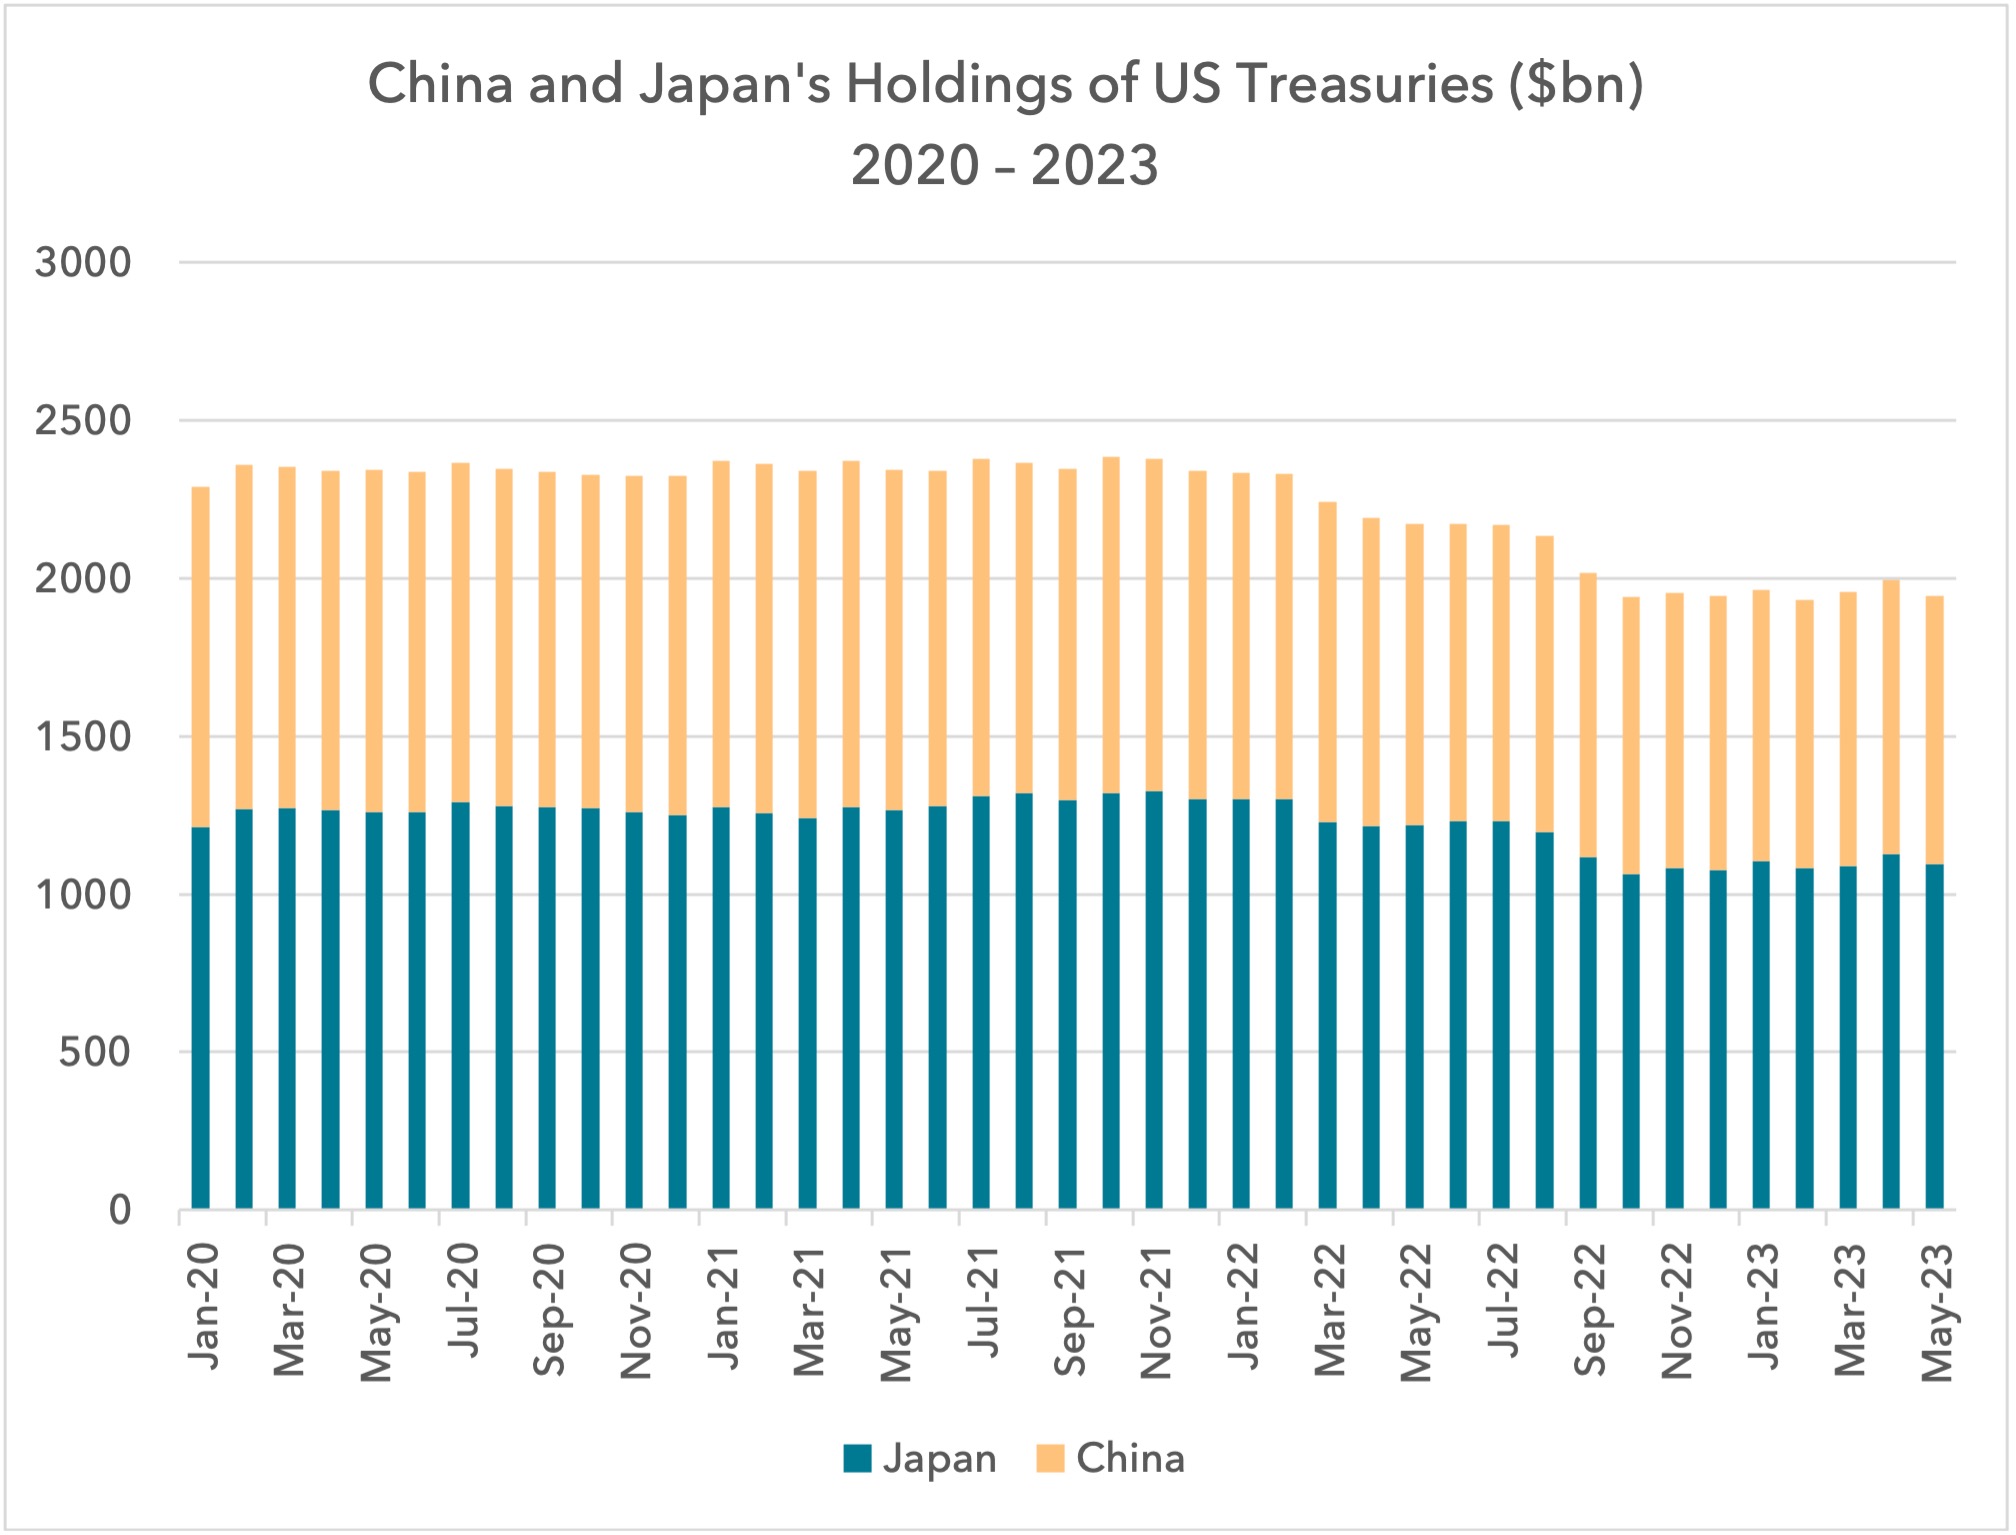 China started reducing its holdings in 2019, before the bond market sold off, and has seen a decline since then of $285bn. On a trailing 12 month basis, Japan and China have seen their holdings reduce by $123bn and $105bn respectively.
Now that Japan has lifted its 10 year yield target, Japanese investors are more incentivised to hold Japanese government bonds. When adjusted for hedging costs, US Treasuries yield less than JGBs. Japanese institutions own $1.1tn of US Treasuries and we could expect this value to decline.
It is also worth considering the potential implications of rising funding costs for Japanese debt. The higher the interest rates in Japan, the more Japanese capital will be required to fund it, and the less will be available for the rest of the world.
China’s appetite to own Treasuries has been considerably reduced since the Russian invasion of Ukraine. The freezing of Russian foreign exchange reserves was a large warning to any non-western-aligned country. China could also be expected to reduce its allocations further.
If we assumed a 5% reduction in Japan and China’s allocations on an annual basis, this would result in increased Treasury supply of $100bn per year.
New issuance
Earlier this year, the Congressional Budget Office published its budget and economic outlook from 2023 to 2033. In it they forecast the annual deficit and changes in debt outstanding based on current spending commitments. From this we can calculate the annual increase in the supply of Treasuries to fund the deficit. The average interest rate on public debt that they use to calculate these estimates appears quite generous. The 2.7% in 2023 rises only to 3.2% in 2033. Given the entire yield curve is above 4% today, these estimates require a big fall in bond yields for their estimates to be realised.
Even with this generous assumption of low interest rates, spending commitments mean there is still $1.6tn-$3tn of incremental annual issuance coming.
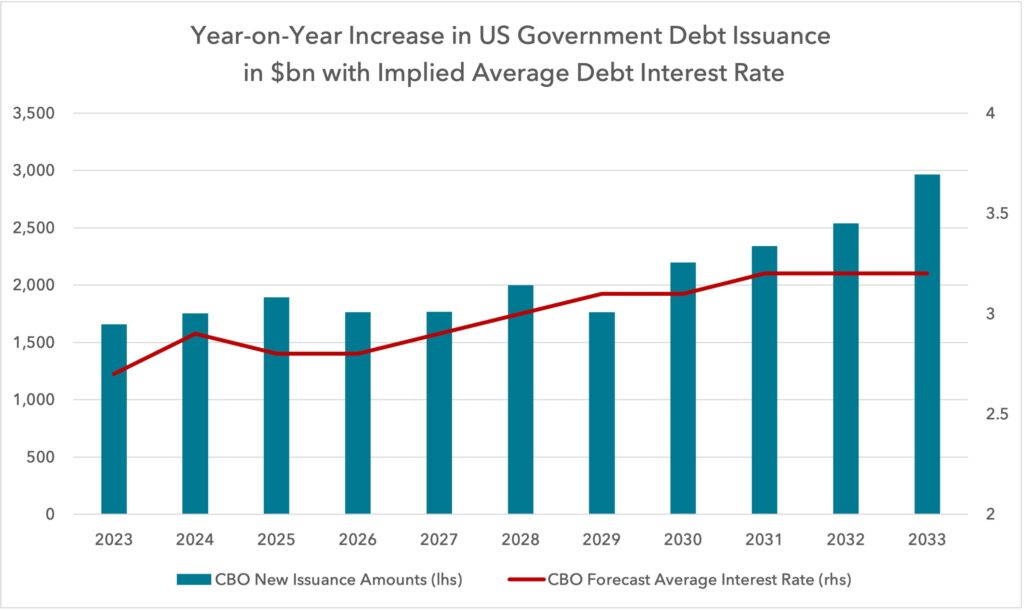 If we assume rates stay where they are today and the average interest rate moves to 4%, incremental issuance will need to rise by another c.$200bn annually.
Sizing the change in supply and demand for Treasuries
Since the summer of 2022, we have seen a reduction in demand for Treasuries from the central bank of c.$700bn per year. China and Japan may also have reduced their demand by $100-200bn per year. Annual supply is increasing by $700bn from the Federal Reserve for the time being, and by $1.5-$2tn per year from the Federal Government’s spending commitments.
This results in a net change in the balance of supply and demand for Treasuries of $3tn.
When looking at which buyers could fill this gap, it is not clear who can step up easily to absorb the supply. Mutual funds’ entire position in Treasuries today is $2.4tn. Banks’ entire position is $1.7tn. They are simply not big enough to absorb $3tn. The “Other” category is larger at $4.3tn. This group includes individuals and inter-dealer brokers amongst others, but even here, this category is not big enough. Non-Japanese and non-Chinese foreign buyers will also need to take up some slack, but it is not going to be easy.
Even when the Federal Reserve stops selling, the annual increase in the supply of Treasuries will be close to $2tn.
Eventually the yield will be sufficiently high to attract enough buyers and the market will find an equilibrium, but it is not clear what that level is.
UK and European government bond markets
We have focused our attention on US government bonds, given that they are the major component of global discount rates. The most similar market to the US is the UK. Here we can see very similar trends to those that are in place in America. The UK runs a large current account and fiscal deficit and has rising issuance and declining overall demand, given quantitative tightening.
EU countries have bond markets that are less reliant on foreign ownership, but debt to GDP ratios in some cases are high. Higher yields led by the US and UK should be expected to push European yields higher.
What this might mean for markets
Identifying what level of yield is required to balance the market is difficult. Is it near 4%, or 5% or 6%?
It could be argued that much if not all of the above is already priced-in and these elements are the major reason why yields have moved up as they have from c.1%-1.5% in 2019-2020 to 4% today.
But most investors do not see it that way. Most see this move higher in yields as a consequence of higher inflation and nominal growth. The fact that the term premium is still so low suggests there is limited pricing-in of these debt sustainability concerns.
Given the scale of continued issuance and the sheer size of the change in the market balance, it appears unlikely that yields will fall much in most circumstances.
Recession could see yields rise
Given the fragile nature of supply and demand, we have to be prepared for the possibility that recession is accompanied by higher yields. Whilst this would not have been seen by many market participants in their lifetime, the reality is a lower tax take means more issuance, further increasing supply. Lower economic growth would mean a lower pool of savings to facilitate demand. In a market that is already imbalanced between buyers and sellers, higher yields could be possible.
The key of course will be if the Fed or other central banks feel they have the cover to step in and buy. But that does not appear possible for the time being.
What this might mean for equities
If government bonds are losing their defensiveness, it has profound implications for equities and the economy. On the positive side for equities, allocations are already high in bonds. If bonds continue to perform badly, we could see some flows come back into equities, which could support prices.
Within equity sectors, the most important action is to assess the implications of interest rates staying high. We have written before that we can see many long duration assets discounting declines in interest rates in the near future. Their valuations need rates to go down quickly to justify their prices today.
The same applies for consumer-demand forecasts. It is hard to see the consumer managing to maintain discretionary spending at recent levels if rates do not fall.
Expensive equities therefore ought to be vulnerable, as in 2022, from lower multiples. Consumer-facing companies should see lower earnings as higher rates start to squeeze incomes.
Property appears especially vulnerable. Whilst real estate-facing equities have corrected significantly already, there are many listed real estate vehicles that cannot survive a multi-year period of 4-5% interest rates.
Equities that own infrastructure assets with high leverage also seem vulnerable. Many of these assets generate limited spreads over their cost of funding and are often at high valuations.
Financials are large owners of government bonds. Both banks and insurance companies could experience mark-to-market losses in their government bond positions. These could erode excess capital and shareholder distributions. Banks could be expected to see higher loan-losses if rates stay high and we see more property-related delinquencies.
European bank lending standards are high and capital positions are solid, and so this ought not to be an existential threat for any medium to large European-based bank, but the earnings story could be weaker than is currently expected over the coming 1-2 years.
In our process we need to see value and operational momentum. Banks are value, but we are unsure about their operational momentum and so we have reduced exposure. Autos similarly are value based on current earnings, but we believe revenue and earnings estimates could be too high.
Bond-like equities also need yields to fall for valuations to rise. High coupons on government bonds are a major source of competition for these equities and so elevated bond yields will cap and potentially compress valuations of some low-growth Utilities and Consumer Staples companies.
What might a defensive equity allocation look like?
If this thesis is correct, it does not leave a huge amount of the equity market that is attractive. We can imagine a Venn diagram of attributes that we believe will be supportive, in the event that higher yields are set to stay. Amongst these attributes that we are looking for in our holdings, we would include the following:
- Low valuation
- Strong balance sheet
- Supply-constrained industry
- Low credit risk & low ownership of sovereign debt
- Low exposure to discretionary spending
We see many Energy and Metals and Mining companies fulfilling this brief. Whilst higher rates can slow growth and limit commodity demand, we see supply constraint being sufficient to maintain earnings. Emerging markets are also in a very different economic cycle, where rate cuts have started. This can support commodity demand outside the developed world. Most of our holdings in these sectors have net cash positions with high free cash flow yields, offering solid dividends and buy-backs.
We can also find some Telecoms, Healthcare and Food Retail companies where the combination of free cash flow growth and low valuations is supportive.
Whilst many Industrials are now expensive, it is an idiosyncratic sector and we can find some European champions that represent secular growth stories at acceptable valuations.
Financials are the most complex. We continue to be cautious of Insurance, given limited earnings growth. In Banks, we are very selective, focusing only on those institutions with excellent credit quality both in loans and in their government bond holdings.
Why value should outperform
Having had a tricky January to May, value is starting to perform better. In this scenario of high bond yields, low valuation ought to be a critical source of protection.
A tipping point may be approaching, where investors start to price-in rates remaining high. This could cause major multiple compression for expensive growth equities, with the bear market in expensive securities returning.
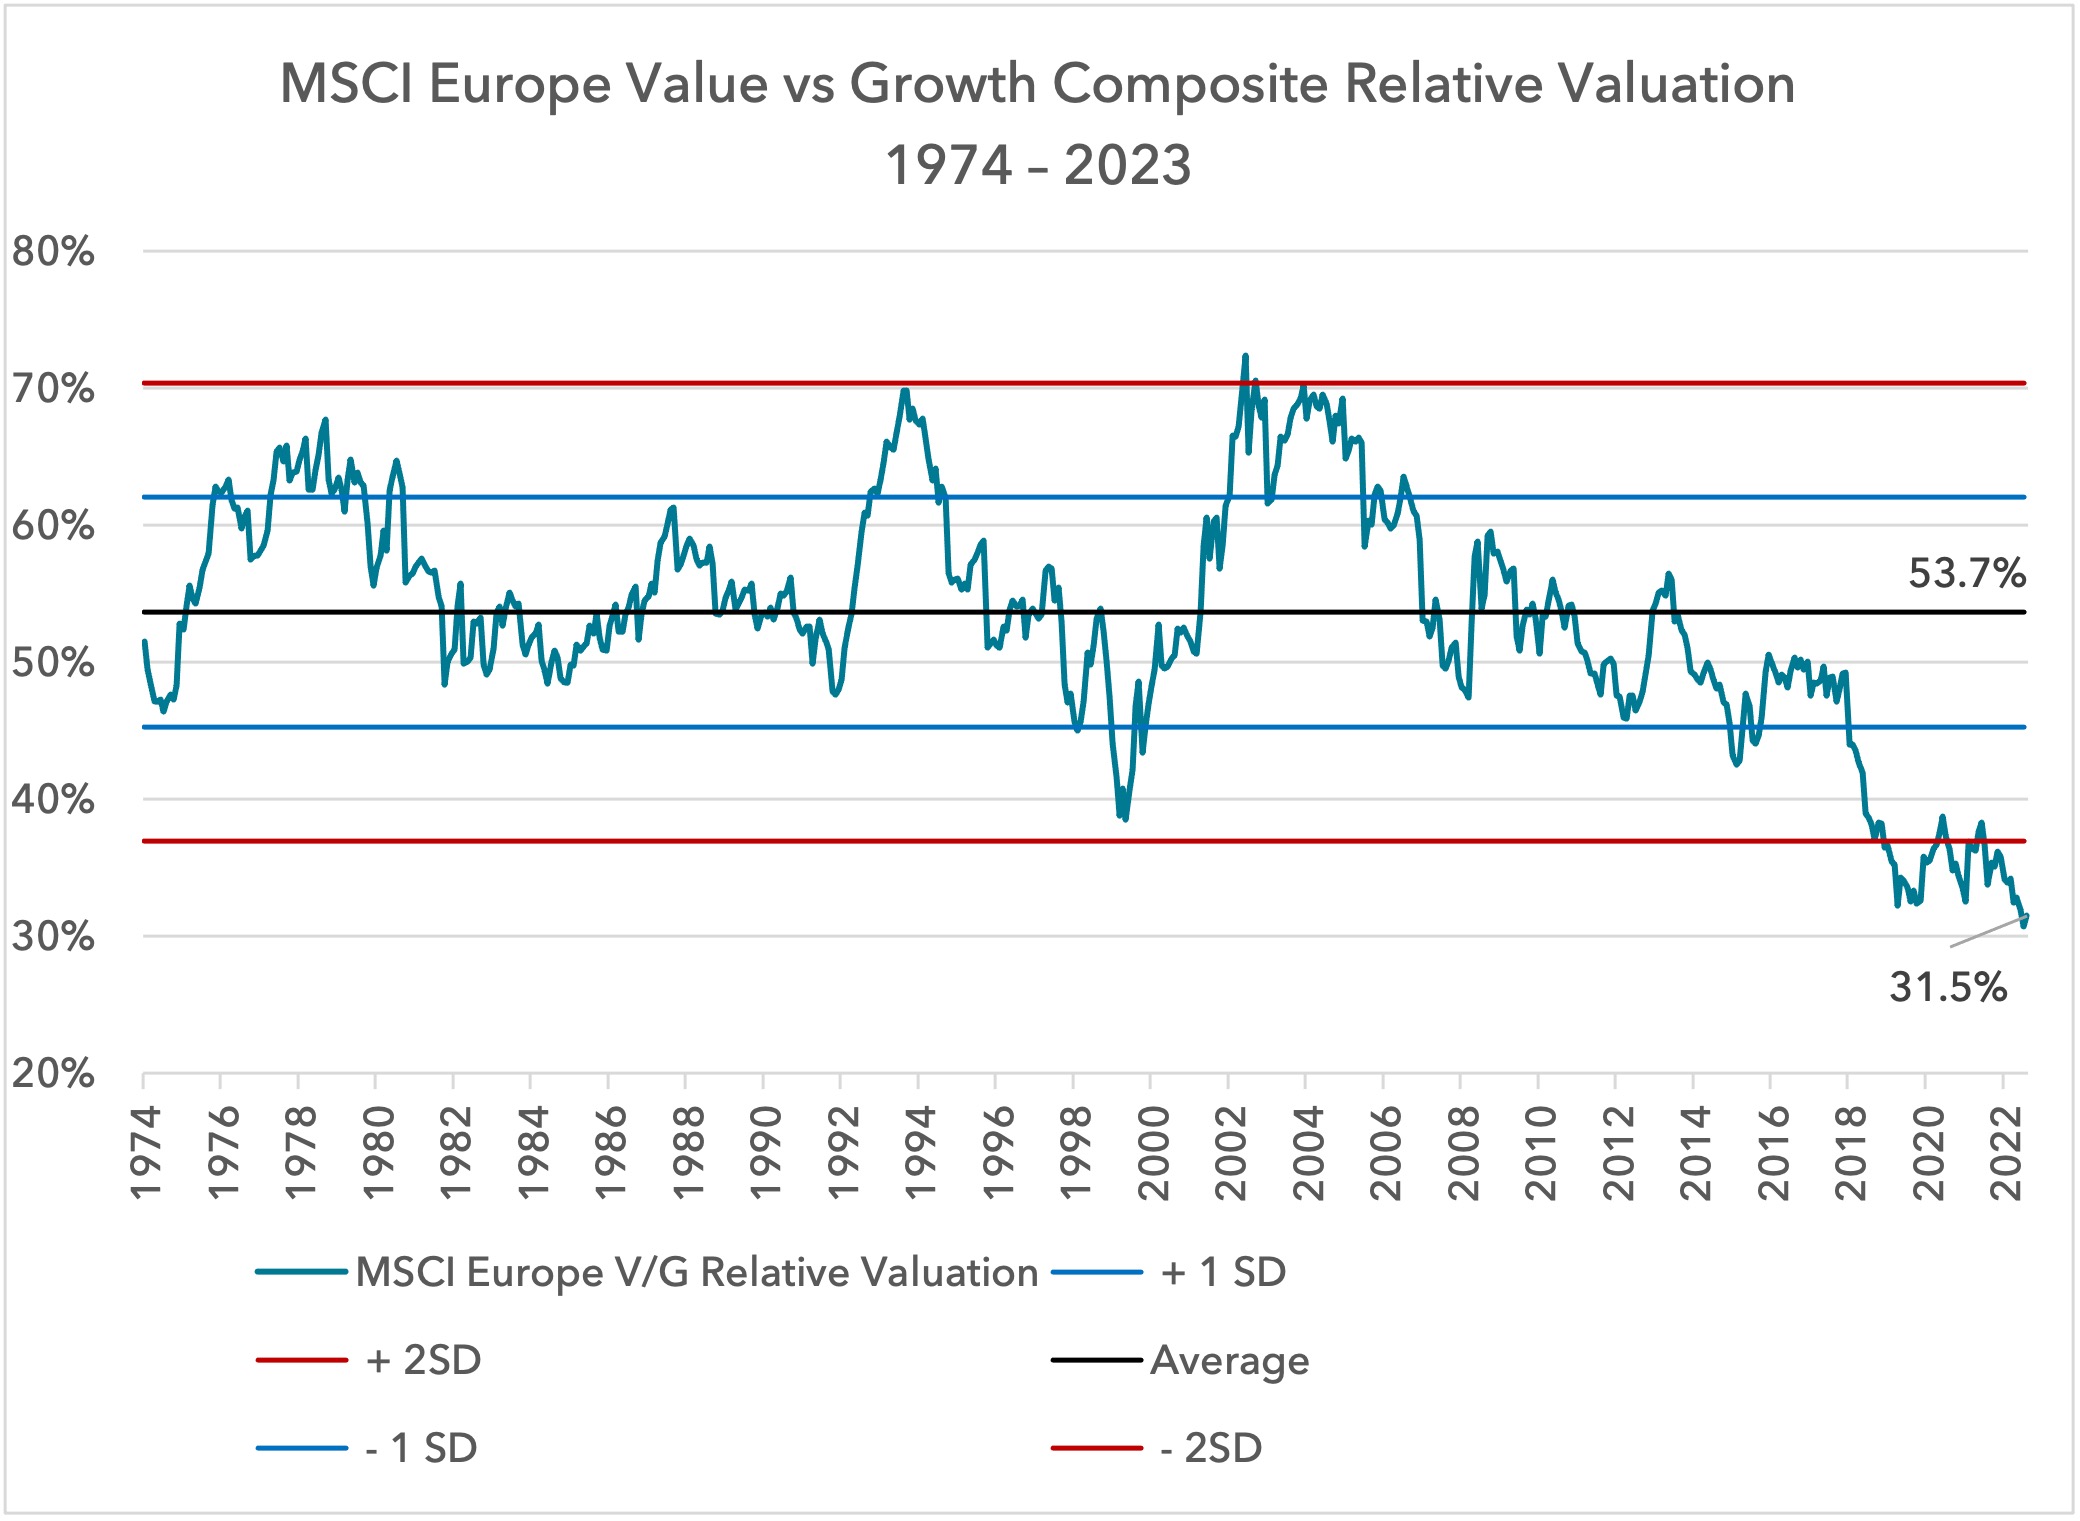
The backdrop is promising for relative performance, with value as cheap as it has been compared to growth in 50 years. It will not take much for value to outperform significantly.
 The Lightman European funds have a median 2023 and 2024 PE ratio of 10.1 and 9.5 respectively. The forecast dividend yield is 4.9%. Portfolio balance sheets have never been stronger. We anticipate improved absolute and relative returns for the remainder of the year.
Sources:
US Department of the Treasury, Treasury International Capital System (TIC), Bureau of the Fiscal Service, Federal Reserve Bank of New York, The Congressional Budget Office, The European Central Bank, the Bank of England, Lightman Investment Management
Legal
Disclaimer
This communication and its content are owned by Lightman Investment Management Limited (“Lightman”, “we”, “us”). Lightman Investment Management Limited (FRN: 827120) is authorised and regulated by the Financial Conduct Authority (“FCA”) as a UK MiFID portfolio manager eligible to deal with professional clients and eligible counterparties in the UK. Lightman is registered with Companies House in England and Wales under the registration number 11647387, having its registered office at c/o Buzzacott LLP, 130 Wood Street, London, United Kingdom, EC2V 6DL.
Target audience
This communication is intended for ‘Eligible Counterparties’ and ‘Professional’ clients only, as described under the UK Financial Services and Markets Act 2000 (“FSMA”) (and any amendments to it). It is not intended for ‘Retail’ clients and Lightman does not have permission to provide investment services to retail clients. Generally, marketing communications are only intended for ‘Eligible Counterparties’ and ‘Professional’ clients in the UK, unless they are being used for purposes other than marketing, such as regulations and compliance etc. The Firm may produce marketing or communication documents for selected investor types in non UK jurisdictions. Such documents would clearly state the target audience and target jurisdiction.
Collective Investment Scheme(s)
The collective investment scheme(s) – WS Lightman Investment Funds (PRN: 838695) (“UK OEIC”, “UK umbrella”), and WS Lightman European Fund (PRN: 838696) (“UK sub-fund”, “UK product”) are regulated collective scheme(s), authorised and regulated by the FCA. In accordance with Section 238 of FSMA, such schemes can be marketed to the UK general public. Lightman, however, does not intend to receive subscription or redemption orders from retail clients and accordingly such retail clients should either contact their investment adviser or the Management Company Waystone Management (UK) Limited (“Waystone UK”) in relation to any fund documents.
The collective investment scheme(s) - Elevation Fund SICAV (Code: O00012482) (“Luxembourg SICAV”, “Luxembourg umbrella”), and Lightman European Equities Fund (Code: O00012482_00000002) (“Luxembourg sub-fund”, “Lux product”) are regulated undertakings for collective investments in transferrable securities (UCITS), authorised and regulated by the Commission de Surveillance du Secteur Financier (CSSF) in Luxembourg. In accordance with regulatory approvals obtained under the requirements of the Law of 17 December 2010 relating to undertakings for collective investment, the schemes can be marketed to the public in Luxembourg, Norway, Spain, and Republic of Ireland. Lightman, however, does not intend to receive subscription or redemption orders from any client types for the Lux product and accordingly such client should either contact a domestic distributor, domestic investment advisor or the Management Company Link Fund Solutions (Luxembourg) S.A. (“Link Luxembourg”) in relation to any fund documents.
Luxembourg umbrella and Luxembourg sub-fund are also approved for marketing to professional clients and eligible counterparties in the UK under the UK National Private Placement Regime (NPPR). UK registration numbers for the funds are as follows: Elevation Fund SICAV (PRN: 957838) and Lightman European Equities Fund (PRN: 957839). Please write to us at compliance@lightmanfunds.com for proof of UK registration of the funds.
Luxembourg sub-fund is also approved for marketing to qualified investors in Switzerland, within the meaning of Art. 10 para. 3 and 3ter CISA. In Switzerland, the representative is Acolin Fund Services AG, Leutschenbachstrasse 50, 8050 Zurich, Switzerland, whilst the paying agent is NPB Neue Privat Bank AG, Limmatquai 1 / am Bellevue, 8024 Zurich, Switzerland.
Accuracy and correctness of information
Lightman takes all reasonable steps to ensure the accuracy and completeness of its communications; we however request all recipients to contact us directly for the latest information and documents as issued documents may not be fully updated. We cannot accept any liability arising from loss or damage from the use of this communication.
Wherever our communications refer to a third party such as Waystone, Link, Northern Trust etc., we cannot accept any responsibility for the availability of their services or the accuracy and correctness of their content. We urge users to contact the third party for any query related to their services.
Important information for non-UK persons (Including US persons)
This communication is not intended for any person outside of the UK, Switzerland, or the European Economic Area (EEA). Lightman or any of the funds referenced in this communication are not approved for marketing outside of the UK, Switzerland, or the EEA. All such persons must consult their domestic lawyers in relation to services or products offered by Lightman.
Risk warning to all investors
The value of investments in any financial assets may fall as well as rise. Investors may not get back the amount they originally invested. Past performance is not an indicator of future performance. Potential investors should not use this communication as the basis of an investment decision. Decisions to invest in any fund should be taken only on the basis of information available in the latest fund documents. Potential investors should carefully consider the risks described in those documents and, if required, consult a financial adviser before deciding to invest.
Offer, advice, or recommendation
No information in this communication is intended to act as an offer, investment advice or recommendation to buy or sell a product or to engage in investment services or activities. You must consult your investment adviser or a lawyer before engaging in any investment service or product.
GDPR
Lightman may process personal information of persons using this communication. Please read our privacy policy.
Copyright
This communication cannot be distributed or reproduced without our consent.