
In moments of high volatility it can be helpful to assess markets using a long-term perspective. In this note we look at the long-term case for European equities compared to US equities in absolute and relative terms.
The recent tariff announcements appear to reflect a longer-run trend, which is the accelerating reversal of globalisation. Economic nationalism is on the rise and international cooperation is declining. This is a significant threat to equity market valuations, since return on equity may be peaking at the same time that markets face a persistently elevated cost of capital.
But at the country level there may be varying degrees of vulnerability. US asset prices have been the major beneficiary of this globalised world, as US financial markets received capital account inflows in exchange for US current account deficit outflows. As these trends reverse, US assets may see the most selling pressure.
Current account surplus countries or regions like Europe ought to be less vulnerable, since their asset prices have not benefited from significant capital account inflows. This may leave their financial markets less vulnerable to this reversal, if it continues.
Perhaps more importantly, this major disruption to the global economic system is occurring at a moment when US markets are already fragile.
The forces that propelled US outperformance over the past decade were already likely fading. Whilst the short term is impossible to assess, in this note we show that valuations, allocations and policy signals ought to support European outperformance over the US in the intermediate term.
The balance of payments
The balance of payments reflects a country’s economic relationship with the rest of the world. This identity suggests that the current account + the capital & financial account = zero.
In the globalised world order of the past four decades, an economic relationship was established whereby current account surplus countries would re-invest those surpluses into deficit countries, in order to fund that deficit spending.
The US was the ultimate example of a current account deficit country, with the diagram below showing how this status was self-reinforcing and supportive of US asset prices.
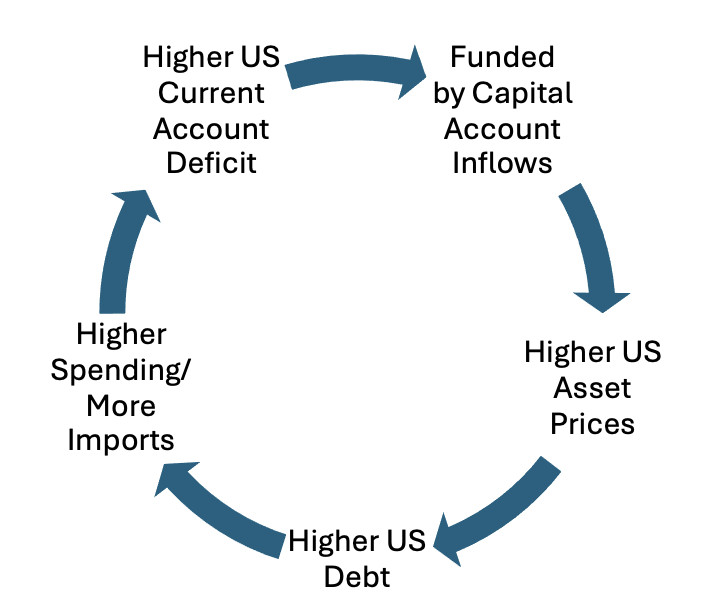
This process helped create the hyper financialisation of the US that we know today. The dominance of US markets could not have happened without constant flows of global capital into the country.
Trump’s intense focus on shrinking the US current account deficit, if successful, will mechanically reduce the size of US capital account inflows. This ought to, in turn, provide less support for US asset prices than investors are used to.
Markets are confused about how far this process will go and at what speed. But either way, we are in a period of major economic disruption as global trade and capital flows are attempted to be re-ordered.
Why Europe over the US
US exceptionalism is a recent phenomenon
Below we show European equities versus US equities measured in US dollars from 1969 to 2007 on a log scale. What is striking is the consistency of European outperformance during this time. From 31 December 1969 to 31 October 2007, Europe returned 2228% versus the US return of 1466%.
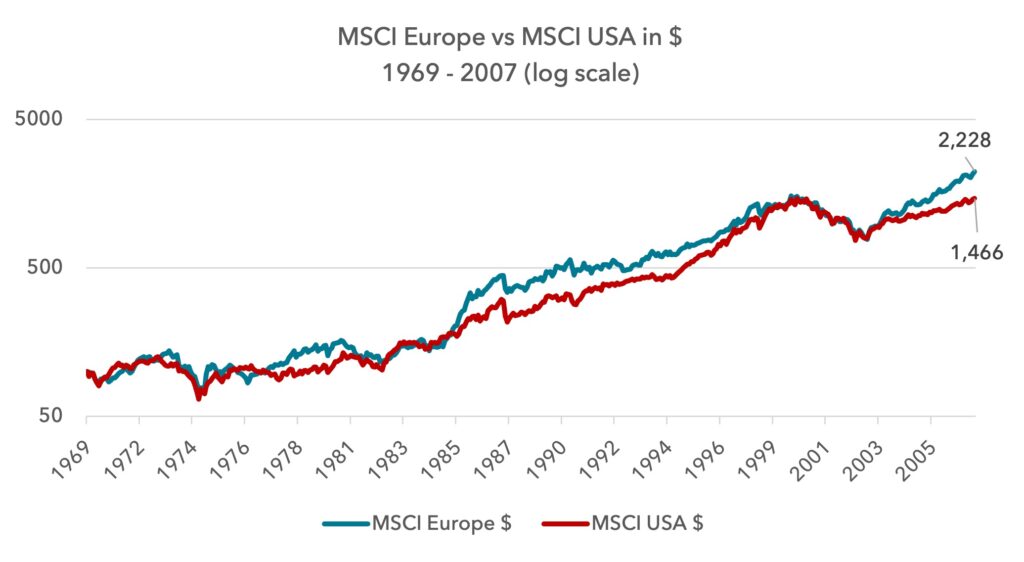
The US overtook Europe in 2014 and has clearly performed extraordinarily over the past decade. But a longer-term perspective suggests the US has no pre-ordained right to outperform. There was something exceptional about the past decade, relative to history.
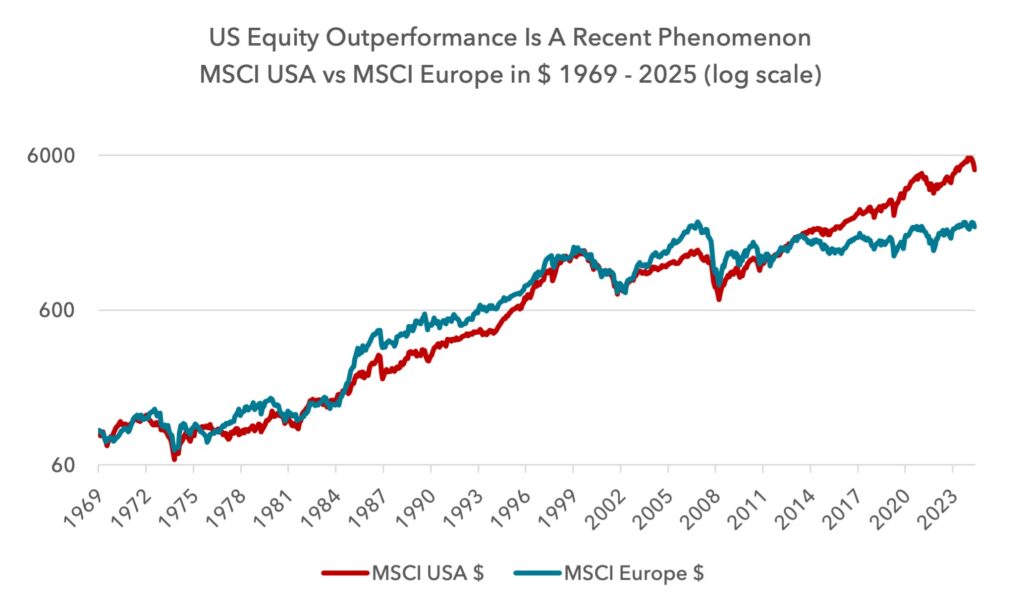
In order to assess whether the US can continue its outperformance of Europe, we break down the components that drove the last decade’s divergence in the section below.
Multiple expansion of the US vs Europe
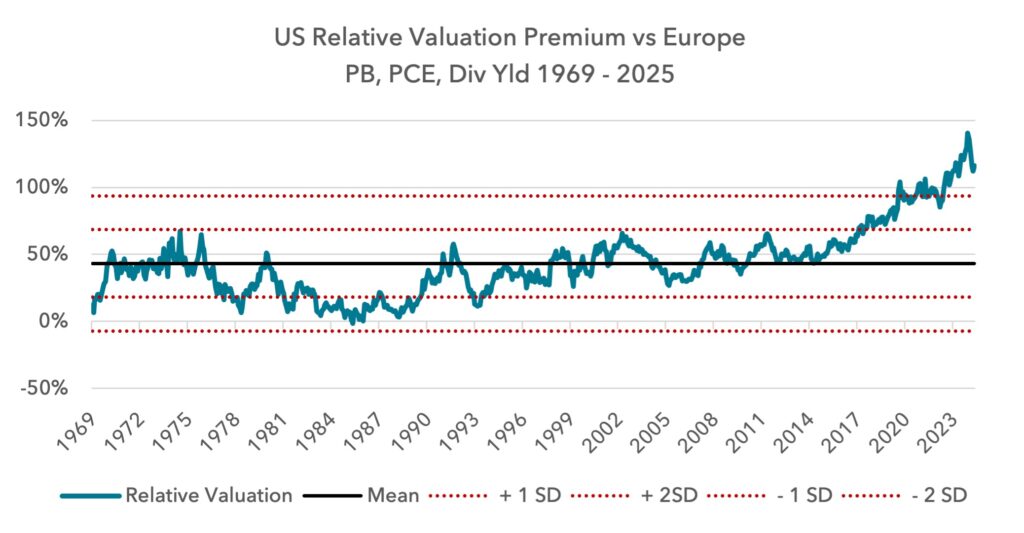
From 1969 to 2014 US equities traded at an average 34% premium valuation to Europe. The range of that premium was pretty consistent, from 0% at the low end to 65% at the high end. But from 2014 US equities moved to a sharply more expensive rating relative to Europe than in the past. Today the premium is 116%, having reached a peak of 141% in November 2024, post Trump’s victory.
This data uses an average of price to book, price to cash earnings and dividend yield.
Absolute valuations became extended in the US relative to history
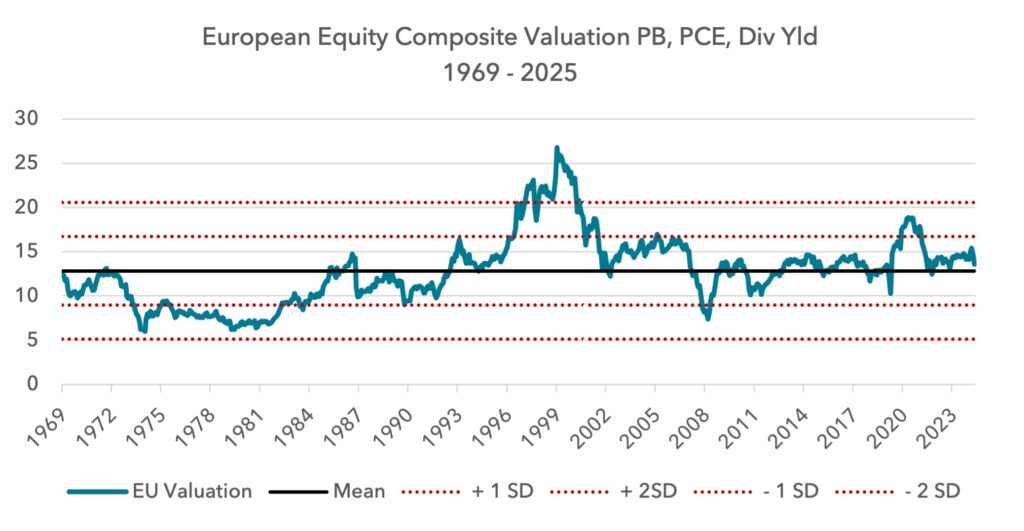
As we show below, European equity valuation is not looking particularly stretched in absolute terms. It is trading at a 10% premium to its 55-year average valuation. It is nowhere near the peak valuations during the dotcom era. It is 0.2 standard deviations or 10% expensive relative to its post 1969 average. This is a broadly comforting message for long-term asset allocators into Europe.
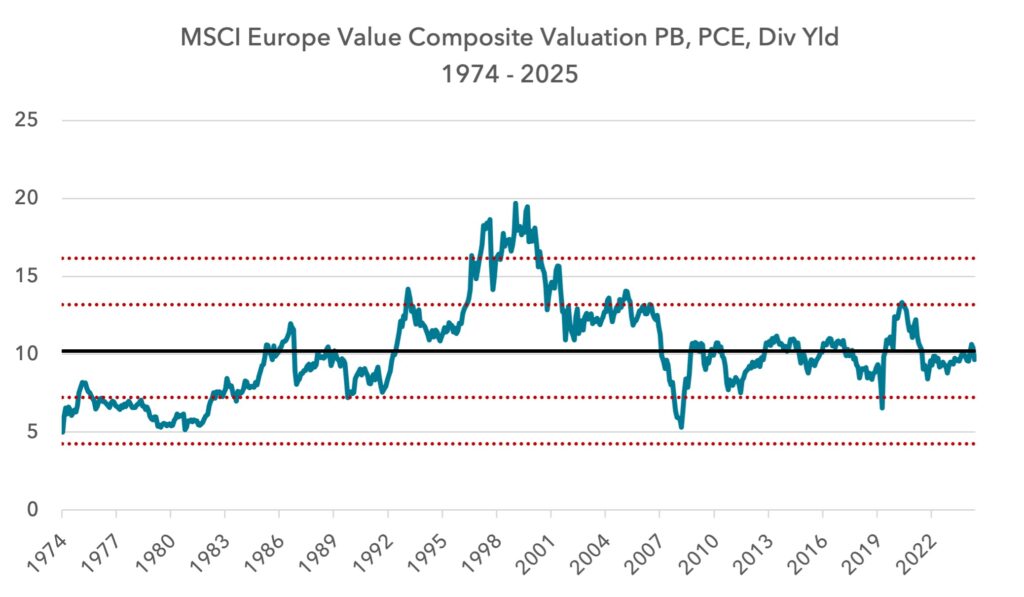
Within the European equity market, as we have shown in past notes, value is cheap relative to growth. In absolute terms, European value is fairly cheap relative to its own history, trading 5% below its 50-year average composite valuation.
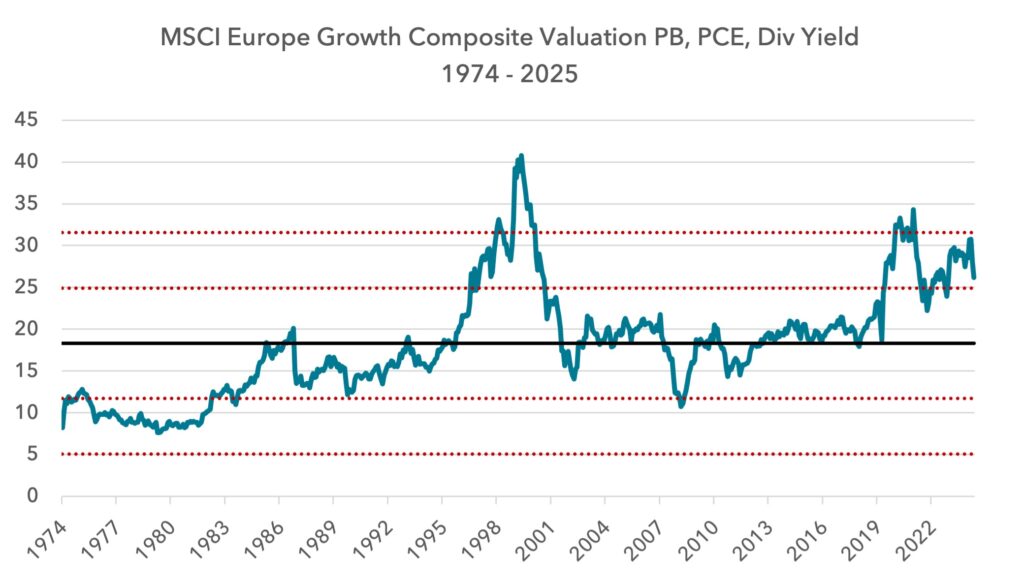
European growth, in contrast, trades at a 30% premium to its 50-year average valuation. This explains the scale of the alpha opportunity for value over growth that remains in Europe today.
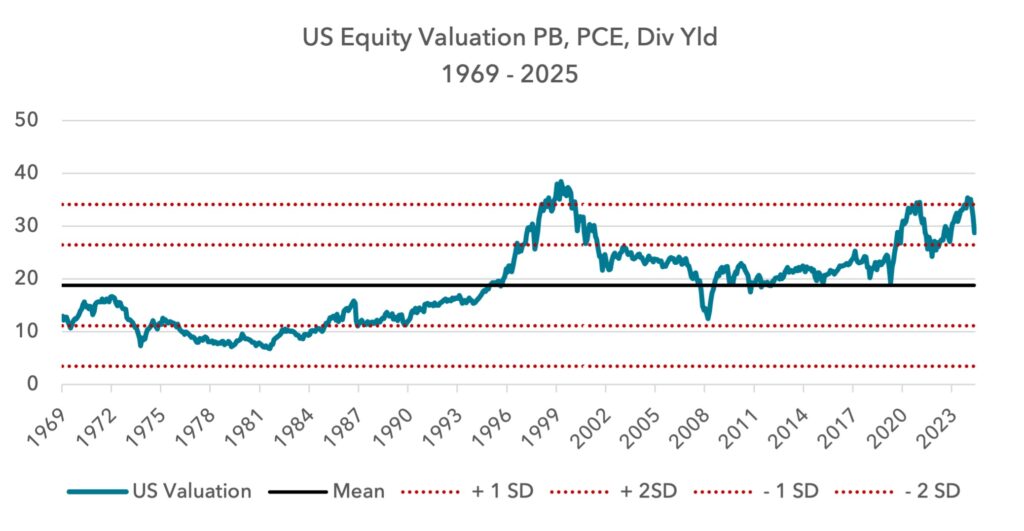
The US is a different story, with the market more expensive. Just two weeks ago US valuations were close to a record, and at similar levels to the peak of the dotcom boom and late 2022. Even after the recent sharp declines, US equities are still 1.3 standard deviations expensive. A return to the mean US valuation would involve a fall of 35% from current levels.
Looking ahead, it is hard to argue that the US can continue to re-rate versus Europe, given valuations were so recently at bubble levels and the relative valuation premium is so high. This suggests the re-rating engine of outperformance is not likely to return to the US any time soon. We might also need to be prepared for the valuation gap to narrow, which may hinder US absolute and relative performance going forward.
The impact of the Magnificent Seven
Since 2014 MSCI USA has returned c.200%. Nearly half of that contribution came from the Magnificent Seven stocks.
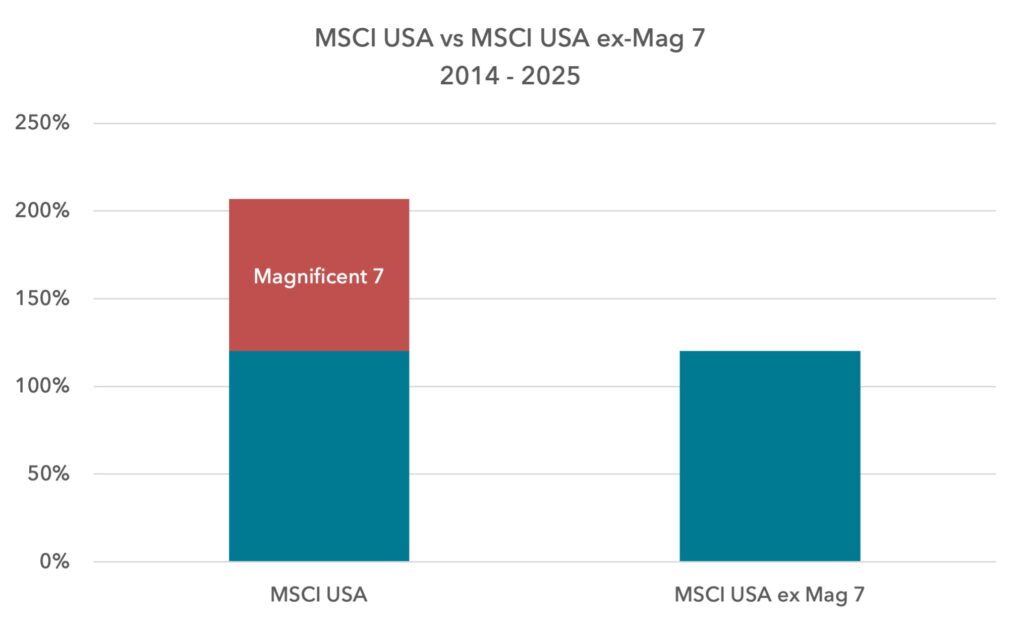
This is not to suggest that the contribution from these companies was false or not justified, simply that outside these mega caps, the index return was more muted. The average US stock was not performing anything like as well as these seven companies.
Mega cap tech experienced a golden period from 2010-2020 where these disruptive businesses with capital light models faced little to no regulation worldwide, or anti-trust initiatives. With a cost of capital of zero and no real impediments to their growth, they were able to scale up significantly and dominate their markets.
Today the situation is very different. These businesses are now incumbents, with lower growth potential, higher capital intensity and higher capital costs. Outside the US, the regulatory position has also become significantly more hostile. These service-based companies are uniquely vulnerable to countermeasures by countries hit by US tariffs.
It is not likely that these companies will deliver the boost to US index returns like in the last decade. On the contrary, given valuations, regulations and geopolitics, there is a reasonable probability that these companies will weigh on US returns, in the way they have in 2025 so far.
Relative buybacks
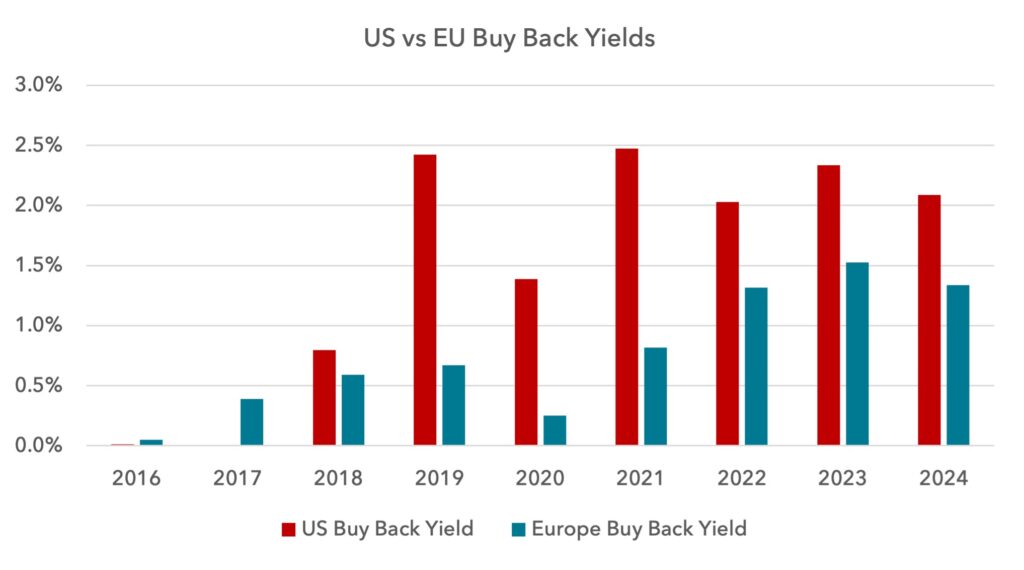
Over the past eight years the US has undertaken more than double the amount of buybacks as a proportion of market capitalisation compared to European companies. This helps to lift free cash flow, earnings and dividends per share, as the number of shares outstanding shrinks.
The following series uses a Bloomberg methodology to aggregate buybacks across indices and is consistent for both markets.
In most markets buybacks are taxed as capital gains at the point of sale, whereas dividends are taxed as income. In the US this has provided a strong tax advantage for the former, but recent policy changes have reduced the advantage.
In the Inflation Reduction Act of 2022, the administration imposed a new 1% excise tax on buybacks. Whilst this reduced the size of the tax advantage of buybacks, it is still in place.
There is talk that the current Trump administration may make further changes to the tax law to eliminate the buyback advantage completely and to incentivise dividend payments. If this proposal becomes law, it would be a significant drag on US equity relative performance, since earnings per share would grow less quickly than otherwise would be the case.
What is notable in the chart above is that buybacks are growing in significance in Europe and the relative buyback yield advantage of the US is shrinking. European companies are embracing buybacks more. This is a cultural shift that is growing in importance for European equities. At Lightman we encourage all of our holdings to perform buybacks where appropriate, because the empirical evidence of their efficacy in supporting share price performance is strong.
There is variability in the treatment of buybacks across Europe and progress is not linear. France, in its 2025 Finance Bill, passed an 8% tax on buybacks carried out from March 2025 to February 2026. Whilst this headwind exists, the broad direction of travel for Europe is to close the gap between the US in respect of the buyback yield, and this can be seen as constructive for Europe’s long-term relative performance.
Earnings Growth
MSCI USA has grown earnings per share by 90% since 2014 versus Europe at only 30%. However, all of this outperformance occurred from 2014 – 2019. Since 2020, both Europe and the US have seen similar earnings growth of 60% and 65%.
Going forward, the contribution of buybacks and the performance of mega cap tech will likely be key for which market grows earnings quicker. In the short run, Europe has already been close to recession over the past year, whilst the US has not, but the latter is now slowing and so may face a higher delta. Either way, there is not a clear argument to suggest the US index will grow earnings per share faster than Europe in the coming years.
Flows
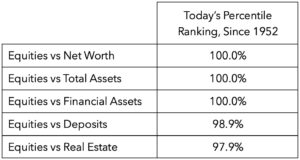
We have written in recent notes about the extraordinary allocations into US equities. US households are in the 99th or 100th percentile in equities relative to other assets.
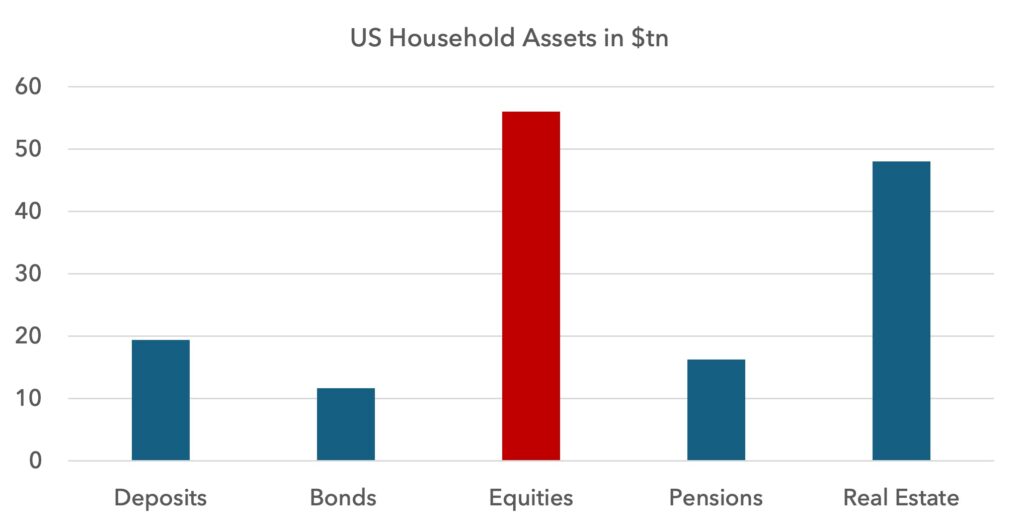
Below we show the breakdown of US financial asset allocations by value since 1952. This data is as at Q4 2024. US households have close to $60tn in equities.
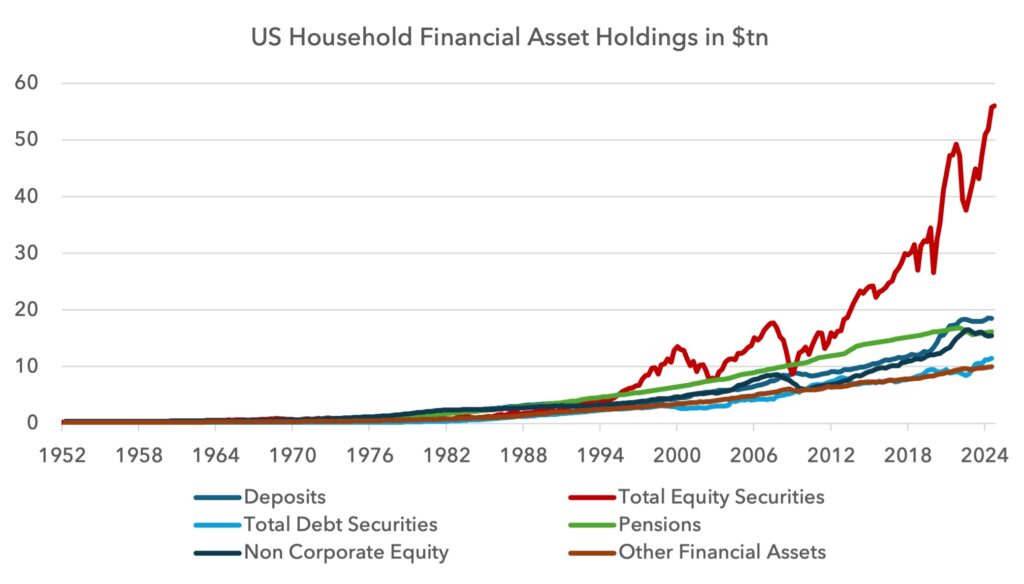
US households have more in equities than they hold in real estate. Whilst this has happened before, it is rare.
This is relevant because it underscores the weight of potential selling, should sentiment turn more structurally bearish. Clearly we have seen a major downturn in sentiment in the last week, but it underscores the scope of a downside move, should investors decide to allocate out of equities in a more comprehensive manner.
It also shows how equity market outcomes can impact the economy. Because so much consumer net worth is tied to the equity market, a rising market can lift the economy as consumers feel emboldened to spend some of their gains in net worth. But a falling market can slow the economy, as consumers retrench due to stock market losses. In this case, the tail is wagging the dog.
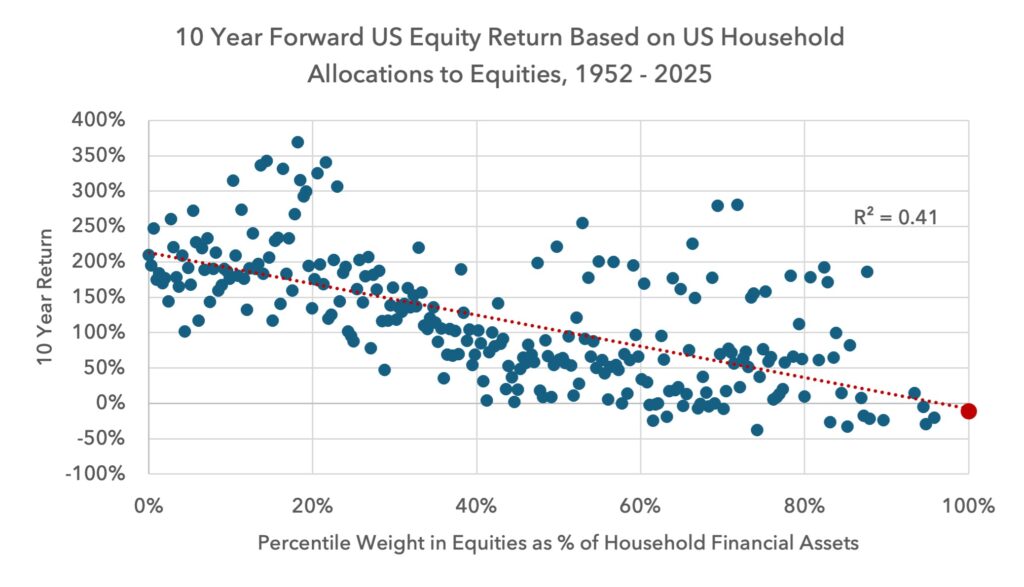
Below we show 10-year forward returns based on household allocations to equities as a percentage of financial assets. We plot today’s reading on the regression line. The R^2 is not particularly high but it shows that higher allocations to equities tend to be a headwind for 10-year forward returns
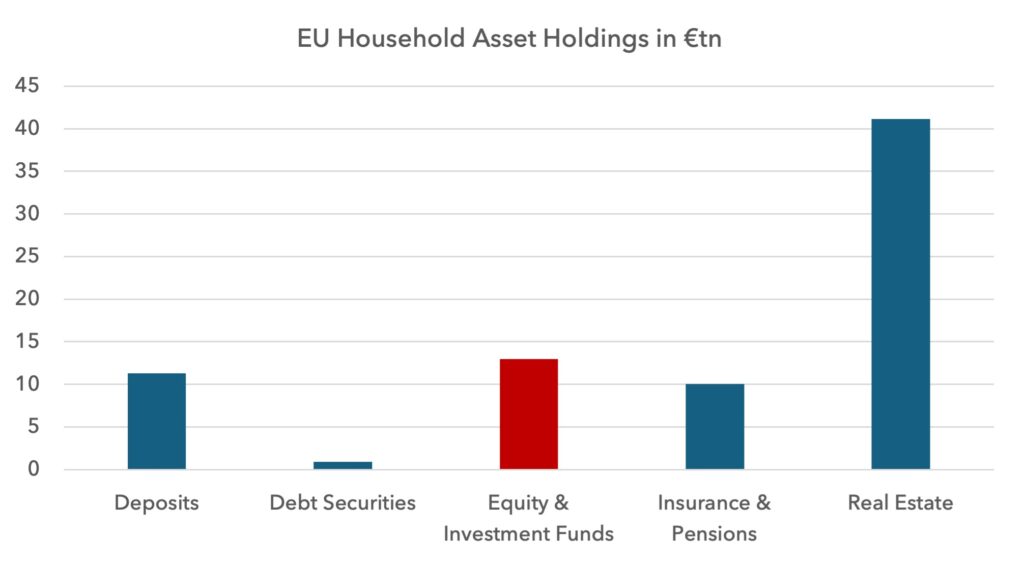
Europe and the UK have much smaller positions in equities compared to other assets. This side of the Atlantic, real estate dominates net worth. Equity market declines may not have such an outsized impact on consumer confidence, which may provide some economic resilience in the months ahead.
The other element with respect to flows is the scale of foreign ownership of the US market. Today foreigners own $17tn of US equities. There is nothing particularly worrying about this number, but it is worth noting that holdings have nearly tripled since 2016. Over the long term this has tended to move in line with US equity valuations, but there has been an acceleration over the past 5 years.
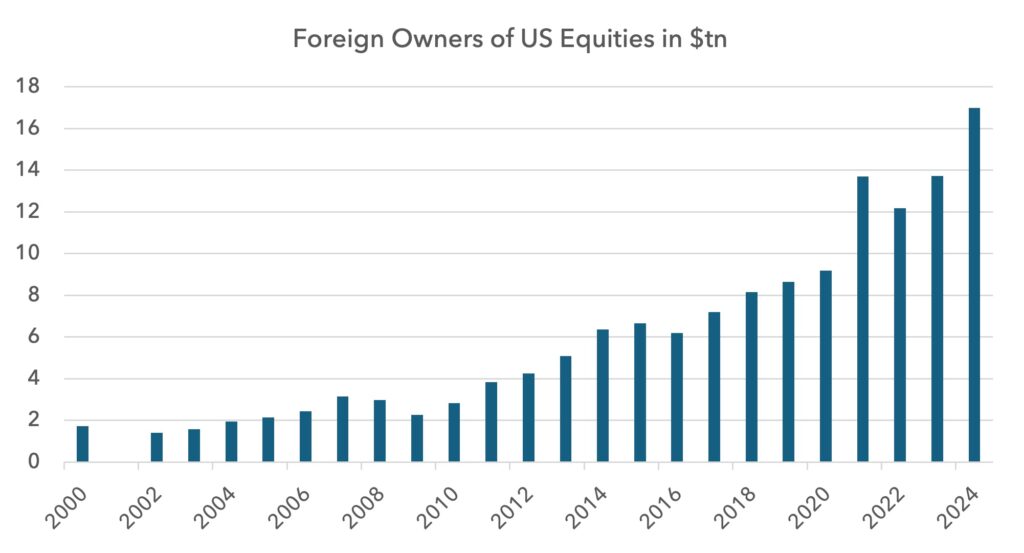
Below we show the largest holders of US equities by foreign domicile. The financial centres are obviously high on the list. Some of the fastest increases in US allocations over the last 5 years have come from France, Germany, Ireland, South Korea, Australia and Singapore. In all of these country examples, investors have been sharply increasing weightings in the US compared to the past.
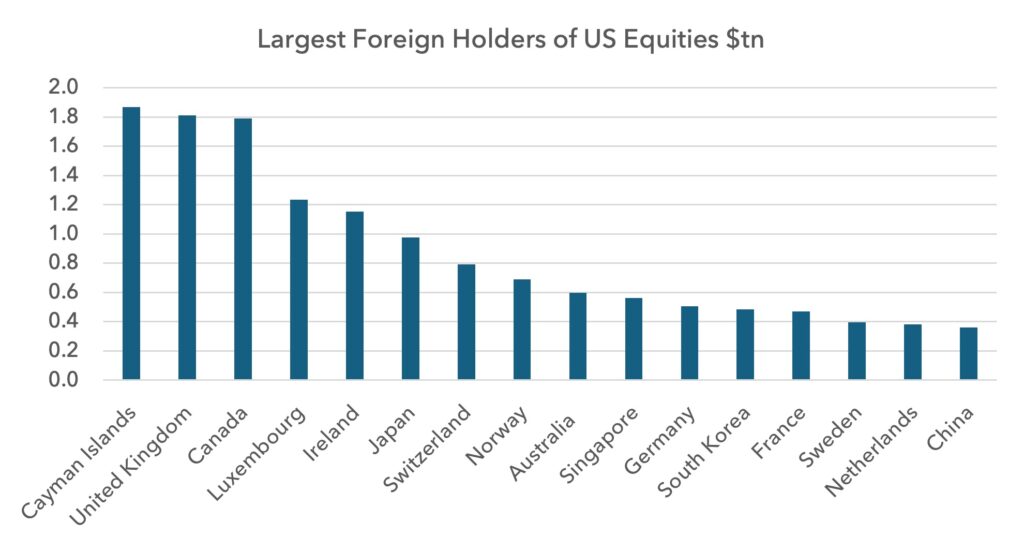
Depending on how international relations play out, certain jurisdictions may be less likely to maintain these weightings than others.
In the event of international relations breaking down more comprehensively, we also need to consider the more extreme possibility of capital controls in certain jurisdictions and what this might mean for certain markets. In this severe scenario, investors may be better served keeping money closer to home, or at least in jurisdictions where there is a lower vulnerability to a reversal of capital flows.
Policy
Whilst the Trump administration has shocked investors with the recent tariff announcements, there had been many other structurally negative developments prior to this. When Trump talks about the need to “take Greenland” or Panama, the statement alone is dangerous and undermines US asset valuations. Property rights and the rule of law are at the heart of investing, and the higher the security of those property rights, the higher the valuation. As property rights weaken, valuations must fall.
The US has been the standard bearer in upholding property rights around the world since the Second World War and its asset prices have benefitted accordingly.
US military dominance was also part of this calculus. Western powers would submit to US hegemony in exchange for US protection in upholding the Western rules-based order. Nato countries would buy US military equipment, thereby subsidising platform development, which benefitted the US, which in turn enabled the US to provide that protection. The close military connection between the US and the West also incentivised capital and financial inflows into the US.
Trump is upending all of these established norms. If Denmark, a staunch US ally, cannot keep Greenland, then why should any investor expect the US to protect their own interests? Investors need to handicap the rising risks that their own economic interests will not be upheld.
By forcing Europe, Japan and South Korea to become militarily more self-sufficient, Trump is reducing the need of these countries for US support. Whilst this sounds like a better situation for the US, it further reduces the incentives for Western-aligned powers to invest in the US. This is another step that undermines US capital flows and therefore asset prices.
Europe in contrast, suddenly looks more appealing. The structure of the European Union limits the power of populism and upholds the rule of law. The EU aims for consensus and coordination.
Whilst this leads to policy that is slow moving, it helps create the stability investors are looking for today. Europe is more predictable and is likely to promote the rules-based order that investors need, in order to make long-term decisions.
Europe’s increasing military investment also helps secure European property rights. A strong European military ought to drive a higher rating for European assets, all else equal, as European assets can be defended and protected.
Europe is well aware that the radical change in US policy provides an opportunity for it. In recent decades the US has been a magnet for both financial and human capital, draining it from the rest of the world. This enormous tumult provides Europe the opportunity to attract these different forms of capital back to the continent and benefit from the innovation and growth that can follow.
Watching Warren Buffett
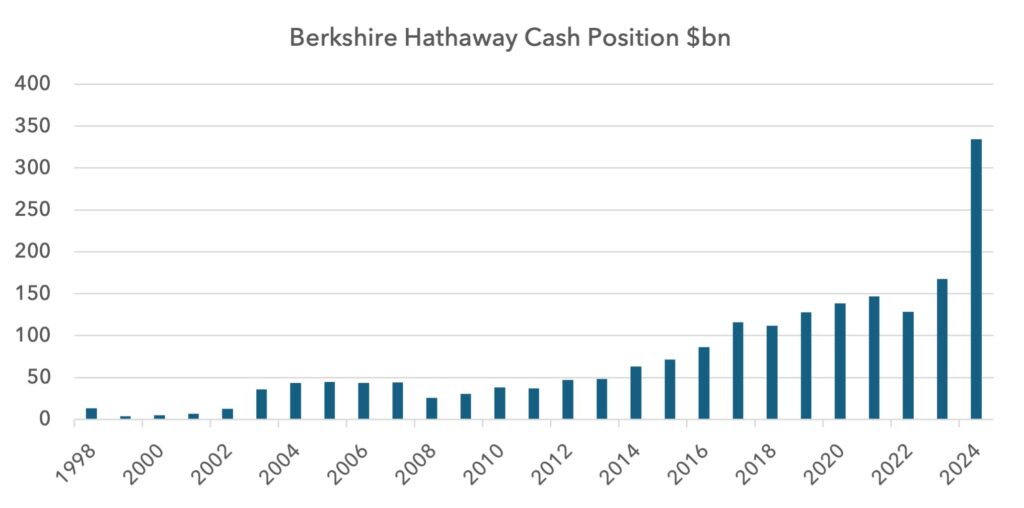
Warren Buffet is more bearish today than at any time in his career. This has not attracted much commentary but is sobering and deserves some attention.
He massively increased his cash position during 2024, which is now nearly $350bn.
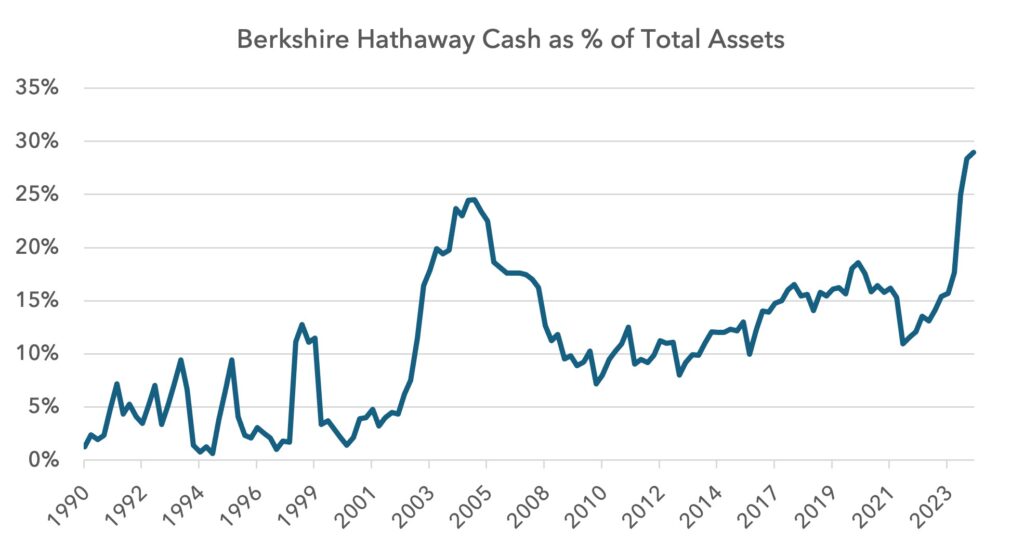
This cash position represents nearly 30% of total assets, a higher ratio than before the financial crisis.
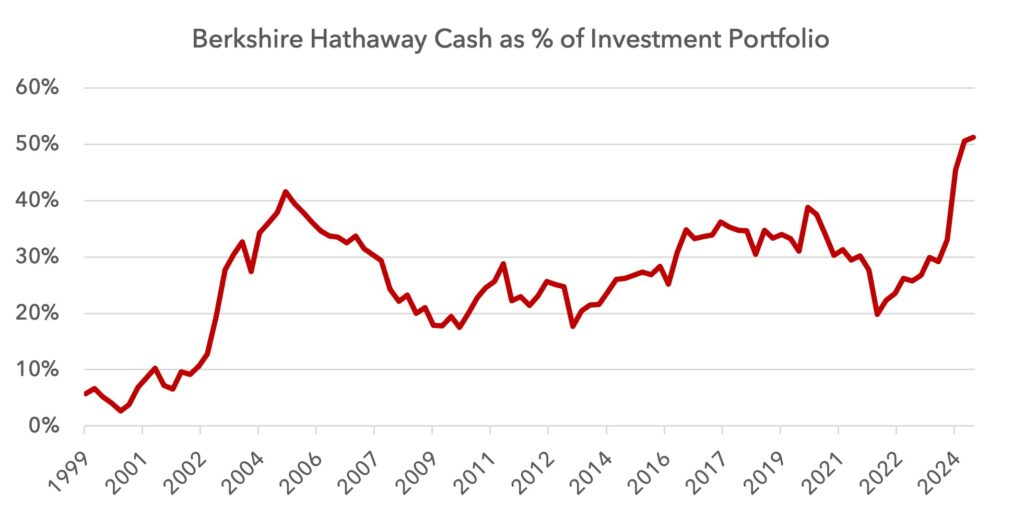
His cash position is now above 50% of his investment portfolio.
Summary
With markets so volatile, short-term predictions are extremely difficult. We could have a legal challenge against the tariffs and many of them could be reversed. Trump could pivot to another strategy. Stimulus measures will likely be announced, but will the bond market tolerate it? All of these decisions could cause wild swings in equities and in bonds.
Leaving these short-term gyrations to one side, there are some longer-term conclusions that we believe can be made:
- It appears that the economic system that we are used to is being unwound.
- The US equity market was a powerful beneficiary of globalisation, both from a profits and an investment flows point of view. This has left US equities crowded and expensive.
- Europe as a surplus region did not receive the same capital inflows. This has left European equities more reasonably priced and less crowded.
- The Trump administration is undermining some of the basic foundations of valuation, challenging norms, property rights and the rule of law.
- The legal structure of Europe, long since held as slow moving and bureaucratic, can be a benefit during this time of immense upheaval, provided the political will to maintain the union holds. Today, that will appears to be strong.
- Europe is more likely to maintain the rules-based order and maintain property rights, which can attract increased investor allocations.
The Lightman investment process focuses on low priced securities with strong balance sheets that are capable of paying dividends and buybacks. We also attempt to avoid owning companies that are crowded with investors who have high expectations. We prefer to invest in companies where expectations are low and can be beaten.
The portfolio currently trades at a PE of 11.6 in 2025 and 10.2 in 2026. The weighted gross dividend yield is estimated to be 5.0% this year and 5.3% next year. Despite all of the tumult, we believe there is the potential for positive absolute and relative returns in 2025.
Sources:
The Federal Reserve, Z1 Flow of Funds, Treasury International Capital System (TIC), Eurostat, ECB, BoE, Office for National Statistics, MSCI, Bloomberg, Lightman Investment Management
Legal
Disclaimer
This communication and its content are owned by Lightman Investment Management Limited (“Lightman”, “we”, “us”). Lightman Investment Management Limited (FRN: 827120) is authorised and regulated by the Financial Conduct Authority (“FCA”) as a UK MiFID portfolio manager eligible to deal with professional clients and eligible counterparties in the UK. Lightman is registered with Companies House in England and Wales under the registration number 11647387, having its registered office at c/o Buzzacott LLP, 130 Wood Street, London, United Kingdom, EC2V 6DL.
Target audience
This communication is intended for ‘Eligible Counterparties’ and ‘Professional’ clients only, as described under the UK Financial Services and Markets Act 2000 (“FSMA”) (and any amendments to it). It is not intended for ‘Retail’ clients and Lightman does not have permission to provide investment services to retail clients. Generally, marketing communications are only intended for ‘Eligible Counterparties’ and ‘Professional’ clients in the UK, unless they are being used for purposes other than marketing, such as regulations and compliance etc. The Firm may produce marketing or communication documents for selected investor types in non UK jurisdictions. Such documents would clearly state the target audience and target jurisdiction.
Collective Investment Scheme(s)
The collective investment scheme(s) – WS Lightman Investment Funds (PRN: 838695) (“UK OEIC”, “UK umbrella”), and WS Lightman European Fund (PRN: 838696) (“UK sub-fund”, “UK product”) are regulated collective scheme(s), authorised and regulated by the FCA. In accordance with Section 238 of FSMA, such schemes can be marketed to the UK general public. Lightman, however, does not intend to receive subscription or redemption orders from retail clients and accordingly such retail clients should either contact their investment adviser or the Management Company Waystone Management (UK) Limited (“Waystone UK”) in relation to any fund documents.
The collective investment scheme(s) - Elevation Fund SICAV (Code: O00012482) (“Luxembourg SICAV”, “Luxembourg umbrella”), and Lightman European Equities Fund (Code: O00012482_00000002) (“Luxembourg sub-fund”, “Lux product”) are regulated undertakings for collective investments in transferrable securities (UCITS), authorised and regulated by the Commission de Surveillance du Secteur Financier (CSSF) in Luxembourg. In accordance with regulatory approvals obtained under the requirements of the Law of 17 December 2010 relating to undertakings for collective investment, the schemes can be marketed to the public in Luxembourg, Norway, Spain, and Republic of Ireland. Lightman, however, does not intend to receive subscription or redemption orders from any client types for the Lux product and accordingly such client should either contact a domestic distributor, domestic investment advisor or the Management Company Link Fund Solutions (Luxembourg) S.A. (“Link Luxembourg”) in relation to any fund documents.
Luxembourg umbrella and Luxembourg sub-fund are also approved for marketing to professional clients and eligible counterparties in the UK under the UK National Private Placement Regime (NPPR). UK registration numbers for the funds are as follows: Elevation Fund SICAV (PRN: 957838) and Lightman European Equities Fund (PRN: 957839). Please write to us at compliance@lightmanfunds.com for proof of UK registration of the funds.
Luxembourg sub-fund is also approved for marketing to qualified investors in Switzerland, within the meaning of Art. 10 para. 3 and 3ter CISA. In Switzerland, the representative is Acolin Fund Services AG, Leutschenbachstrasse 50, 8050 Zurich, Switzerland, whilst the paying agent is NPB Neue Privat Bank AG, Limmatquai 1 / am Bellevue, 8024 Zurich, Switzerland.
Accuracy and correctness of information
Lightman takes all reasonable steps to ensure the accuracy and completeness of its communications; we however request all recipients to contact us directly for the latest information and documents as issued documents may not be fully updated. We cannot accept any liability arising from loss or damage from the use of this communication.
Wherever our communications refer to a third party such as Waystone, Link, Northern Trust etc., we cannot accept any responsibility for the availability of their services or the accuracy and correctness of their content. We urge users to contact the third party for any query related to their services.
Important information for non-UK persons (Including US persons)
This communication is not intended for any person outside of the UK, Switzerland, or the European Economic Area (EEA). Lightman or any of the funds referenced in this communication are not approved for marketing outside of the UK, Switzerland, or the EEA. All such persons must consult their domestic lawyers in relation to services or products offered by Lightman.
Risk warning to all investors
The value of investments in any financial assets may fall as well as rise. Investors may not get back the amount they originally invested. Past performance is not an indicator of future performance. Potential investors should not use this communication as the basis of an investment decision. Decisions to invest in any fund should be taken only on the basis of information available in the latest fund documents. Potential investors should carefully consider the risks described in those documents and, if required, consult a financial adviser before deciding to invest.
Offer, advice, or recommendation
No information in this communication is intended to act as an offer, investment advice or recommendation to buy or sell a product or to engage in investment services or activities. You must consult your investment adviser or a lawyer before engaging in any investment service or product.
GDPR
Lightman may process personal information of persons using this communication. Please read our privacy policy.
Copyright
This communication cannot be distributed or reproduced without our consent.