
In this note we assess various structural arguments to support the case for a multi-year period of European equity outperformance. These include valuations, allocations, capital flows, treasury and central bank policy, AI, private equity and the Russo-Ukrainian war.
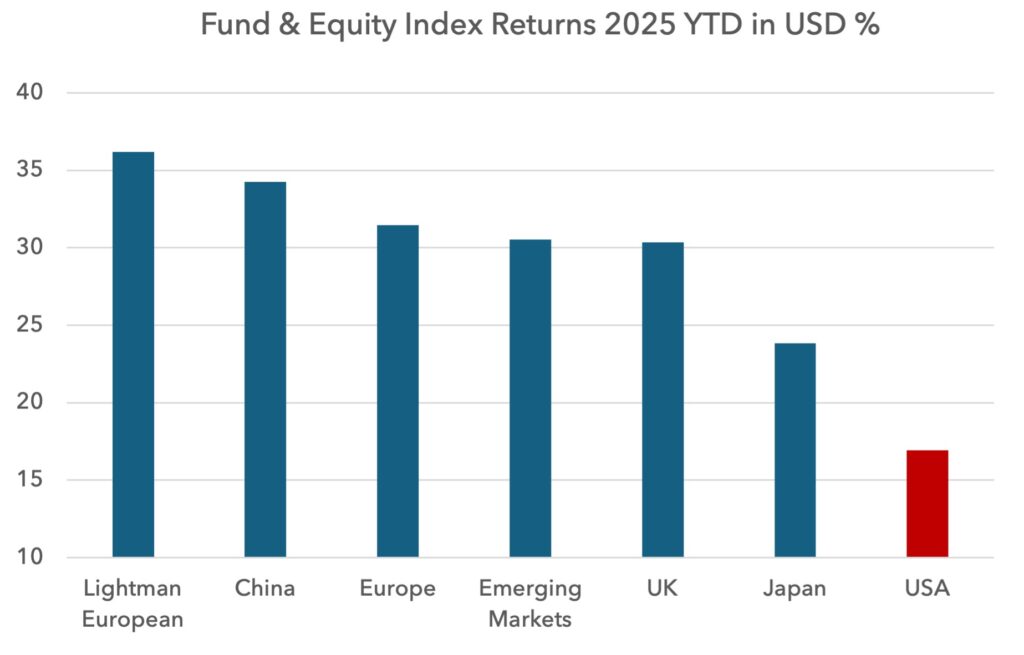
European equities are experiencing their seventh best year versus US equities since 1969. Despite the AI euphoria, US underperformance has been significant in 2025.
 We expect this divergence to continue for the following reasons:
1) Valuations
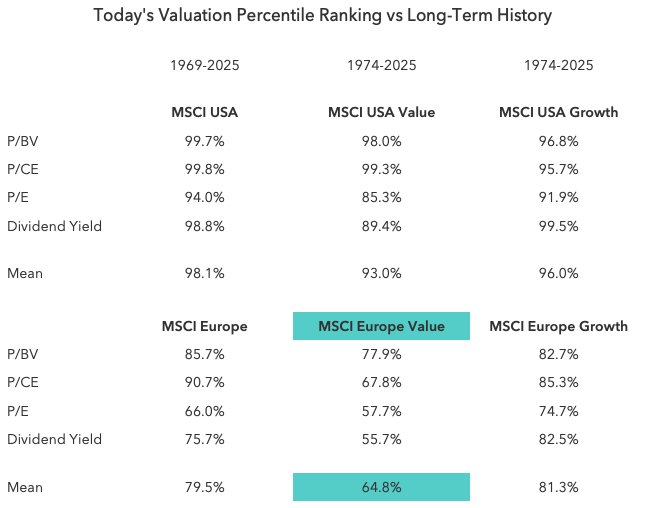
The US remains expensive relative to its own long-term history whilst Europe is less so. European value in particular stands out as being only modestly expensive relative to its own history.
2) The bubble discussion
The US technology sector is now at valuations that far surpass the peak of the dotcom bubble on many metrics. In price to sales terms, the recent highs in valuation were 50% above the 2000 peak, at greater than 10x sales.
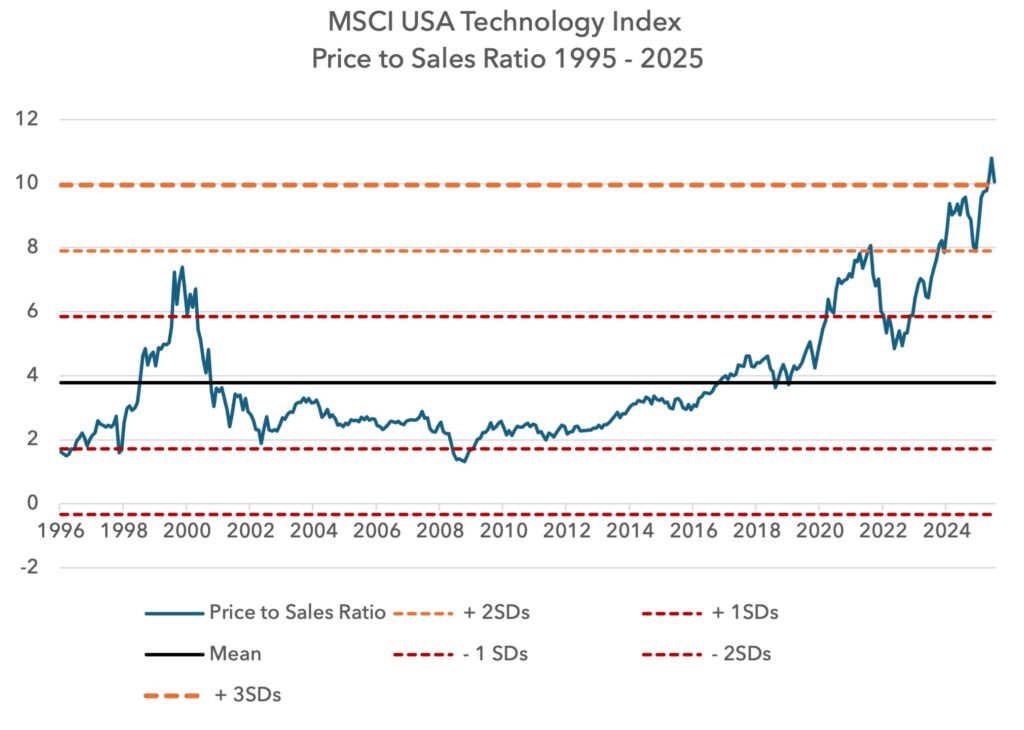
If you believe the dotcom period was a bubble, it is difficult to suggest that today is not. Yes, profitability is higher today and PE ratios within technology are not what they were in 2000. But on most other metrics, valuations are equivalent or higher.
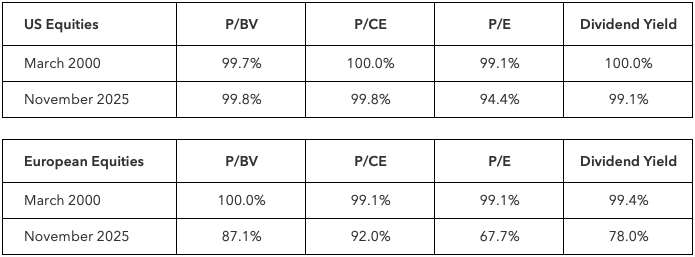
When we look at the US index as a whole, and compare it to the live percentile reading that was in place at the market peak in March 2000, it is very similar to that moment.
Europe in aggregate, as we know, is not particularly cheap today, but is not at the levels of March 2000.
It could be argued that a bubble is not simply a function of valuation, it might also include leverage and other mechanisms of speculation and risk taking. Those other elements are harder to measure, but from a valuation point of view, we would say the bubble case for the US and especially US technology is strong.
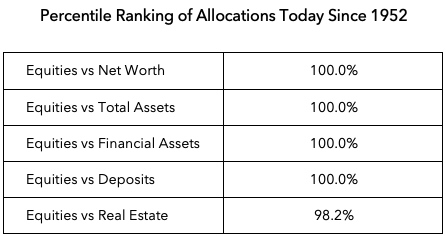
3) Allocations
We have referenced US household equity allocations in prior notes. The logic here is that the market has been dominated by flows, and so the path of future flows will be an important determinant for future returns. The higher the reading for equity allocations, the shorter the runway for future flows and vice versa.
Below we show the latest Z1 Flow of Funds release which dates to Q2 2025. This shows the current reading ranked in percentiles since 1952. A reading of 100% means this is the highest reading since 1952.
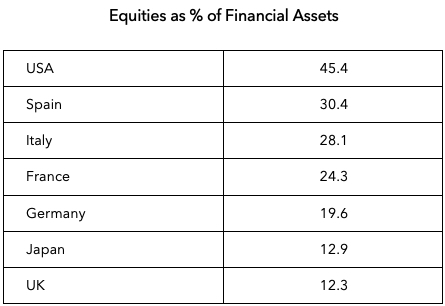
In Europe the OECD compiles similar data to the Fed, with a lag. There may be some small definitional differences with the Fed but they are very similar. Here we do not show the data ranked in percentile terms, but instead the absolute percentage allocations to equities as a proportion of financial assets. This allows us to compare countries to each other.
US households have huge allocations to equities compared to most other countries. This suggests limited room to increase flows into equities going forward. Low numbers ought to be constructive for forward returns. The lower the number, the longer the runway for flows to increase into equities.
 4) Capital flows
Some structural changes are pending in current account and capital account flows that have the potential to be bullish for equities in Europe (and China) and bearish in the US over a multi-year period.
When a country runs a large current account deficit, it is financed by capital account inflows. These flows tend to go into financial assets of the deficit country, so widening current account deficits can often be bullish for the equity markets of those deficit countries.
In recent years the two economies with the largest surpluses, Europe and China, have largely recycled them into US assets, assisting US equity outperformance.
The problem for the US is that both Europe and China are taking policy decisions to shrink their surpluses. In China it is explicit. The Chinese have made public that their perception of an equilibrium surplus is 2% of GDP – not today’s 6%. It is likely that they will strengthen the yuan to achieve this. As the Chinese current account surplus falls, capital account outflows (going to the US) will also fall.
In Europe the change is more implicit. German fiscal expansion is significant as we show in the chart below.
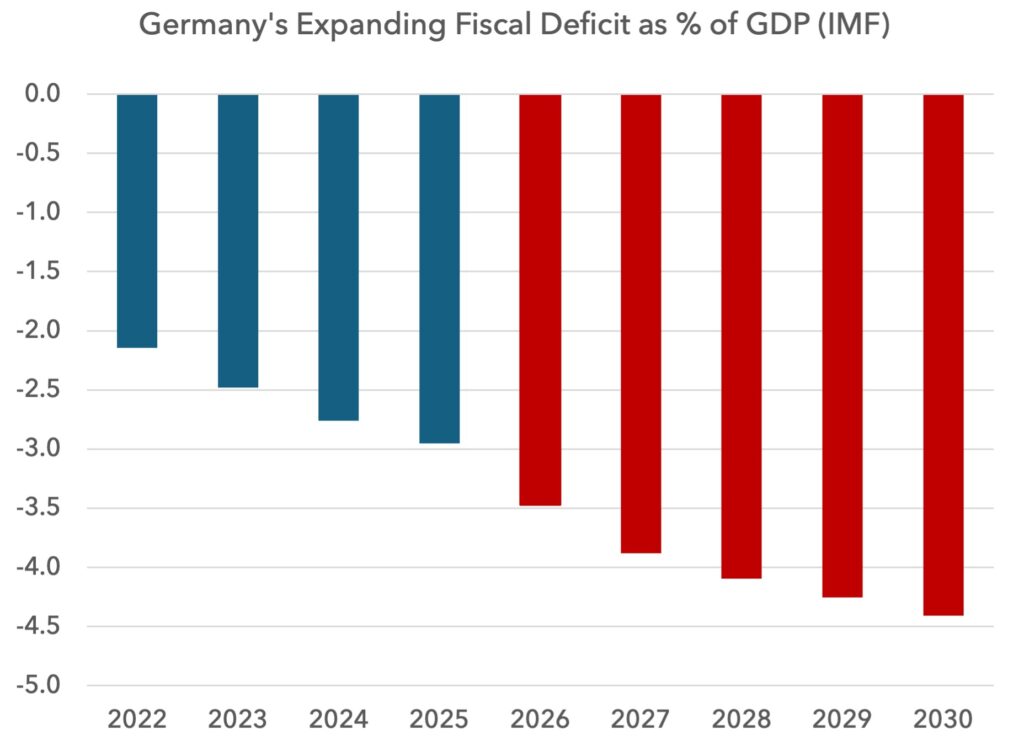 As this fiscal deficit expands, German consumption will be higher, and more domestic savings will need to be retained at home. All else being equal, this ought to bring down Europe’s current account surplus. As in China, this ought to bring down capital account flows leaving Europe and heading to the US.
Trumps’s tariff announcement, the reshoring plans and weak dollar policy are all also designed to shrink the US current account deficit. So we have all three major economic blocks seemingly moving in the direction of smaller deficits and smaller surpluses, weakening the tailwind for US financial assets.
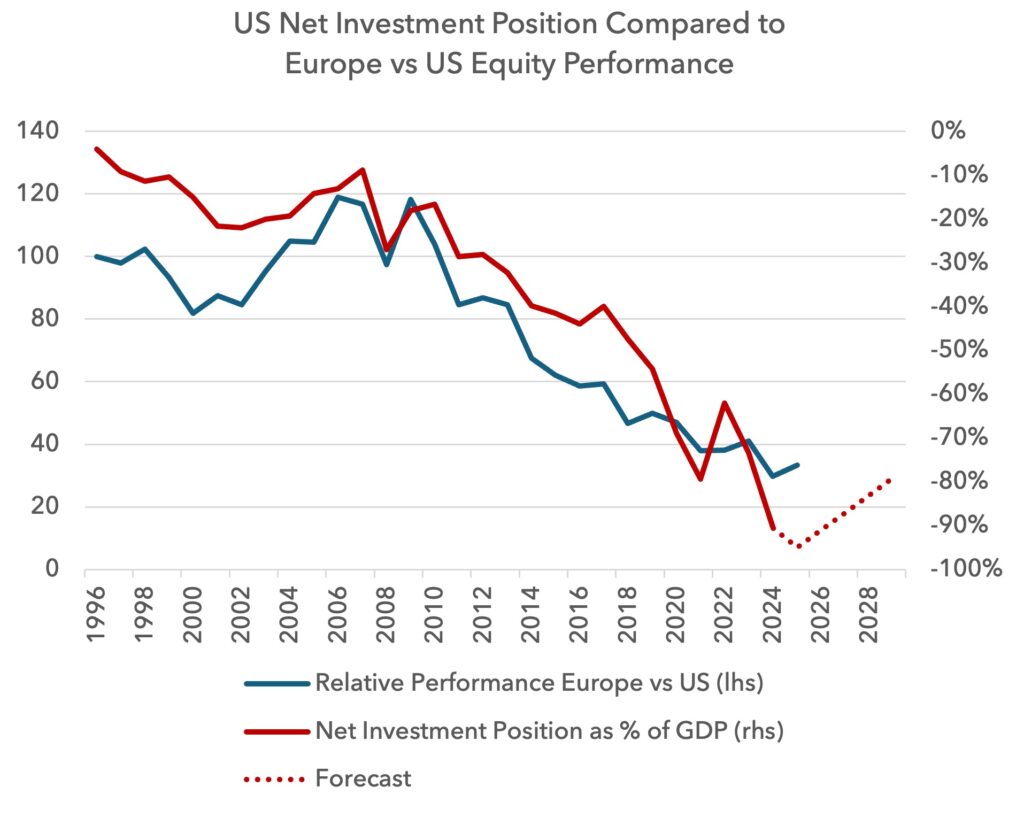
Changes in the net investment position
The net effect of a persistent current account deficit is a deteriorating net investment position. Today the US has a net investment position of -100% of GDP. In plain English this means foreigners own 100% of GDP, i.e. $30tn more of US assets than the US owns of foreign assets.
As we show in the next chart, as the net investment position deteriorates, it tends to support US equities and makes it more likely Europe (or the rest of the world) underperforms. A declining net investment position tends to coincide with US equity outperformance because it is a sign of capital account inflows. But going forward this net investment position looks more likely to narrow, as it did from 2000-2007. This coincided with strong European outperformance of the US.
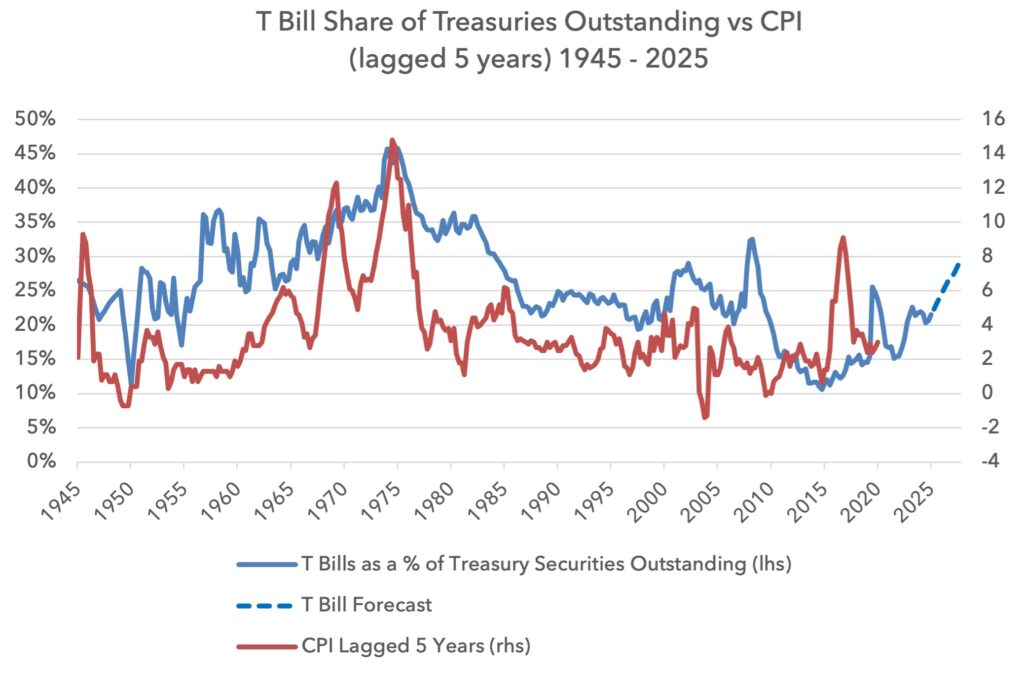
 5) Changing Treasury issuance
In November, the US Treasury confirmed that it plans to increase T-Bill issuance and reduce the volume of longer dated debt issuance. This is a continuation of Janet Yellen’s actions under the Biden administration.
Today T-Bills make up 21.5% of Treasuries outstanding and there is speculation that this could rise toward 27-30% in the coming years.
This increase in T-Bill issuance is seen by many investors as bullish for risk assets, because the absence of longer-dated issuance should keep longer-dated interest rates down. This may be correct in isolation, but the problem is that rising T-Bill issuance as a percentage of debt tends to be inflationary.
Below we show the T-Bill share of Treasury debt with inflation lagged by five years, during the postwar period. The chart is streaky but you can see the relationship between the two. We add a forecast in the coming years. All things being equal, this T-Bill strategy ought to lift inflation over time. It may also help to weaken the dollar, which often supports equity outperformance by the rest of the world over the US.
The five-year lag in the chart matches the inflation experience of the 1960’s and 1970’s, but it is noticeable that in recent years the lag appears much shorter. The inflation spike of the post-pandemic period occurred 18 months after rising T-Bill issuance.
6) Changing Fed balance sheet policy
The Fed has recently announced that it intends to move the composition of its Treasury holdings in its System Open Market Account (SOMA) portfolio closer towards the maturity split of outstanding government debt.
Today the Fed owns a high proportion of notes and bonds and very little T-Bills, as we show below. The Fed’s split of Treasuries is 18% overweight Treasury bonds and 17% underweight T-Bills.
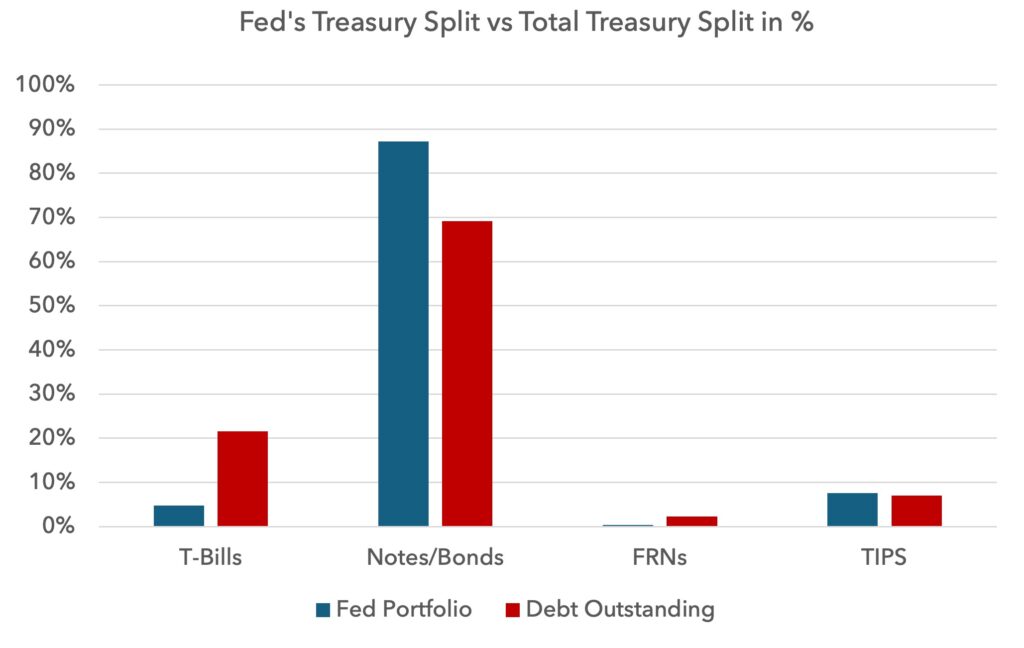
This suggests the Fed is going to let its longer-duration bonds mature and reinvest in T-Bills. This will help the Treasury in its increase of T-Bill supply, but it adds duration back to the market, and all things being equal should lead to higher longer-term interest rates. Despite QT ending in December, this amounts to a tightening of financial conditions via the Fed balance sheet over time.
The speech confirming this balance sheet path was made on 12 November and coincided with some US equity market weakness. Many investors are positioned for a more generous liquidity environment, but this Fed balance sheet policy path suggests we may see the opposite.
7) AI capex runway shortening
The AI revolution can be real, but that does not mean it is necessarily bullish for the US equity market in the short to medium term, given the current index composition. We do not intend to discuss the technology here, just where the risks to market expectations might lie.
As powerful as large language models (LLMs) are, the product is commoditised as of now and has limited pricing power. In telecoms, it took just four players in a given market to provide sufficient competition to damage returns. There are 21 significant LLM developers in the world, all seeking to maximise user engagement. If OpenAI starts charging for its services, customers will likely move to another provider.
Investors are beginning to scrutinise the AI capex story for the first time this cycle. Meta’s earnings in late October was a watershed moment because it was the first time a company was punished for excessive AI spending.
As we all know, the collective US capex plans are enormous, with $500bn scheduled to be spent next year, moving towards $600bn in 2028.
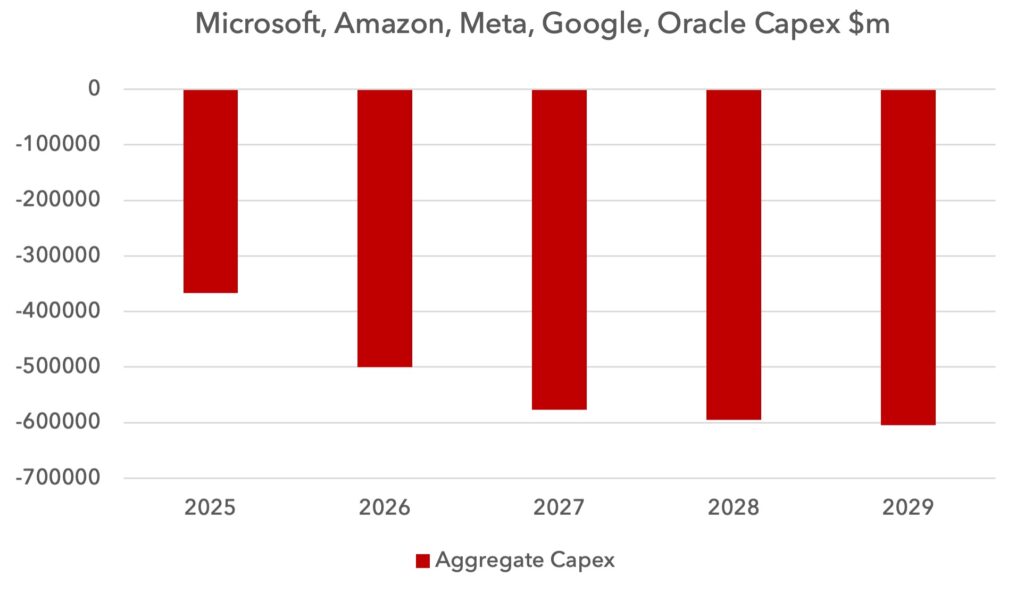
The question is: how long can these companies afford this spending? Below we show the aggregate free cash flow for the same companies in the chart above, with different free cash flow growth scenarios. We take a fixed estimate for 2025 free cash flow, then assume it grows at either 10%, 5% or 0% and then adjust for the changes in capex that is planned.
In almost all scenarios, free cash flow goes negative in 2027. This might explain the flood of debt issuance by the AI spenders recently.
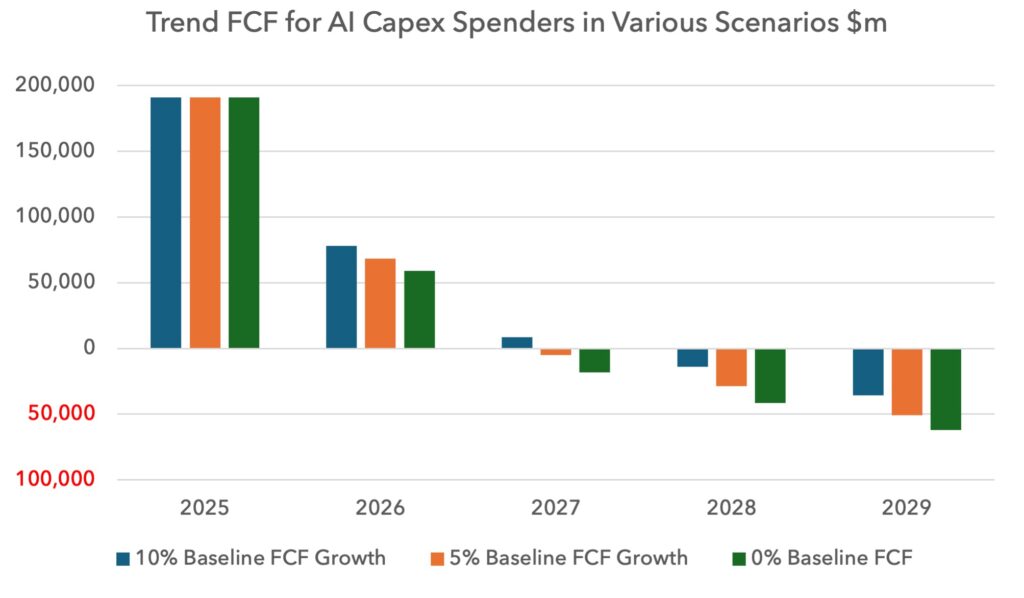
Investors believe that huge revenues will materialise soon from AI and so free cash flow will surge and easily fund this spending. But the recent debt issuance suggests the companies themselves may not share this confidence. Supercharged free cash flow growth may happen, but it is worth knowing the implications if it does not.
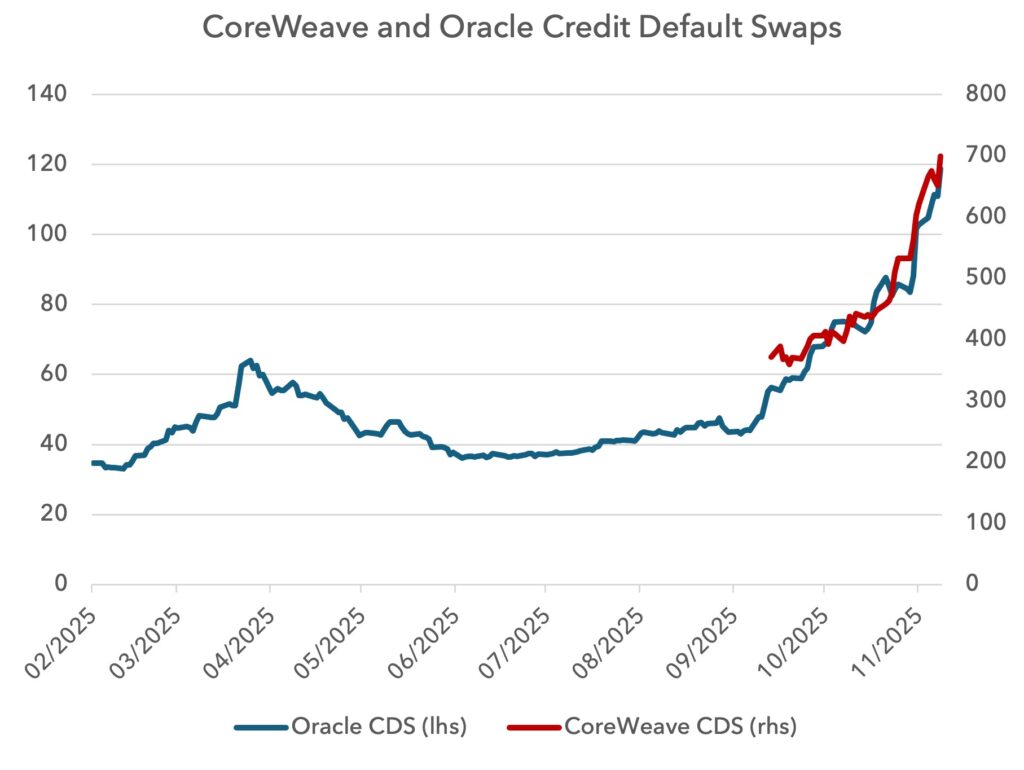
Certain companies are already showing signs of strain. CoreWeave’s credit default swap is now at 705 basis points and Oracle’s is at 120, with both having surged in recent weeks. At 705 basis points, the implied probability of a CoreWeave default over five years is 46%.
 8) Technological disruption and threats to Nvidia’s market capitalisation and OpenAI
Google’s recently released Gemini 3 has wowed many AI specialists. But strikingly, it was not trained on any Nvidia chips. Gemini 3 uses Google’s own Tensor Processing Unit chips (TPUs). Google can use its TPUs for most of its core activities, be it Search, Gemini, Maps or YouTube. Meta was so impressed with Google’s TPU performance that it has already announced plans to buy them. This means Google is now a de facto competitor to Nvidia.
Google and all other cloud providers still need Nvidia GPUs for their cloud services. Nvidia’s Cuda platform is the basis for most of the AI ecosystem that is built in the cloud and so its monopoly position here remains secure.
But Google is showing other hyperscalers that there is an alternative to Nvidia and a credible path for them to build their own chips, particularly in the highest margin AI training category.
For markets, given Nvidia’s $5tn valuation, there is limited room for error. $5tn is 17% of US GDP.
The financial incentive to wean companies or countries off Nvidia is huge. There is also a geopolitical imperative. China is hell-bent on developing its own technology outside the US eco-system. Given this, investors should at least be prepared for a “DeepSeek 2” moment, where China announces further technological breakthroughs that may further weaken Nvidia and the West’s technological moat.
OpenAI failure
Investors should also be prepared for the possibility that OpenAI fails. Microsoft recently reported that from July-September this year OpenAI generated losses of $12bn. The company is not just generating losses but also burning cash at a frightening rate. Part of the problem is that AI costs scale with use. This is not like software, where you can scale revenue with very limited increases in costs. The more they launch new data-intensive products, like Sora 2, the more their costs escalate.
Investors often cite Amazon in its early years and compare it to OpenAI. But whilst Amazon generated accounting losses, its operating cashflow was positive from 1998. By 2002 it was generating free cash flow. OpenAI is very different. It has announced it expects to burn $115bn of cash between now and 2029. Its cash needs mean it will need to IPO soon. But an IPO may be a double-edged sword. It could raise cash but it will open the company to the kind of scrutiny that may not support its expected valuation.
Google is a formidable competitor to OpenAI. It generates free cash flow and appears to have a better product as of November 2025. European equities would be significantly more cushioned from any disruption to Nvidia, OpenAI or the AI value chain, compared to US equities.
9) Private Equity and Private Credit
Private equity (PE) firms are facing growing investor redemption requests but appear to be struggling to find enough buyers for their investments. The industry is using ever more imaginative ways to fund payouts to themselves and their investors without selling assets.
 At some point the industry may become a forced seller, perhaps via IPOs, but we are not there yet. If and when that moment comes, it could be significant for public markets, as the flood of supply may be hard to absorb.
What is worrying is that this failure to exit investments has occurred with equities at all-time highs and credit spreads at all-time lows. If conditions become more hostile, exits will be even harder. We believe investors should at least be prepared for a crisis that engulfs the private asset industry. Potential stress points are complex and multi-faceted, hence the section below is long.
Whilst a private asset crisis would be a global phenomenon, it is most acutely a headwind for US-owned businesses, given this is where the concentration of ownership is highest. We therefore view a private asset crisis as most damaging for US public equities, versus European equities or emerging markets.
Over-allocations leading to structural redemptions
The US PE industry is approximately $3.5tn. This compares to the S&P 500 market capitalisation of c.$60tn and Russell 2000 of $3.3tn. Using the classic 60:40 split of equities and bonds, based on market valuations a neutral allocation to private equity would be 5% of the equity portion, or 3-3.5% of the total.
But according to the American Investment Council, the average allocation by US public pension funds to private equity is 14%. For endowments the number is even higher. The National Association of College and University Business Officers has the average allocation at 17%. For large endowments, the number is higher still – the True North Institute assesses large endowment allocations to be 37%.
Large institutional players appear hugely over-allocated. This might explain the funding problems the industry is experiencing as their main client base seeks to reduce exposure.
The industry has lobbied the Trump administration to loosen the rules allowing allocations to private equity in 401k retirement plans. Trump signed an executive order in August to facilitate this, but it is unlikely that these plans will help the industry much. 401k plans are supposed to offer daily liquidity with low and transparent fees. Employers who operate these schemes face significant litigation risk if they fail to follow these guidelines and so we would not expect this avenue to provide meaningful flows to the industry.
How do PE firms mitigate redemption requests?
One approach PE is using to keep the carousel moving is to shift assets out of older vehicles into Continuation Vehicles (CVs). Here the asset is not sold but simply passed to another fund managed by the same firm, often with minority co-investors. This classifies as an “exit” for the legacy fund, even though the new fund is majority managed by the same firm. Continuation vehicles have made up a fifth of industry “exits” this year according to Jefferies. Some firms are now creating CVs of CVs – or “CV squareds” – as they continue to struggle to sell the assets to genuine new buyers.
It is pretty obvious that CVs are not genuine exits and amount to the industry attempting to buy time. A recent total loss for Platinum Equity, Fortress, Ares and Blackstone on a continuation investment highlights the risk with these vehicles. Incredibly this continuation fund had bought a portaloo company from another fund for $4bn(!) in 2021. This has now been written down to zero.
Debt
The main mechanism to keep the PE machine from stalling is via increasing debt issuance. The extent and complexity of PE’s debt financing is extraordinary, which we attempt to outline below.
Leveraged Loans and CLOs
PE dominates the leveraged loan market, sponsoring about 80% of all issuance. Leveraged loans are higher risk loans, typically below investment grade with net debt to ebitda of 4-6x or higher. The great majority of these leveraged loans are packaged into collateralised loan obligations (CLOs). The latest estimate for the US CLO market size is c.$1.2tn. The European CLO market is far smaller at c.$290bn. Outside of Europe and the US, the CLO market is negligible.
About 25-35% of all CLOs are sold to insurance companies, 15-20% to banks and the remainder spread out amongst mutual funds, hedge funds, pension funds and the like.
Like mortgage-backed securities (MBS) during the financial crisis, these securities are tranched with different credit ratings. Insurers tend to buy the higher quality tiers whilst the originator of the debt tends to need to keep the riskiest equity tranche.
Private credit, BDCs and PCCLOs
Private credit is another important avenue for debt issuance. Unlike leveraged loans that tend to be syndicated and somewhat liquid, private credit is privately originated, opaque and illiquid. This can make it difficult to monitor changes in credit quality, unless outright defaults occur.
Business Development Companies (BDCs) are the public face of private credit. They are listed vehicles whose primary business is direct lending. Ares, TPG and Blue Owl run BDCs to raise capital from investors to fund their private credit lending. Many of these companies have seen sharp share price declines in recent months.
Typical private credit lending is to “middle market” firms with ebitda of $50-$100m. Net debt to ebitda tends to be 5-7x, far higher than in public markets.
US private credit is estimated at c.$1.2tn with c.70% or c.$800bn linked to private equity, according to BNY. The European private credit market is estimated at c.$500bn, but with a smaller ratio connected to private equity at c.$200bn.
Private credit has innovated further by creating Private Credit CLOs or PCCLOs, where instead of taking leveraged loans as the underlying assets, they take private credit-backed loans. Some estimates put PCCLOs at up to 20% of the total CLO market. If CLOs are like MBS during the financial crisis, then PCCLOs are like CDOs, given their opacity and lack of transparency.
PIK loans and “Bad Pik”
The industry has various other debt-raising mechanisms. Recently there has been a sharp increase in “bad payment-in-kind” (“bad PIK”) debt. Bad PIK loans allow borrowers to add additional debt to the original loan, with those new proceeds used to pay interest on the existing loan. This only happens when the company has inadequate cashflow to service the existing debt. Most would view this as a hidden form of default.
We can view the bad PIK debt as similar to the “ninja” (no income no job) loans of 2007-2008.
A recent JP Morgan analysis of 29 BDCs showed PIK loans increased to $43.5bn in the second quarter, or 15% of total debt portfolios.
It is worth noting that public equities could never get away with this kind of borrowing. Public market investors would demand equity issuance well before this level of distress is reached.
Rating agency proliferation and divergent credit ratings and valuations for the same securities
The expansion of private credit has seen a proliferation of new ratings agencies for these securities. In another echo of the subprime crisis, the Bank of International Settlements (BIS) has warned of “inflated assessments of creditworthiness” by some agencies.
Bloomberg recently ran a report on the widely varied pricing of a private credit loan to Medallia, a Thoma Bravo-backed software company. We show how the pricing of this security varies by investor over time below:
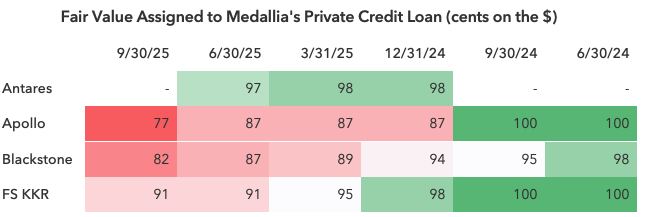
The sheer breadth of valuations for this single security underlines the subjectivity and opacity of private credit in general. These divergencies tend to spell trouble and were widely seen in credit markets in 2007 and 2008.
Dividend Recaps
2025 is also a record year for dividend recaps. This is where debt is not used for investment but instead is used exclusively to fund payouts. Dividend recaps in 2025 have already matched the record of $28.8bn in 2021. It is seen by many investors as an aggressive and in some cases desperate tactic.
Co-opted insurance and NAV loans
The insurance industry is now a major player in this story, not only as a large buyer of CLOs, but also as a co-opted source of capital. PE firms have bought insurers outright, to force them to invest their capital into their owners’ investments.
Apollo led this strategy, establishing Athene in 2009. Most large PE firms including Blackstone, KKR and Ares own insurers. $700bn of insurance assets are now controlled by PE according to Bloomberg.
PE-backed insurance companies like Athene are helping to fund the debts of their parents’ PE investments in many different ways. One more aggressive approach is via NAV loans, where PE firms post their investments – or net asset value – as collateral. These loans can be used to refinance debt, make follow-on investments and to pay money out to investors, in a similar way to dividend recaps.
Athene has invested $18bn for this kind of funding in 2025. The industry is estimated to have $225bn outstanding in NAV loans.
Radical changes in life insurance’s underlying investments
Traditional life insurers invest in liquid and easy-to-monitor investments, namely corporate bonds, treasuries and large-cap equities. Moving these life savings into private credit and private equity is dubious. It is fair to expect more regulatory oversight of the connection between insurers and private equity. If this occurs, this could create funding problems for the industry as a whole.
AI backed and AI disrupted exposure
Blue Owl, a private credit firm, has faced scrutiny because of its aggressive lending for data centers. Blue Owl lends against GPU chips as collateral, particularly for companies like CoreWeave. The problem is that GPUs become obsolete quickly. Nvidia releases new chips every 1-2 years. Old chips can drastically fall in value. Chips also have a high failure rate. In high utilisation environments annualised failure rates are estimated at 9-10%, so after three years 30% of chips may need replacing. Blue Owl’s share price may provide an insight into the risks in private credit. It has fallen 34% this year.
Perhaps a bigger risk for PE is the disruptive effect of AI on legacy PE investments. Equity investors are worried about the impact of AI on software valuations. Salesforce, ServiceNow, Synopsis and Adobe’s share prices have all lost 15%-30% this year. These are significant declines, given the broader market strength.
AI agents may reduce the need for the number of software licenses a company buys. LLMs can also quickly write software that would have taken years in the past. This means competing products to legacy software providers are arriving quickly at low cost.
Many of the world’s largest PE firms have huge exposure to software. Thoma Bravo and Vista Equity partners both run over $100bn and are exclusively invested in software and technology companies. Hg, Accel-KKR, TA Associates, EQT and Permira are also heavily exposed, as are KKR and Blackstone. It seems sensible to assume many software business exits could become more challenging in the months ahead.
A rolling private asset crisis
The extraordinary list of financing mechanisms discussed above underscores the same story: PE cannot sell enough of their investments at the prices they need. The industry has kept the wheels turning via continuation funds and layering more and more debt on existing structures, but this tactic faces limits. Eventually the underlying equity collapses under the weight of debt.
In terms of credit quality, public equities are in a different league compared to private equity owned assets. Private equity needs both lower interest rates and a stronger economy. It is hard to see both of these materialising at the same time in the short term.
The life insurance industry has been essential in keeping fresh funding flowing and averting a more overt crisis. But there are genuine fiduciary concerns about diverting these supposedly low risk life savings out of liquid, transparent assets and into illiquid, opaque assets. Any kind of regulatory intervention to limit insurers’ holdings in PE could cause significant industry stress.
The multi-faceted, complex and hidden nature of private equity and private credit funding makes it hard to grasp. This may be leading to a generalised complacency around the risks for public markets emanating from the industry. At some point these assets will need to be sold. The prices may not meet expectations. This could cause tumult across public markets, with the US most exposed.
10) The end of the Russo-Ukrainian war
Leaving aside the Trump administration’s latest push for peace, there is some logic that the war could end in the coming year.
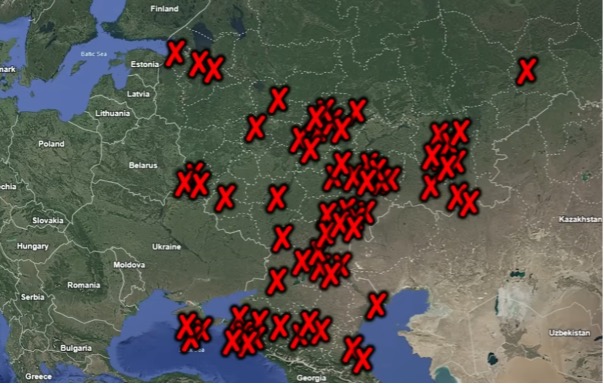
Ukraine is now applying pressure inside Russia. In recent months Ukrainian drone strikes have taken 21 of Russia’s 38 oil refineries offline, amounting to 40% of capacity. Ukraine has also started attacking the Russian energy grid. Russian refined product exports declined sharply in September and queues at filling stations are being reported.
Recent drone strikes on Russian oil and gas infrastructure (source: William Spaniel)
This is relevant because Putin’s bargain with the Russian people has always been that foreign policy excursions are tolerated as long as they do not impact life at home. This is no longer the case.
These attacks therefore weaken Russia’s bargaining position in negotiations and may shorten the window to maintain offensive operations.
A lasting peace between Russia and Ukraine is bullish for European equities. There are high precautionary savings in neighbouring countries, in particular in Germany and Poland. These savings ought to decline if the war ends. A Ukrainian reconstruction would also be highly resource intensive and lift growth in surrounding countries.
European equities may also have an element of a war risk premium embedded in valuations, and so peace could drive not only a re-rating but also an increase in global investor flows. Increased investor flows and a higher growth impulse may drive up the euro.
Summary
It is tempting to make directional bets on markets given how extended valuations are today. But we believe it is easier to steer portfolios in relative terms. Europe has had a strong year compared to the US and we expect more of the same in 2026. Many of the arguments above are structural and could take time to play out, supporting the case for a multi-year period of European outperformance.
In order to see significant equity market weakness in absolute terms, a possible trigger would be the intersection of an AI problem feeding into a bigger private asset crisis. This is something we will be watching out for in 2026.
The Lightman European portfolio has a 2026 PE ratio of 13.3x, a price to sales ratio of 1.7 and a dividend yield of 4.0%. Despite high index valuations we still see the possibility for modest positive absolute and relative returns in 2026.
Sources:
MSCI, Z1 Flow of Funds, The Federal Reserve, US Treasury, OECD, ECB, IMF, Roberto Perli at the New York Fed, Paul Kedrosky, Tom Schoenberg, Alexandre Rajbhandari, Weihua Li at Bloomberg, William Spaniel, Ropes & Gray, Prequin Performance Pulse, Dealogic, Lightman Investment Management.
Legal
Disclaimer
This communication and its content are owned by Lightman Investment Management Limited (“Lightman”, “we”, “us”). Lightman Investment Management Limited (FRN: 827120) is authorised and regulated by the Financial Conduct Authority (“FCA”) as a UK MiFID portfolio manager eligible to deal with professional clients and eligible counterparties in the UK. Lightman is registered with Companies House in England and Wales under the registration number 11647387, having its registered office at c/o Buzzacott LLP, 130 Wood Street, London, United Kingdom, EC2V 6DL.
Target audience
This communication is intended for ‘Eligible Counterparties’ and ‘Professional’ clients only, as described under the UK Financial Services and Markets Act 2000 (“FSMA”) (and any amendments to it). It is not intended for ‘Retail’ clients and Lightman does not have permission to provide investment services to retail clients. Generally, marketing communications are only intended for ‘Eligible Counterparties’ and ‘Professional’ clients in the UK, unless they are being used for purposes other than marketing, such as regulations and compliance etc. The Firm may produce marketing or communication documents for selected investor types in non UK jurisdictions. Such documents would clearly state the target audience and target jurisdiction.
Collective Investment Scheme(s)
The collective investment scheme(s) – WS Lightman Investment Funds (PRN: 838695) (“UK OEIC”, “UK umbrella”), and WS Lightman European Fund (PRN: 838696) (“UK sub-fund”, “UK product”) are regulated collective scheme(s), authorised and regulated by the FCA. In accordance with Section 238 of FSMA, such schemes can be marketed to the UK general public. Lightman, however, does not intend to receive subscription or redemption orders from retail clients and accordingly such retail clients should either contact their investment adviser or the Management Company Waystone Management (UK) Limited (“Waystone UK”) in relation to any fund documents.
The collective investment scheme(s) - Elevation Fund SICAV (Code: O00012482) (“Luxembourg SICAV”, “Luxembourg umbrella”), and Lightman European Equities Fund (Code: O00012482_00000002) (“Luxembourg sub-fund”, “Lux product”) are regulated undertakings for collective investments in transferrable securities (UCITS), authorised and regulated by the Commission de Surveillance du Secteur Financier (CSSF) in Luxembourg. In accordance with regulatory approvals obtained under the requirements of the Law of 17 December 2010 relating to undertakings for collective investment, the schemes can be marketed to the public in Luxembourg, Norway, Spain, and Republic of Ireland. Lightman, however, does not intend to receive subscription or redemption orders from any client types for the Lux product and accordingly such client should either contact a domestic distributor, domestic investment advisor or the Management Company Link Fund Solutions (Luxembourg) S.A. (“Link Luxembourg”) in relation to any fund documents.
Luxembourg umbrella and Luxembourg sub-fund are also approved for marketing to professional clients and eligible counterparties in the UK under the UK National Private Placement Regime (NPPR). UK registration numbers for the funds are as follows: Elevation Fund SICAV (PRN: 957838) and Lightman European Equities Fund (PRN: 957839). Please write to us at compliance@lightmanfunds.com for proof of UK registration of the funds.
Luxembourg sub-fund is also approved for marketing to qualified investors in Switzerland, within the meaning of Art. 10 para. 3 and 3ter CISA. In Switzerland, the representative is Acolin Fund Services AG, Leutschenbachstrasse 50, 8050 Zurich, Switzerland, whilst the paying agent is NPB Neue Privat Bank AG, Limmatquai 1 / am Bellevue, 8024 Zurich, Switzerland.
Accuracy and correctness of information
Lightman takes all reasonable steps to ensure the accuracy and completeness of its communications; we however request all recipients to contact us directly for the latest information and documents as issued documents may not be fully updated. We cannot accept any liability arising from loss or damage from the use of this communication.
Wherever our communications refer to a third party such as Waystone, Link, Northern Trust etc., we cannot accept any responsibility for the availability of their services or the accuracy and correctness of their content. We urge users to contact the third party for any query related to their services.
Important information for non-UK persons (Including US persons)
This communication is not intended for any person outside of the UK, Switzerland, or the European Economic Area (EEA). Lightman or any of the funds referenced in this communication are not approved for marketing outside of the UK, Switzerland, or the EEA. All such persons must consult their domestic lawyers in relation to services or products offered by Lightman.
Risk warning to all investors
The value of investments in any financial assets may fall as well as rise. Investors may not get back the amount they originally invested. Past performance is not an indicator of future performance. Potential investors should not use this communication as the basis of an investment decision. Decisions to invest in any fund should be taken only on the basis of information available in the latest fund documents. Potential investors should carefully consider the risks described in those documents and, if required, consult a financial adviser before deciding to invest.
Offer, advice, or recommendation
No information in this communication is intended to act as an offer, investment advice or recommendation to buy or sell a product or to engage in investment services or activities. You must consult your investment adviser or a lawyer before engaging in any investment service or product.
GDPR
Lightman may process personal information of persons using this communication. Please read our privacy policy.
Copyright
This communication cannot be distributed or reproduced without our consent.