
- Interest rates and multiple compression remain the biggest threats to asset prices. This could be a multi-year process
- But Europe has some defensive characteristics: low valuation, record negative sentiment and investors are deeply underweight
- Investors should be prepared for some better news: Europe’s energy crisis may not be as bad as expected this winter; Russia’s military position in Ukraine is weak and Putin’s position is fragile; Italy’s new government is unlikely to weaken its fiscal position; and the dollar may weaken
Markets are still vulnerable to multiple compression. The major equity market lesson of the 1970’s was that higher inflation and higher interest rates pushed down the market multiple. Whilst bond yields can dip, it is not clear that yields will resume the downtrend that investors became accustomed to from 1982 – 2020.
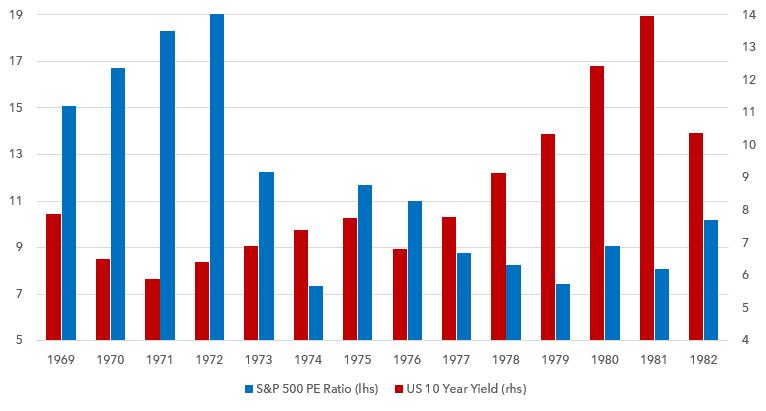
Below we show a bar chart with the S&P 500 PE ratio and the US Treasury yield from 1969 to 1982. In the late 60’s and early 70’s bond yields declined and the equity market multiple rose. But from 1972 – 1975 yields rose from 5.5% to 8%. After a shallow decline in 1976, yields increased to 15% in 1981. This pushed the PE ratio lower and lower, from 19x in 1972 to 7x in 1979.
Bond Yields and the S&P 500 PE Ratio 1969 – 1982
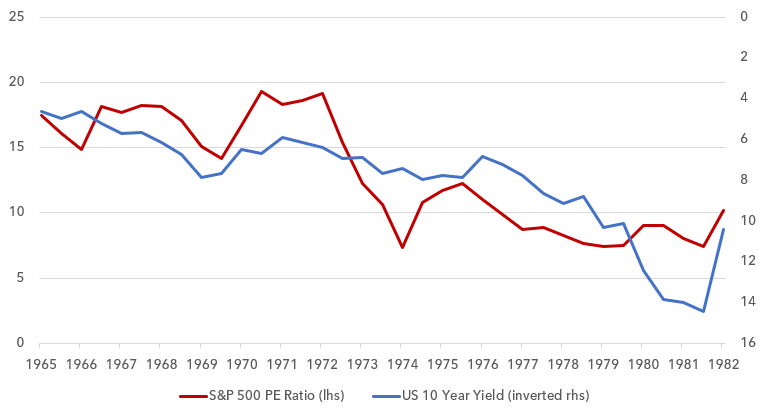
If we look at this data in a line chart and invert the scale on the right-hand side of the chart the relationship is a little easier to follow.
Bond Yields and the S&P 500 PE Ratio 1965 – 1982
Unfortunately, in different decades this relationship is not as clear cut and so we cannot mechanically predict multiples from bond yields. But today yields remain much lower than the inflation rate. If inflation remains persistent, bond yields may rise further than current levels over time. Investors can continue to protect themselves by investing in cheaper parts of the equity market that are less vulnerable to multiple compression.
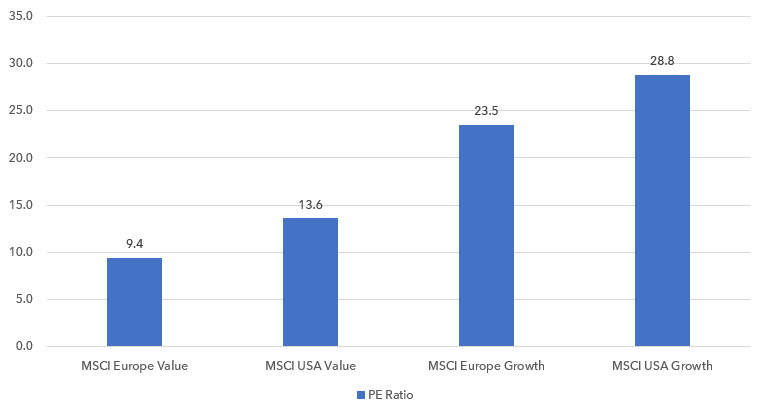
In this case European value equities continue to stand out. Below we show the PE ratio of European and US equities, with each split into value and growth. Growth equities remain expensive, despite their weak performance over the last year. European value equities are cheap on a global basis.
PE Ratios of Europe vs USA Value & Growth
Rising bond yields also provide a higher level of competition for capital. If you are invested in a security with a low growth rate that yields less than Sovereign bonds, the investment could see selling pressure as investors rotate out of it and into Government debt. This may explain why many “defensive” equities have sold off sharply in recent weeks.
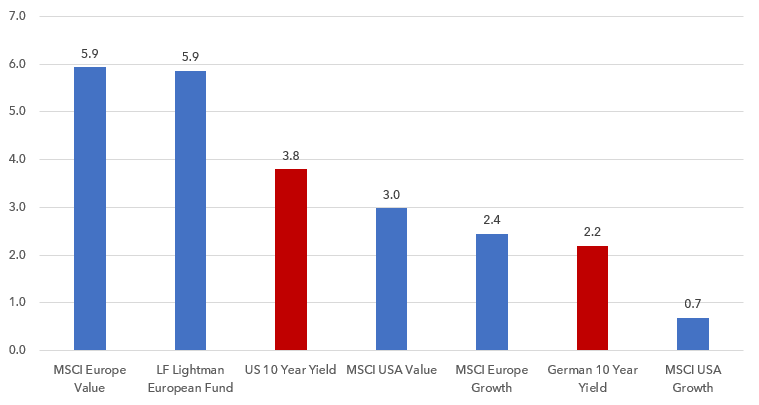
The Lightman Funds’ 2023 dividend yield is 5.85%, significantly above US Treasury yields and German Bund yields. This is one element that has protected the Lightman funds from some of the downside pressure seen in equities over the last year. On a global basis European value stands out positively.
2023 Dividend Yields vs US 10 Year Yield
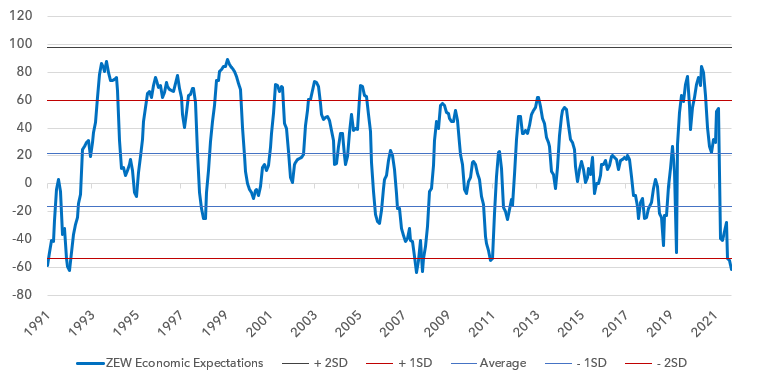
Europe also benefits from extremely low investor expectations. On some measures investors are more pessimistic about Europe than at any time on record. Below we show the entire history of the ZEW Survey of Economic Expectations with standard deviation bands. This is a survey of economic expectations in Germany for the coming 6 months. We have only seen this level of pessimism twice before, during the recession of 1992 and at the depths of the financial crisis in 2008.
ZEW Survey of Economic Expectations 1991 – 2022 with standard deviation bands
Next we show EU consumer confidence since it was launched in 1985. We are in uncharted territory on this series today, with the lowest consumer confidence ever. Sentiment is significantly more negative than during the pandemic and the financial crisis.
European Commission Consumer Confidence 1985 – 2022 with standard deviation bands

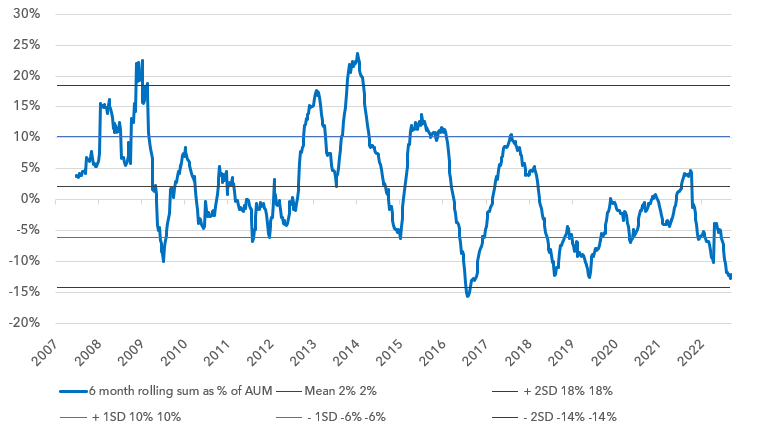
If we look at fund flows, we can see this pessimism has translated into significant European equity outflows. Below we take the largest 30 European equity funds launched before 2007 that provide regular data on fund pricing, units outstanding and assets under management. Most of these funds are made up of the largest European equity ETF’s in the industry. These 30 funds are a good representation of the European market. They once had a peak AUM of $155bn, but now sit at $63bn. We have taken a 6-month rolling sum of fund flows as a percentage of AUM. We take a 6-month rolling sum to find persistent selling. As is shown below, 2022 is not quite the record in sales as a percentage of AUM, but it is not far off.
European Equity Fund Flows 6 month rolling sum as a % of AUM
European equities have seen almost relentless selling since early 2018. These funds saw cumulative inflows from 2007 to a 2017 peak of $80bn. Since that date, these 30 funds have seen outflows of $50bn.
Cumulative Fund Flows of 30 Large European Equity Funds ($m) 2007 – 2022

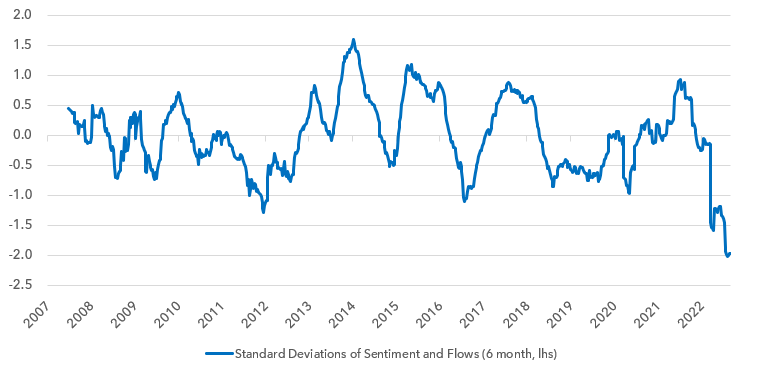
Below we combine the sentiment and fund flow data and standardise it. Each data point is reflected in standard deviations, sometimes called a Z-score. As is clear in the chart below, today shows the most negative sentiment and fund flow picture in European equities in this record.
Perhaps surprisingly, this series suggests sentiment and fund flows in Europe did not become deeply negative in 2007-8. Investors were more bearish during the Sovereign Debt Crisis of 2011-12, and around Brexit in 2016. But as is clear, 2022 is in a different league. Perhaps it is because of the war, the obviousness of the energy crisis, and the Euro-centric nature of the continent’s problems in 2022, but whatever it is, this year marks an extraordinary degree of investor pessimism in Europe.
At a minimum this suggests being bearish European equities is becoming risky. It also suggests we should be prepared for good news to have a larger positive impact on European equities than the negative impact of bad news.
European Sentiment & 6 Month Sum of European Equity Fund Flows in Standard Deviations 2007 – 2022
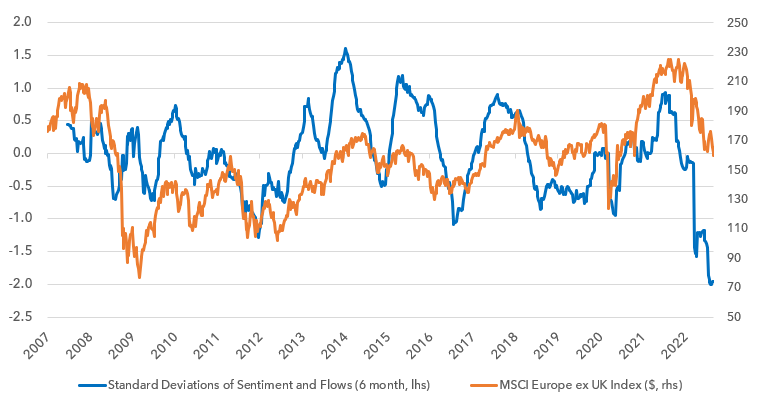
Does this sentiment and fund flow series have any predictive power with equities? Below we show the sentiment series with the European equity market index overlaid. We show the index in dollars. What is noticeable in the chart is that during the Financial Crisis of 2007-08, the mildly negative sentiment of that time did not provide a floor under the equity market. It did not help. But when sentiment was more negative in 2011-12 and during 2016, this deeper level of pessimism did provide a signal that it was time to think more bullishly. In 2018 the series was early by four months. In 2020 the signal was also quite useful.
The timing for these series is always a little off, and you cannot build a bull case exclusively on sentiment and fund flows. But the scale of negativity that is exhibited in Europe right now is so extreme that European equity investors should be prepared for the possibility of better returns ahead.
Sentiment & Flows in Standard Deviations vs MSCI Europe ex UK Index (USD)
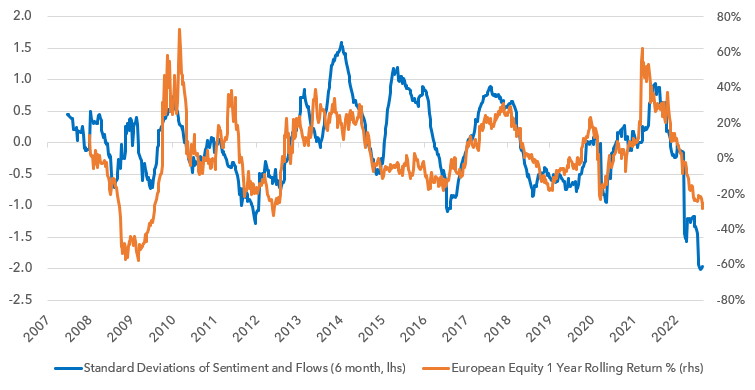
To look at this data in another way, we overlay the 12-month rolling return of the European equity market with the same sentiment and fund flow series below.
Sentiment & Flows in Standard Deviations vs 1 Year Rolling European Equity Market Performance
Given that the market is primed for better news to have an outsized impact, where could the good news come from? There are a few catalysts: 1) the gas crisis, 2) the war, 3) Italy and 4) the dollar.
1) Europe ought to be able to manage this winter’s energy crisis. European gas inventories continue to be built and are at 87.75% today. Given Norstream flows are at zero this is an incredible achievement. Since 2015, inventories have only been higher in September in 2019 and 2020.
EU Gas Storage By Month 2015 – 2022

Germany is the most exposed country and inventories now stand at 91%.
Germany Gas Storage By Month 2015 – 2022

Whilst a harsh winter could pose some problems for Europe, the amount of substitution that has already taken place by industry is significant.
- Repsol replaced their gas feedstock in their refining system with naphtha earlier this year. This switch cut Spanish national gas consumption by 3-4%.
- Ammonia production is a gas intensive process and now over 50% of EU plants are offline given gas prices this year. These curtailments will cut aggregate European gas consumption by over 2%.
- Electricity-intense users like aluminium and zinc smelters have also shut.
- Many industrial companies can replace or partially replace gas with fuel oil or LPG as a power or heating source. BASF, Evonik and Aurubis, three large German industrial users have all cut consumption. BASF’s own changes have the potential to reduce German annual gas consumption by nearly 1%.
Add these company-specific elements up and the substitution impact is set to be significant. Coupled with high inventories, this means Europe ought to be able to get through this winter.
2) Russia’s military position in the war is extremely precarious. This makes Putin himself vulnerable. Many believe Russia’s military underperformance is cyclical, and in time operational execution will improve. But this looks increasingly unlikely. Intelligence, logistics, decision making, training and equipment are structurally poor. Russia’s institutional weakness and kleptocracy are visible in its army. Morale is terrible. These points have been well articulated by some of the world’s leading military analysts and experts on the Russian army – by Michael Kofman and Sir Laurence Freedman in particular.
Russia’s partial mobilisation is now opening up significant dissent at home. Putin’s critics are growing. Russian liberals and internationally minded businesses were always in opposition to the war. But now the right wing of Russia is angry at recent military setbacks and the nature of the mobilisation. In recent days, previously fanatical supporters of Putin like Vladimir Solovyov and Margarita Simonyan are openly criticising the approach, even wondering if we could see a full army mutiny.
Putin has always managed to use the state to terrorise his opponents into submission before. But his power relies on the army and the security apparatus supporting him. This support is no longer certain. Whilst we cannot know if he will be replaced, it is becoming more possible than at any time since his presidency began. His removal is also probably the only mechanism to allow Russia to withdraw from the war and attempt to reset their international standing. Investors should at least be prepared for a possible end to the war and Putin’s replacement.
3) Italy. Giorgia Meloni’s victory in Italy has been a widely telegraphed catalyst for a renewed Sovereign debt crisis. Yet she has no incentive to weaken sentiment in the Italian bond market and understands the precarious state of Italy’s finances. The UK’s recent experience has also taught European countries a valuable lesson about the importance of fiscal discipline in an inflationary world. In our note in August we made the case that Italian solvency is stronger than the market’s perception. As Meloni takes office, we assume her policies and rhetoric will help to reduce Italian bond spreads, and with it lift sentiment for European equities overall.
4) The Dollar. Whilst the dollar appears on an unstoppable path, there are catalysts to drive a cyclical reversal. We expect the Bank of Japan will abandon its interest rate peg at some point in the coming months. Whilst this will cause volatility, it ought to cause a sharp rally in the yen and weaken the dollar. There is also a solid catalyst to lift the euro. In 2022 the euro is powerfully impacted by the European gas price. The higher the European gas price, the weaker Europe’s current account and economic performance, and so the weaker the euro. Our more benign assessment of Europe’s gas crisis this winter ought to see a sharp fall in European gas prices between now and next spring. This ought to lift the euro over the same period. A stronger yen and a stronger euro will help to reverse the strong dollar trend on a global basis. A weaker dollar will act to ease global financial conditions and can support emerging market economic growth at the margin. This in turn can help to lift sentiment in the European economy.
Whilst we may be facing a multi-year period of multiple compression, Europe and especially European value are cheap. Sentiment and fund flows in Europe are at record levels of pessimism. This makes European equities more sensitive to positive news than normal. Positive news can come in the form of a less severe energy crisis than expected, developments in relation to the war and Putin’s grip on power, a steadier Italy than discounted, and a cyclically weaker dollar. Long-term investors should view this as an entry point to add to European equities relative to the rest of the world. Within European equities, European value continues to exhibit the most compelling mix of upside potential and downside protection.
Legal
Disclaimer
This communication and its content are owned by Lightman Investment Management Limited (“Lightman”, “we”, “us”). Lightman Investment Management Limited (FRN: 827120) is authorised and regulated by the Financial Conduct Authority (“FCA”) as a UK MiFID portfolio manager eligible to deal with professional clients and eligible counterparties in the UK. Lightman is registered with Companies House in England and Wales under the registration number 11647387, having its registered office at c/o Buzzacott LLP, 130 Wood Street, London, United Kingdom, EC2V 6DL.
Target audience
This communication is intended for ‘Eligible Counterparties’ and ‘Professional’ clients only, as described under the UK Financial Services and Markets Act 2000 (“FSMA”) (and any amendments to it). It is not intended for ‘Retail’ clients and Lightman does not have permission to provide investment services to retail clients. Generally, marketing communications are only intended for ‘Eligible Counterparties’ and ‘Professional’ clients in the UK, unless they are being used for purposes other than marketing, such as regulations and compliance etc. The Firm may produce marketing or communication documents for selected investor types in non UK jurisdictions. Such documents would clearly state the target audience and target jurisdiction.
Collective Investment Scheme(s)
The collective investment scheme(s) – WS Lightman Investment Funds (PRN: 838695) (“UK OEIC”, “UK umbrella”), and WS Lightman European Fund (PRN: 838696) (“UK sub-fund”, “UK product”) are regulated collective scheme(s), authorised and regulated by the FCA. In accordance with Section 238 of FSMA, such schemes can be marketed to the UK general public. Lightman, however, does not intend to receive subscription or redemption orders from retail clients and accordingly such retail clients should either contact their investment adviser or the Management Company Waystone Management (UK) Limited (“Waystone UK”) in relation to any fund documents.
The collective investment scheme(s) - Elevation Fund SICAV (Code: O00012482) (“Luxembourg SICAV”, “Luxembourg umbrella”), and Lightman European Equities Fund (Code: O00012482_00000002) (“Luxembourg sub-fund”, “Lux product”) are regulated undertakings for collective investments in transferrable securities (UCITS), authorised and regulated by the Commission de Surveillance du Secteur Financier (CSSF) in Luxembourg. In accordance with regulatory approvals obtained under the requirements of the Law of 17 December 2010 relating to undertakings for collective investment, the schemes can be marketed to the public in Luxembourg, Norway, Spain, and Republic of Ireland. Lightman, however, does not intend to receive subscription or redemption orders from any client types for the Lux product and accordingly such client should either contact a domestic distributor, domestic investment advisor or the Management Company Link Fund Solutions (Luxembourg) S.A. (“Link Luxembourg”) in relation to any fund documents.
Luxembourg umbrella and Luxembourg sub-fund are also approved for marketing to professional clients and eligible counterparties in the UK under the UK National Private Placement Regime (NPPR). UK registration numbers for the funds are as follows: Elevation Fund SICAV (PRN: 957838) and Lightman European Equities Fund (PRN: 957839). Please write to us at compliance@lightmanfunds.com for proof of UK registration of the funds.
Luxembourg sub-fund is also approved for marketing to qualified investors in Switzerland, within the meaning of Art. 10 para. 3 and 3ter CISA. In Switzerland, the representative is Acolin Fund Services AG, Leutschenbachstrasse 50, 8050 Zurich, Switzerland, whilst the paying agent is NPB Neue Privat Bank AG, Limmatquai 1 / am Bellevue, 8024 Zurich, Switzerland.
Accuracy and correctness of information
Lightman takes all reasonable steps to ensure the accuracy and completeness of its communications; we however request all recipients to contact us directly for the latest information and documents as issued documents may not be fully updated. We cannot accept any liability arising from loss or damage from the use of this communication.
Wherever our communications refer to a third party such as Waystone, Link, Northern Trust etc., we cannot accept any responsibility for the availability of their services or the accuracy and correctness of their content. We urge users to contact the third party for any query related to their services.
Important information for non-UK persons (Including US persons)
This communication is not intended for any person outside of the UK, Switzerland, or the European Economic Area (EEA). Lightman or any of the funds referenced in this communication are not approved for marketing outside of the UK, Switzerland, or the EEA. All such persons must consult their domestic lawyers in relation to services or products offered by Lightman.
Risk warning to all investors
The value of investments in any financial assets may fall as well as rise. Investors may not get back the amount they originally invested. Past performance is not an indicator of future performance. Potential investors should not use this communication as the basis of an investment decision. Decisions to invest in any fund should be taken only on the basis of information available in the latest fund documents. Potential investors should carefully consider the risks described in those documents and, if required, consult a financial adviser before deciding to invest.
Offer, advice, or recommendation
No information in this communication is intended to act as an offer, investment advice or recommendation to buy or sell a product or to engage in investment services or activities. You must consult your investment adviser or a lawyer before engaging in any investment service or product.
GDPR
Lightman may process personal information of persons using this communication. Please read our privacy policy.
Copyright
This communication cannot be distributed or reproduced without our consent.