
Summary
- We believe investors should be prepared for the risk of a US-led bear market, given valuations and allocations that we show are similar to 1929
- Rising global bond yields and weak fiscal positions may start to put pressure on broad equity market valuations; value stocks ought to be less impacted
- Semiconductor valuations appear especially extended
- Geopolitical risks remain significant, but we view the outlook as mixed: we see cause for some optimism in Ukraine and Europe but for some pessimism in Taiwan and in semiconductor valuations
- Against this backdrop, the portfolio remains focused on companies with strong balance sheets, high free cash flow and the ability to return cash through dividends and buybacks
Valuation Update
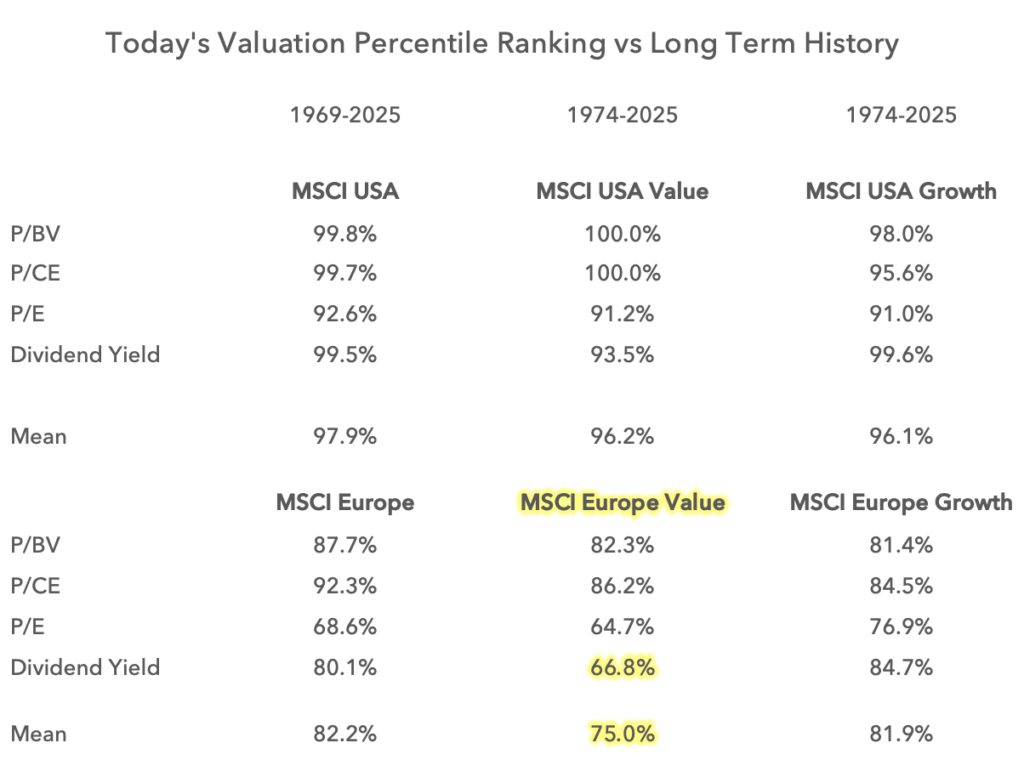 Valuations remain high, especially in the US, but European value remains a relative safe haven. Whilst valuation is not a great timing tool, it can inform us about the severity of a downturn, if it were to occur.
With such limited valuation support, investors should be prepared for the possibility of a bear market, with larger declines to be expected from equities in the US than in Europe.
A US-led bear market and the associated spillover risks for European equities are top of mind. We update and outline some of our key background measures and catalysts below.
Bond Yields
Global bond yields appear to be in an uptrend worldwide. Elevated or rising bond yields ought to continue to support value and eventually constrain equity market valuations at the index level. Investors should be prepared for a breaking point, perhaps with the US 10-year above 4.5% or 4.75%, where equity multiples start to compress. Clearly we are at or close to these levels today.
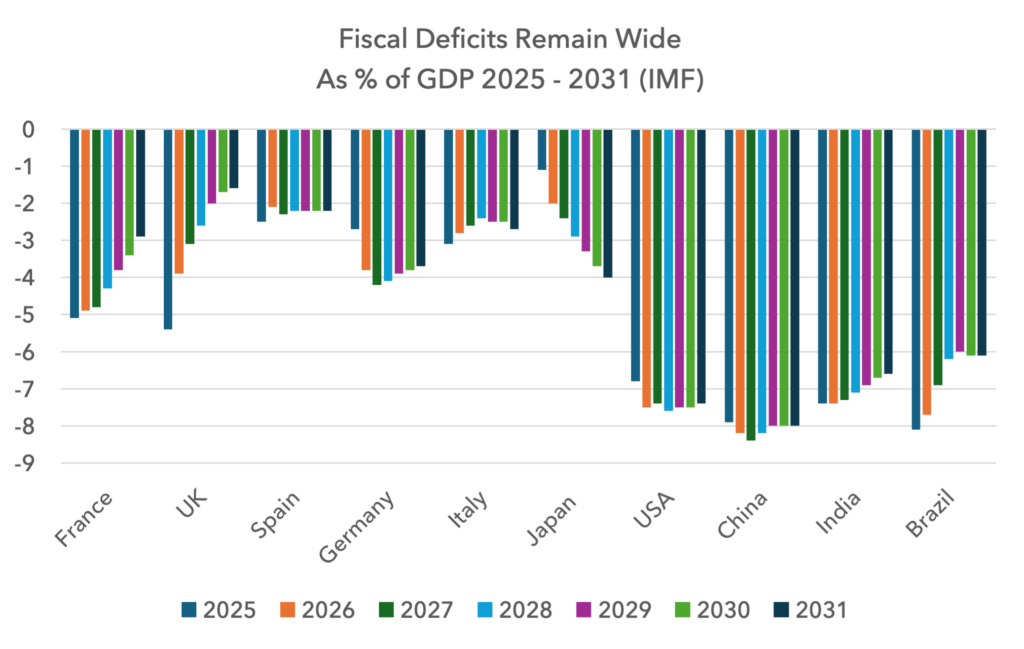
Fiscal positions remain weak, with limited improvements expected between now and 2031 according to the latest IMF forecasts. This suggests the rising yield environment in government debt may continue, albeit with some improvement expected in the UK and France.
Allocations
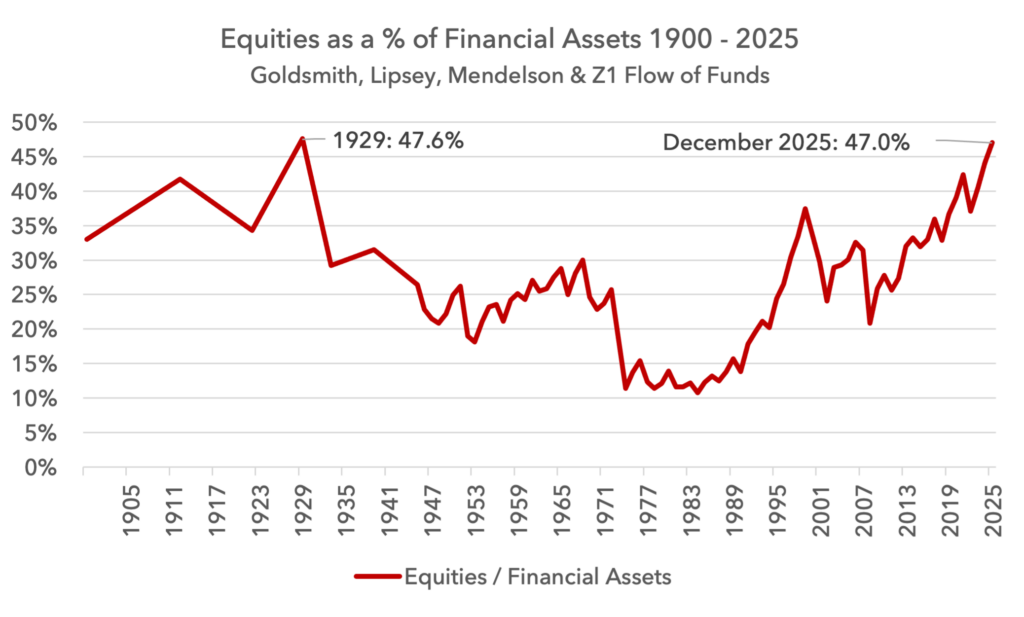
In past notes we looked at the Federal Reserve’s Z1 Flow of Funds, assessing US household investment allocations with data beginning in 1952. We had always wanted to study this data from the 1920s for a deeper historical perspective and have now found a pre-1952 series. We use Raymond Goldsmith, Robert Lipsey and Morris Mendelson’s “Studies in the National Balance Sheet of the United States” published in 1963, where US household balance sheets were constructed back to the 1890s. This work is cited by the Fed in its research as an appropriate historic bridge for the Z1 data. This paper has periodic data points from 1900-1952 including, importantly, 1929.
Below we combine the Goldsmith study with the Z1 series, showing a combined picture for equity exposure back to 1900. The chart is shocking. As of December 2025, US household equity allocations are at levels only seen once before: 1929.
The next chart assesses equities as a percentage of total assets. The picture is similar, and even more extended.
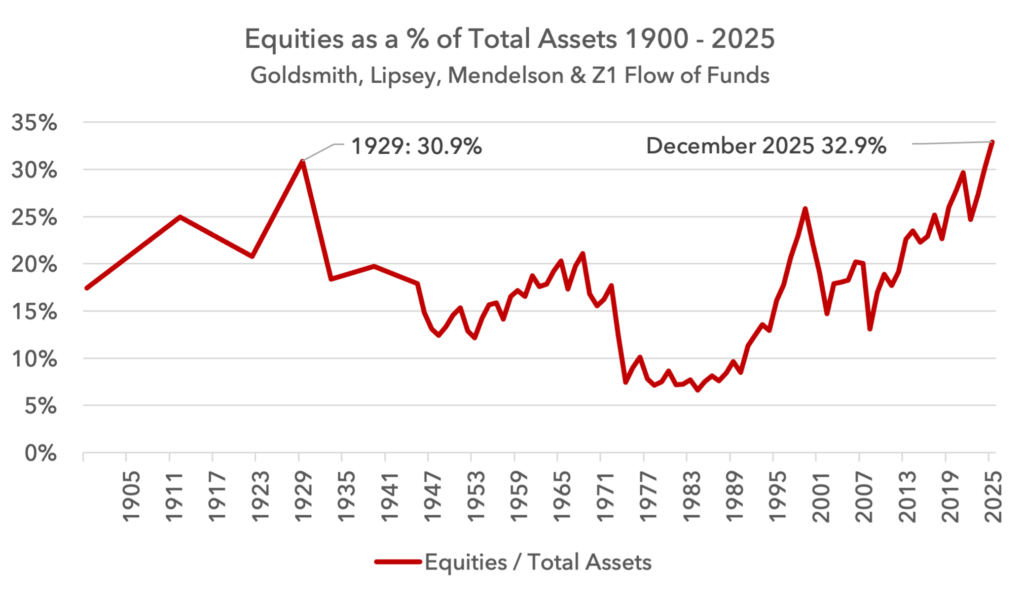
Clearly equity allocations could continue to make new highs, but it is important to know that there is no historical analogue for US households to have bigger allocations to equities than today. The last time they were this high, markets saw huge declines. This suggests to us that if markets were to turn down and gather momentum, the downside could be severe.
Recent economic models are showing that rising equity wealth is making a large contribution to overall GDP growth. This makes sense, given the scale of equity holdings as a share of US net worth. But it also indicates that a bear market could weaken the economy more than usual, leading to a self-reinforcing downturn, at least for a period of time.
In past notes we have shown that the equivalent data in Europe is much less extended.
The Buffett Indicator
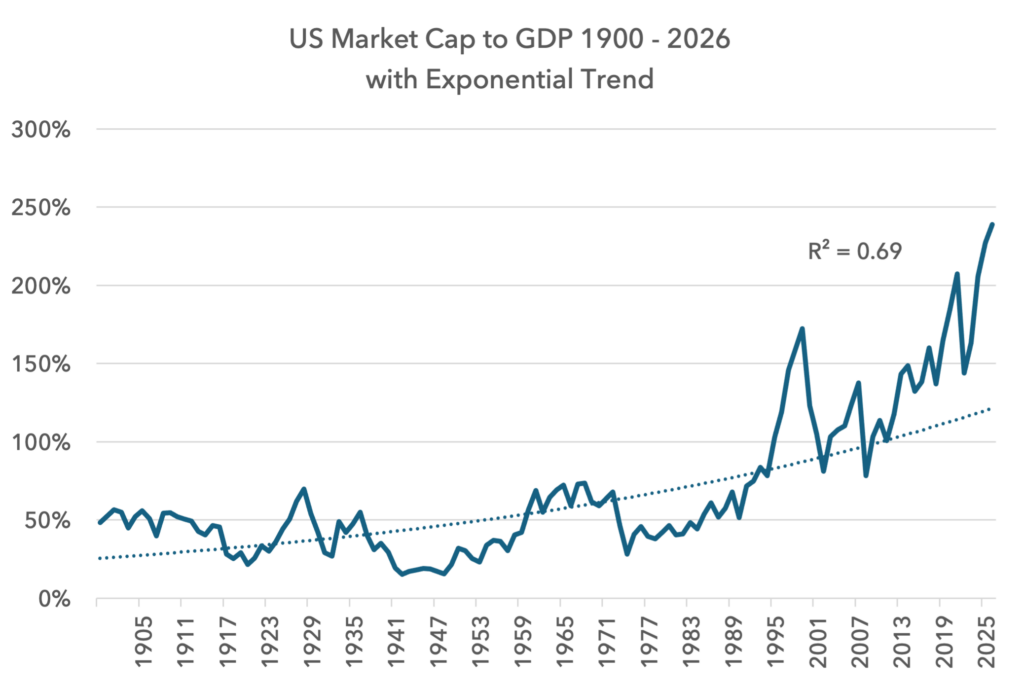
Below we show an update of the market cap to GDP chart, one of Warren Buffett’s favourite indicators, going back to 1900, with an exponential trend line.
On this basis, US equity market capitalisation looks very extended relative to the size of the economy, but it is worth noting the change in steepness from the 1970s.
In 1971, when Nixon broke the dollar peg to gold, the advent of a free-floating dollar kick-started the financialisation of the economy. As interest rates and other parts of the financial system were progressively deregulated over the decades, the financialisation accelerated. This appears to have caused an acceleration in the share of US equity valuations as a percentage of GDP.
If we run the same chart but start the series from 1970 and show it also with an exponential trend, we see a much smaller divergence.
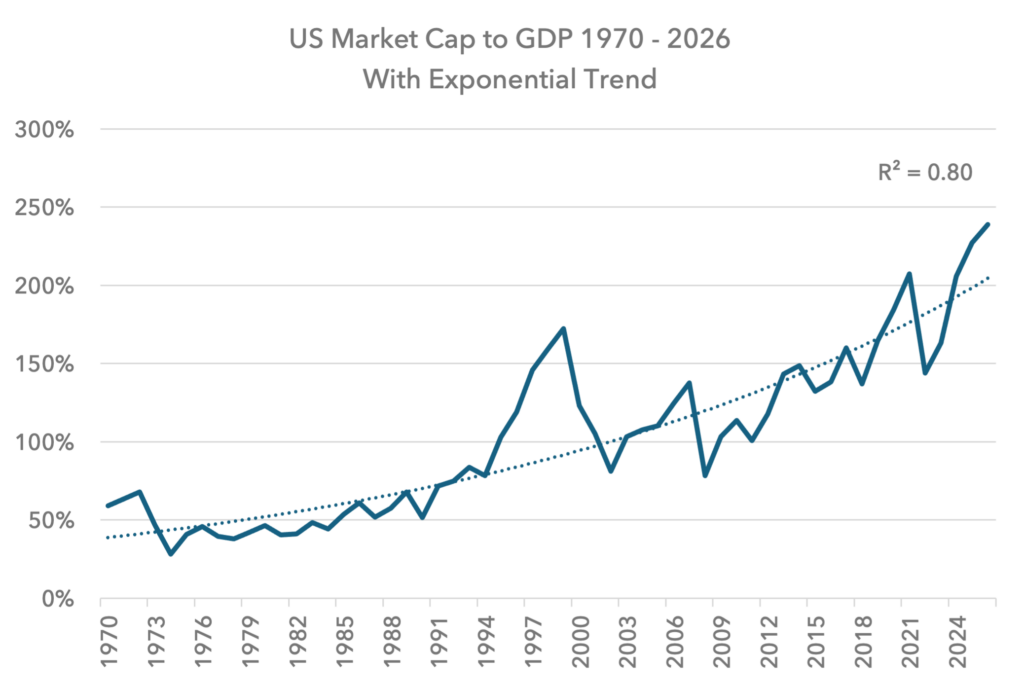
On this basis, a market decline of 15% would bring the ratio of market cap to GDP back to trend. A 25% decline would bring the index to one standard deviation below trend. But it is worth remembering that this is an exponential trend line! The equitisation of the economy would need to continue to accelerate for this trend line to hold true – a linear progression is not enough. It is obviously hard to predict if this period of ever-accelerating financialisation will continue or not.
It is also worth stating that there is downside to equities even in this exponential trend scenario.
This is a more optimistic take on assessing downside scenarios than some of the other metrics above. Based on valuation and allocation, market declines could be expected to be larger.
The Semiconductor Bubble
When considering the possibility of a bear market it is worth focusing on the durability of the leaders in the stock market, where sentiment is most euphoric. Can this leadership be sustained? Semiconductors stand out in this cycle for obvious reasons.
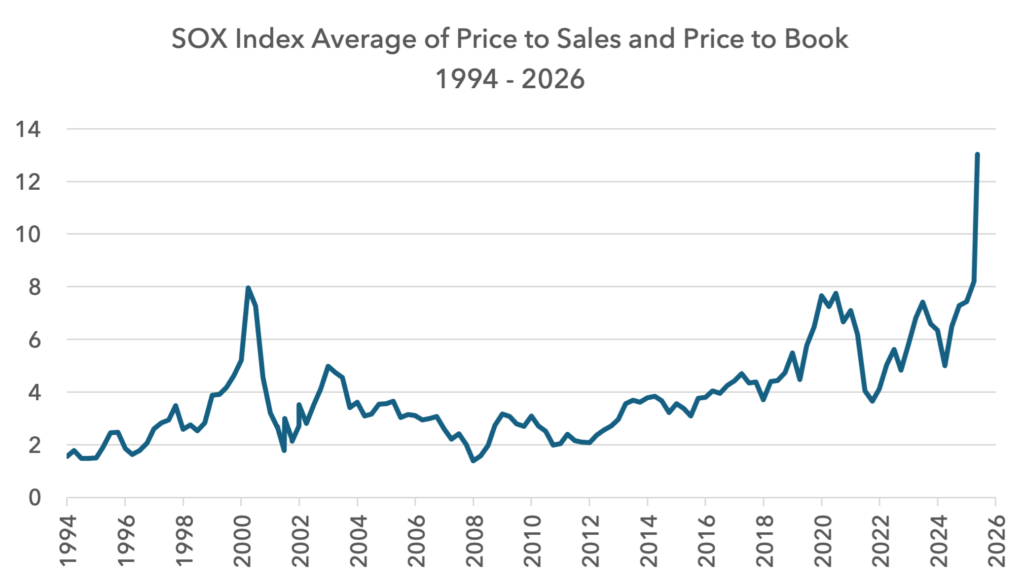
By most metrics, semiconductors appear to be in a fully inflated bubble. The Philadelphia SOX index dates back to 1994, but the published valuation data from it starts in 2002. This means investors cannot put today’s valuation in the context of the dotcom period. Below we fix this problem, having reconstructed the valuation series from 1994-2002 using the underlying securities in the index.
We take an average of price to sales and price to book. Today’s valuation is extraordinary, and now 50% above the peak of the dotcom boom.
Valuation can also be assessed in standard deviation terms. Below we take the optimistic / generous view, and calculate the standard deviation with an expanding window, meaning calculations are made only using data available up to each point in time. Even using this methodology, today’s semiconductor valuation is far more extended in standard deviation terms than the peak of dotcom. At the peak of dotcom, semiconductor valuations reached 3.5 standard deviations from the mean at that time; today it is 5 standard deviations from the expanding mean.
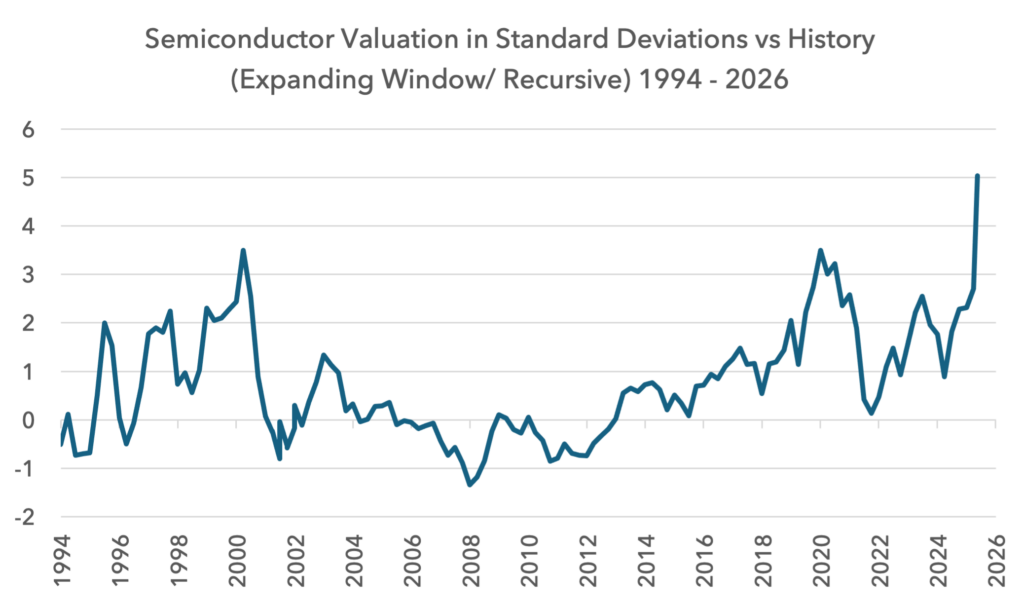
As stated above, valuation is not a great timing tool, but it can inform investors about the potential severity of a downturn. In this case, a return to the mean would entail a 70% decline in the SOX Semiconductor index.
As value investors we do not pretend to be semiconductor experts, but this valuation series suggests investors would be better prepared running scenarios for what could go wrong versus what could go right for the sector.
Geopolitical Update
We do not manage the portfolio attempting to predict geopolitical outcomes, but we view their assessment as part of risk management. This becomes more relevant when possible scenarios are associated with high severity for markets. Even low-probability events are important to consider if they are associated with high equity market severity. In 2026, we see possible high impact events on the horizon and so spend some time discussing them below.
We see upside as well as downside risks from geopolitics this year and next. We are more optimistic on Ukraine and more pessimistic on Taiwan.
On Iran, it does not appear that there is a military solution to opening the Strait of Hormuz, and so a political solution seems required. Today, this political agreement does not appear imminent. The US is coping better than most countries with the current deadlock, whilst Iran is under enormous economic pressure. The Iranian currency has halved over the last year, with $1 now buying 1,800,000 rials. It appears the Iranians need to blink first, but predicting the timing of this or its likelihood is difficult.
We remain invested in energy, albeit with lower exposure than at the breakout of the war, and fertiliser, and so ought to be able to perform reasonably well if the Strait remains restricted. We have focused our positions in liquid holdings where valuations are low, balance sheets are strong and free cash flow is high.
Russia
We are more optimistic about a potential ceasefire in Ukraine in 2026. This is built on the following logic:
- Victor Orbán’s defeat as Prime Minister of Hungary. This is a huge boost for Ukraine and a hammer blow to Russia. Orbán was holding back EU funding for Ukraine. Post his loss, €90bn of allocated money is now flowing, equivalent to 40-50% of GDP, keeping the Ukrainian economy afloat and its military funded for the next two years. This is a decisive sign of the EU’s commitment to its ally. It also makes it clear to Russia that they cannot outspend their opponent.
- Recent battlefield developments. Ukraine has taken back territory from Russia since early March. The Institute for the Study of War puts the reclaimed territory at 235 sq km, the first gains since mid-2023. Ukraine has benefitted from successful strikes on Russian supply lines, alongside severe command and communications problems on the Russian side. Russian battlefield casualties have also leapt higher this year, with Ukraine’s drone strikes becoming increasingly lethal. Last year Russia lost 120 soldiers per sq km gained, an already terrible figure. This year that number has jumped to 316 and in the Donetsk region it is now 470. This is now far outpacing recruitment, despite the huge financial incentives Russia is offering. To state the obvious, this is not sustainable.
- Russian infrastructure damage and economic pressure. 20% of Russia’s domestic oil refining capacity and 40% of its maritime export facilities are offline after Ukrainian drone strikes. This has limited the benefits of higher oil prices to the economy. Economic pressure is rising, with real GDP growth dropping toward zero.
- Ukraine’s capacity to strike Moscow. Putin’s bargain with the Russian people was largely a bargain with the urban elites. The war could continue as long as it did not impact ordinary people’s lives, in particular people in Moscow. This is no longer the case.
- Putin making very limited public appearances. Recent press reports suggest Putin is becoming increasingly paranoid of an internal coup or assassination, spending most of his time in heavily fortified bunkers in Moscow and on the Black Sea coast. His recent appearance at the 9 May Victory Day rally was brief and involved a full mobile internet blackout across Moscow.
- Recent commentary. Both Sergey Lavrov and the Ukrainian chief negotiator Budanov are starting to talk openly of a ceasefire becoming more likely. Even Putin on 9 May stated that the war is “coming to an end.”
None of this suggests peace is imminent, but it moves the probability of a ceasefire higher. This would be bullish for European equities relative to the rest of the world. A Ukrainian reconstruction would be a significant growth driver and precautionary savings that have been built up in Poland and Germany would likely come down. We have maintained our exposure to banks in absolute terms but made some changes to hold some banks with more leverage into a peace. We have also made adjustments to our oil and materials exposure to hold companies that can benefit more decisively from the war’s end.
Taiwan
We view the Iranian intervention as being best understood as part of US preparation for a future conflict with China. The US is systematically going after China’s allies. First it was Venezuela, then Cuba, now Iran. Despite Trump’s statements, the US also continues to assist Ukraine against Russia.
The risks of these interventions against China’s allies are high, especially with the mid-term elections so close, and yet the US proceeded. This action suggests that US intelligence sees the risks of a future conflict with China as elevated, meriting an aggressive and high risk response now. The US knows that if it is to face China, it will require its full force in one theatre.
On 30 January 2026, China, Russia and Iran signed a trilateral comprehensive strategic pact. This accord covers diplomatic strategy, economic resilience and military coordination. It builds on bilateral treaties signed between these countries in previous years.
The treaty opened up the possibility of a coordinated military intervention in different theatres designed to stretch the United States and her allies.
By intervening in Iran today, the US has degraded Iran militarily to the point where future Iranian aggression could be contained without the need for US support. Israel, perhaps with some assistance from the UAE and the French and UK navies, would likely be able to contain any attempted Iranian escalation in the Gulf.
NATO’s expanding capabilities and Ukraine’s battlefield success lifts the probability that any renewed Russian aggression in Europe could also be contained better than in the past.
This leaves the US more capable of facing China in one theatre, in the Taiwan Strait. In this sense, the Iranian intervention could be seen as a masterstroke in the larger geopolitical picture, provided China is not able to move on Taiwan this year. Yes, the closure of the Strait is damaging, but it might be a price worth paying if it lifts the probability of success against China in the future.
China’s Timeline Incentives
Xi purged a number of top military staff earlier this year including Zhang Youxia, the highest ranking general. Commentary suggests the primary rift was around China’s readiness to execute a successful amphibious invasion or blockade of Taiwan by 2027. Reports argue that Xi was pushing for 2027 whilst the generals were arguing for 2035.
Many investors wonder why China would attempt to seize Taiwan imminently. It risks war with the US and global isolation. But there are a number of reasons why an attempt to take increased control over Taiwan is more likely sooner than later.
As each year goes by, Taiwan develops a stronger non-Chinese identity. In 1993, 18% of Taiwanese people identified themselves as strictly Taiwanese, whilst 26% identified themselves as Chinese. In 2023 these numbers were 62% and 2%.
Taiwan has observed what happened to Hong Kong after the British handed it over and it does not want the same. The Democratic Progressive Party (DPP), the party in favour of greater Taiwanese diplomatic standing, has won the last three elections. The Kuomintang (KMT), which promotes the idea of one China, continues to lose ground. Taiwanese antipathy towards China appears to be increasing.
China’s deteriorating demographics are also relevant. China’s one child policy and weak birth ratio has led to an inverted population pyramid and a declining population. As each year goes by, the number of future soldiers that could be recruited into the People’s Liberation Army (PLA) goes down. The longer China waits, the weaker its manpower position becomes.
Military power is clearly not just a function of manpower, but also economic power. Here, there is dispute, but it is clear that China’s economic model has been struggling in recent years. China’s infrastructure and housing boom has come to an end. Its real estate bubble has burst, and it is hard to see why it should reignite given a declining population. China’s relative economic power may not be growing relative to the west, arguing for action sooner rather than later.
Taiwan is also strengthening itself militarily and the US is shoring up support in the region. Japan, Australia and Korea are ramping up defence spending, including nuclear-powered submarines and unmanned aerial, surface and underwater systems. The US is also developing ties with Indonesia and Vietnam which are themselves ramping up defence spending. These strengthening ties increase the cost to China of waiting. Its opponents are strengthening.
US incentives
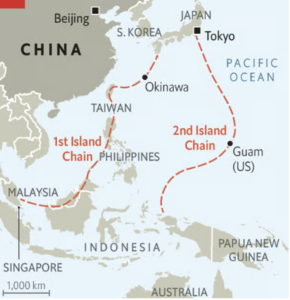
Taiwan’s semiconductor capacity is top of mind, but this is not likely part of either the Chinese or US calculus. In any conflict, the Taiwanese will take these facilities offline permanently, and specialist staff would be attempted to be evacuated.
With TSMC (Taiwan Semiconductor Manufacturing Company) developing semiconductor fabrication plants, or “fabs”, in the US, some believe the US will not need to worry about Taiwan in future and could let China take control of it with little consequence. But this misses the strategic value of Taiwan.
The Taiwan strait is only 60m deep, whilst to the east of Taiwan the water depth is 4km. Keeping China inside the First Island Chain limits its ability to project power across the world. Chinese submarines are easily monitored in the Strait, but not beyond it. If the US lets China take control of Taiwan, “an unsinkable aircraft carrier”, the cost of facing China is seen as rising significantly in the future.
Considering Scenarios
A military invasion of Taiwan would be incredibly difficult. The Taiwan Strait is one of the most hostile bodies of water in the world, with weather so severe than an invasion could only happen during two months of the year: April and October. The sheer volume of Chinese soldiers required for an amphibious assault would be staggering.
The 130km crossing is long enough to give the Taiwanese and the US plenty of time to launch counter measures. The approach from the west coast of Taiwan is shallow and the coastline would be mined. For those soldiers who made it onto the island, the terrain is difficult to traverse, with Taipei protected by large mountain ranges that act as a natural fortress.
All of this makes a full invasion unlikely. It is more likely that China could launch “grey-zone” operations, including restrictions of critical minerals or a partial blockade.
A partial blockade or “quarantine” could be useful for the Chinese by staying below the threshold of armed conflict but imposing significant pressure on Taiwan. Food and medicine would be allowed to flow but other elements may not. It would be hard for the US to grade an appropriate response.
Market Implications
Finished semiconductor chips leave Taiwan by air, but many of the raw materials arrive by sea. Raw silicon, ultra-pure water systems, specialty chemicals and gases travel to the island by ship, much of it from China. TSMC stockpiles some of these raw materials but some are chemically unstable, stored under pressure or at ultra-low temperatures, making a build-up of inventory difficult.
China has already threatened the flow of rare earths but has paused restrictions until 10 November. Gases like Neon, Krypton, Helium and Xenon could be restricted in due course.
Any restrictions on the flow of these materials would quickly impact TSMC’s production. Given valuations of semiconductors, as discussed above, there is no room for error. 60% of all semiconductor manufacturing and 90% of high-end chips are connected to Taiwan. This would be a cliff edge for the valuations of chip makers and many of the associated AI capex companies.
Portfolio Update
Risk Assessment and Strategy
Given all the above, we are worried about downside risks to equity markets, led by the US and in particular semiconductors. There is an asymmetry in the risk profile for some parts of the equity market today that we view as historic. Upside is limited but downside has the potential to be large. This leads us to be more wary of downside risks than normal.
This does not require any change in our overall strategy or positioning. We believe we can manage these risks with stock selection alone. We will not use derivatives and do not see the need to use them. Our aim, as ever, is to participate as the equity market rises but try to deliver some protection if the market was to decline.
Our process focusses on companies with high free cash flow, strong balance sheets and the capacity to return cash quickly to us in dividends and buybacks. We look for companies where earnings expectations are muted, with the capacity to surprise positively. This ought to lend the portfolio some degree of resilience if volatility was to rise.
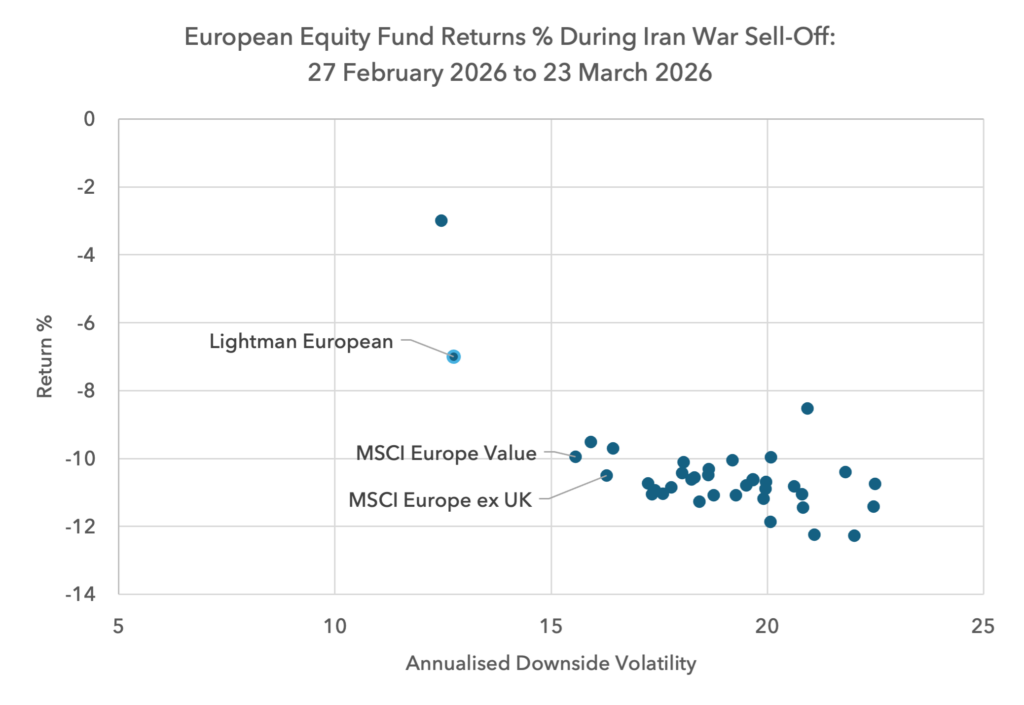
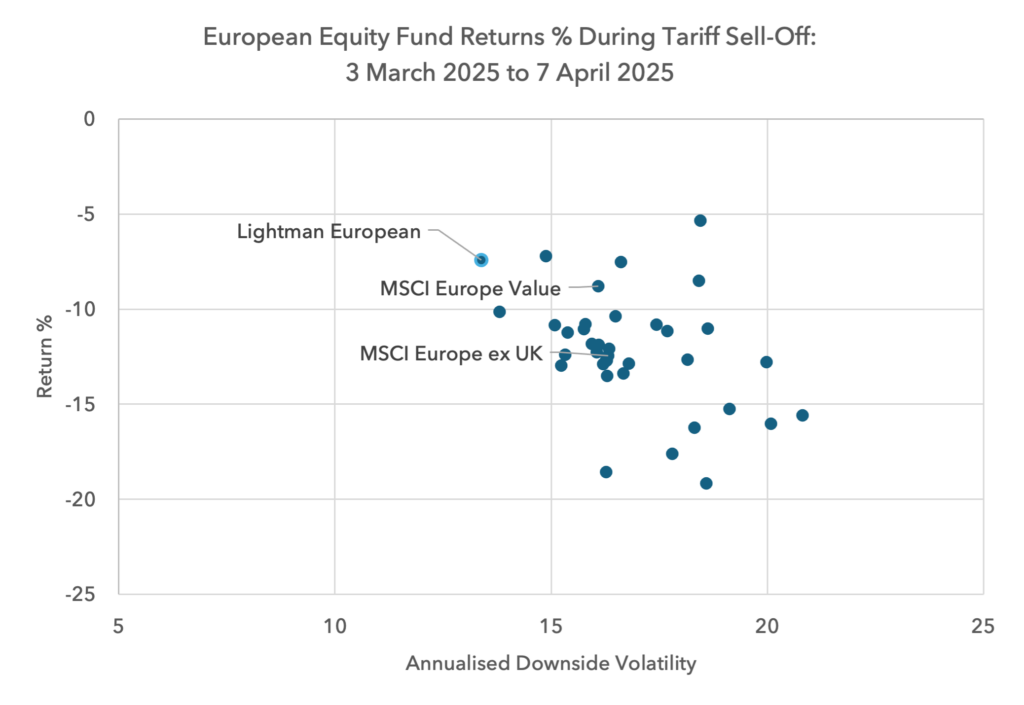
Whilst we cannot promise portfolio defensiveness, it is a strategic focus. In the last two significant drawdowns, the portfolio was reasonably resilient. Below we show how it fared during the last two significant bouts of risk aversion, during the tariff related sell-off in 2025 and the recent Iran war sell-off. We show the performance during the peak to the trough of each market decline. We label the portfolio versus the benchmark and the value index in comparison to the 35 largest funds in the peer group. Whilst our portfolio was not the best performing, it held up reasonably well.
Portfolio Adjustments
We sold our positions in BMW and Volkswagen in March and April. Whilst the sector remains cheap, the sharp move higher in the oil price and in interest rates is a headwind for earnings for the time being. We are also discounting the value of their profit pool in China more than in the past, resulting in a lower valuation. We were fortunate not to lose money in absolute or relative terms since we bought them in late-2024. We anticipate there being opportunities in this sector in due course.
We are finding more opportunities in consumer staples companies, like Magnum Ice Cream, and in pharmaceuticals than in most other sectors. We continue to like telecoms and are expecting a period of underperformance for banks. We find defence and AI-adjacent companies to be meaningfully overvalued and so avoid these areas. We still see opportunities in energy and materials but view these sectors as more selective than in the past.
The portfolio has a PE ratio of 15.0 in 2026 and 13.4 in 2027, with a forecast dividend yield of 3.5% this year and 3.7% next.
We continue to believe there is the possibility to generate positive absolute returns for the remainder of this year and next, but we believe the relative performance opportunity is more significant.
Sources:
Sources: Federal Reserve Z1 Flow of Funds, NBER, Goldsmith, Lipsey, Mendelson, Sector Balance Sheets, www.nber.org/chapters/c5738, IMF, The Institute for the Study of War, The Economist, Zineb Riboua, The Hudson Institute, William Spaniel, PRC Macro, Renmac, Strategas, Bloomberg, MSCI.
Legal
Disclaimer
This communication and its content are owned by Lightman Investment Management Limited (“Lightman”, “we”, “us”). Lightman Investment Management Limited (FRN: 827120) is authorised and regulated by the Financial Conduct Authority (“FCA”) as a UK MiFID portfolio manager eligible to deal with professional clients and eligible counterparties in the UK. Lightman is registered with Companies House in England and Wales under the registration number 11647387, having its registered office at c/o Buzzacott LLP, 130 Wood Street, London, United Kingdom, EC2V 6DL.
Target audience
This communication is intended for ‘Eligible Counterparties’ and ‘Professional’ clients only, as described under the UK Financial Services and Markets Act 2000 (“FSMA”) (and any amendments to it). It is not intended for ‘Retail’ clients and Lightman does not have permission to provide investment services to retail clients. Generally, marketing communications are only intended for ‘Eligible Counterparties’ and ‘Professional’ clients in the UK, unless they are being used for purposes other than marketing, such as regulations and compliance etc. The Firm may produce marketing or communication documents for selected investor types in non UK jurisdictions. Such documents would clearly state the target audience and target jurisdiction.
Collective Investment Scheme(s)
The collective investment scheme(s) – WS Lightman Investment Funds (PRN: 838695) (“UK OEIC”, “UK umbrella”), and WS Lightman European Fund (PRN: 838696) (“UK sub-fund”, “UK product”) are regulated collective scheme(s), authorised and regulated by the FCA. In accordance with Section 238 of FSMA, such schemes can be marketed to the UK general public. Lightman, however, does not intend to receive subscription or redemption orders from retail clients and accordingly such retail clients should either contact their investment adviser or the Management Company Waystone Management (UK) Limited (“Waystone UK”) in relation to any fund documents.
The collective investment scheme(s) - Elevation Fund SICAV (Code: O00012482) (“Luxembourg SICAV”, “Luxembourg umbrella”), and Lightman European Equities Fund (Code: O00012482_00000002) (“Luxembourg sub-fund”, “Lux product”) are regulated undertakings for collective investments in transferrable securities (UCITS), authorised and regulated by the Commission de Surveillance du Secteur Financier (CSSF) in Luxembourg. In accordance with regulatory approvals obtained under the requirements of the Law of 17 December 2010 relating to undertakings for collective investment, the schemes can be marketed to the public in Luxembourg, Norway, Spain, and Republic of Ireland. Lightman, however, does not intend to receive subscription or redemption orders from any client types for the Lux product and accordingly such client should either contact a domestic distributor, domestic investment advisor or the Management Company Link Fund Solutions (Luxembourg) S.A. (“Link Luxembourg”) in relation to any fund documents.
Luxembourg umbrella and Luxembourg sub-fund are also approved for marketing to professional clients and eligible counterparties in the UK under the UK National Private Placement Regime (NPPR). UK registration numbers for the funds are as follows: Elevation Fund SICAV (PRN: 957838) and Lightman European Equities Fund (PRN: 957839). Please write to us at compliance@lightmanfunds.com for proof of UK registration of the funds.
Luxembourg sub-fund is also approved for marketing to qualified investors in Switzerland, within the meaning of Art. 10 para. 3 and 3ter CISA. In Switzerland, the representative is Acolin Fund Services AG, Leutschenbachstrasse 50, 8050 Zurich, Switzerland, whilst the paying agent is NPB Neue Privat Bank AG, Limmatquai 1 / am Bellevue, 8024 Zurich, Switzerland.
Accuracy and correctness of information
Lightman takes all reasonable steps to ensure the accuracy and completeness of its communications; we however request all recipients to contact us directly for the latest information and documents as issued documents may not be fully updated. We cannot accept any liability arising from loss or damage from the use of this communication.
Wherever our communications refer to a third party such as Waystone, Link, Northern Trust etc., we cannot accept any responsibility for the availability of their services or the accuracy and correctness of their content. We urge users to contact the third party for any query related to their services.
Important information for non-UK persons (Including US persons)
This communication is not intended for any person outside of the UK, Switzerland, or the European Economic Area (EEA). Lightman or any of the funds referenced in this communication are not approved for marketing outside of the UK, Switzerland, or the EEA. All such persons must consult their domestic lawyers in relation to services or products offered by Lightman.
Risk warning to all investors
The value of investments in any financial assets may fall as well as rise. Investors may not get back the amount they originally invested. Past performance is not an indicator of future performance. Potential investors should not use this communication as the basis of an investment decision. Decisions to invest in any fund should be taken only on the basis of information available in the latest fund documents. Potential investors should carefully consider the risks described in those documents and, if required, consult a financial adviser before deciding to invest.
Offer, advice, or recommendation
No information in this communication is intended to act as an offer, investment advice or recommendation to buy or sell a product or to engage in investment services or activities. You must consult your investment adviser or a lawyer before engaging in any investment service or product.
GDPR
Lightman may process personal information of persons using this communication. Please read our privacy policy.
Copyright
This communication cannot be distributed or reproduced without our consent.