
- Value is performing better than is widely perceived, with broad outperformance across geographies and market caps.
- The performance is even stronger when adjusted for risk.
- US mega-cap growth is the major hold-out for growth outperformance in price terms. But strikingly US mega-cap growth is exhibiting high downside volatility, meaning that in risk-adjusted terms it is underperforming US large-cap value.
- Despite value’s long-term record, the pushback has always been about timing and the fear of being early. The work below suggests the turn for value is now well established and that its outperformance may be on track.
In this note we review the performance of low priced value equities compared to high priced growth equities across geographies and across the market cap spectrum.
We assess Europe, the US, the UK, Japan and Emerging Markets. For each, we look at small-cap, mid-cap and large-cap performance both in price terms and in risk-adjusted terms where we incorporate downside volatility and calculate the Sortino ratio.
We use two different measurement periods. The first is from November 2020 to date and the second shows the year to date performance.
The November 2020 start date is of course favourable for value. This date was chosen because it was a major turning point for value – one that has the potential to go down in stock market history. An entire book could be written on why value turned up then, but we could simplify the explanation to extreme undervaluation, extreme underweight positioning and the fundamentals changing.
We have used a lot of charts in this note and not much text, enabling the story to be told quickly. We look first at Europe and the US in the most detail, before a briefer review of the other markets.
Europe
November 2020 to date
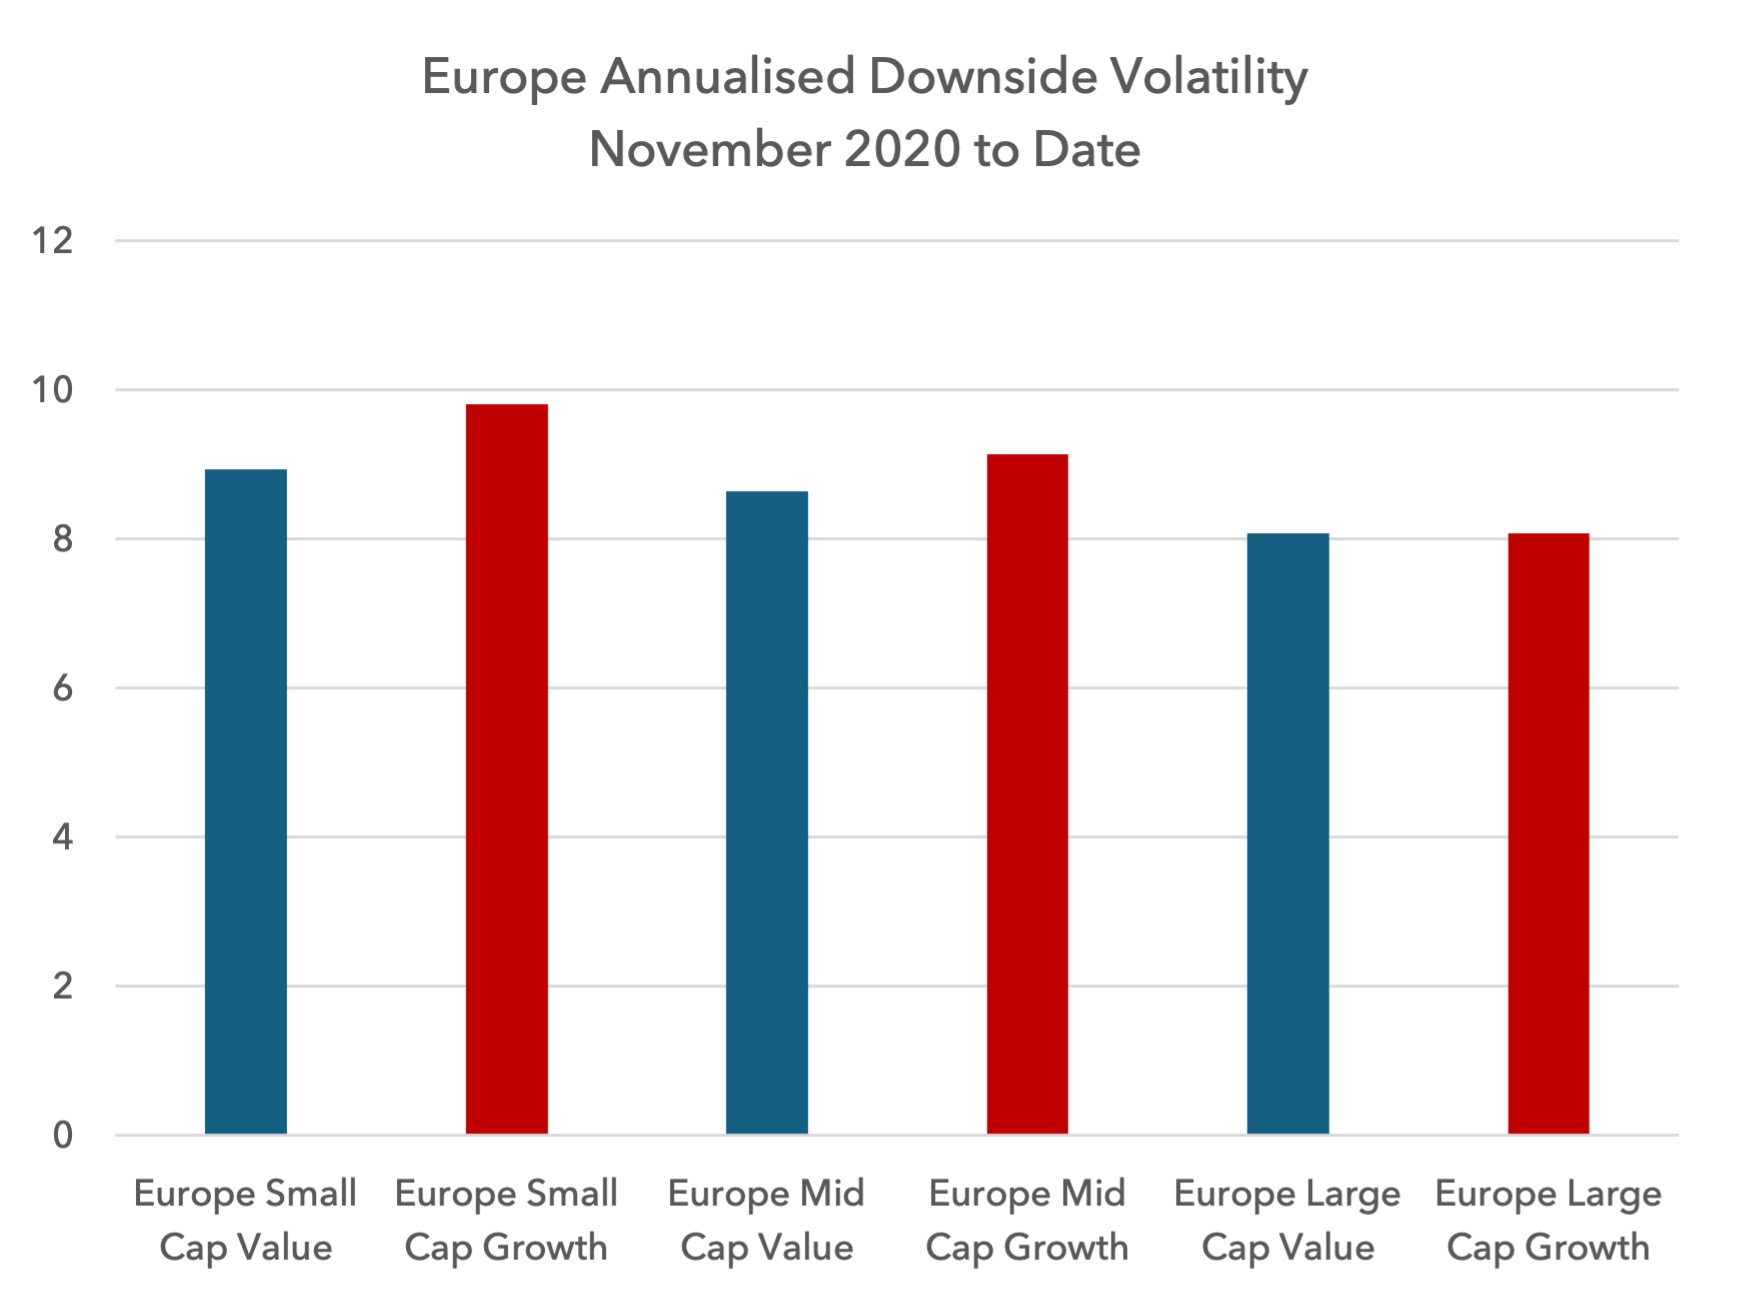
In Europe from November 2020 to the time of writing, value has outperformed growth across all market caps.
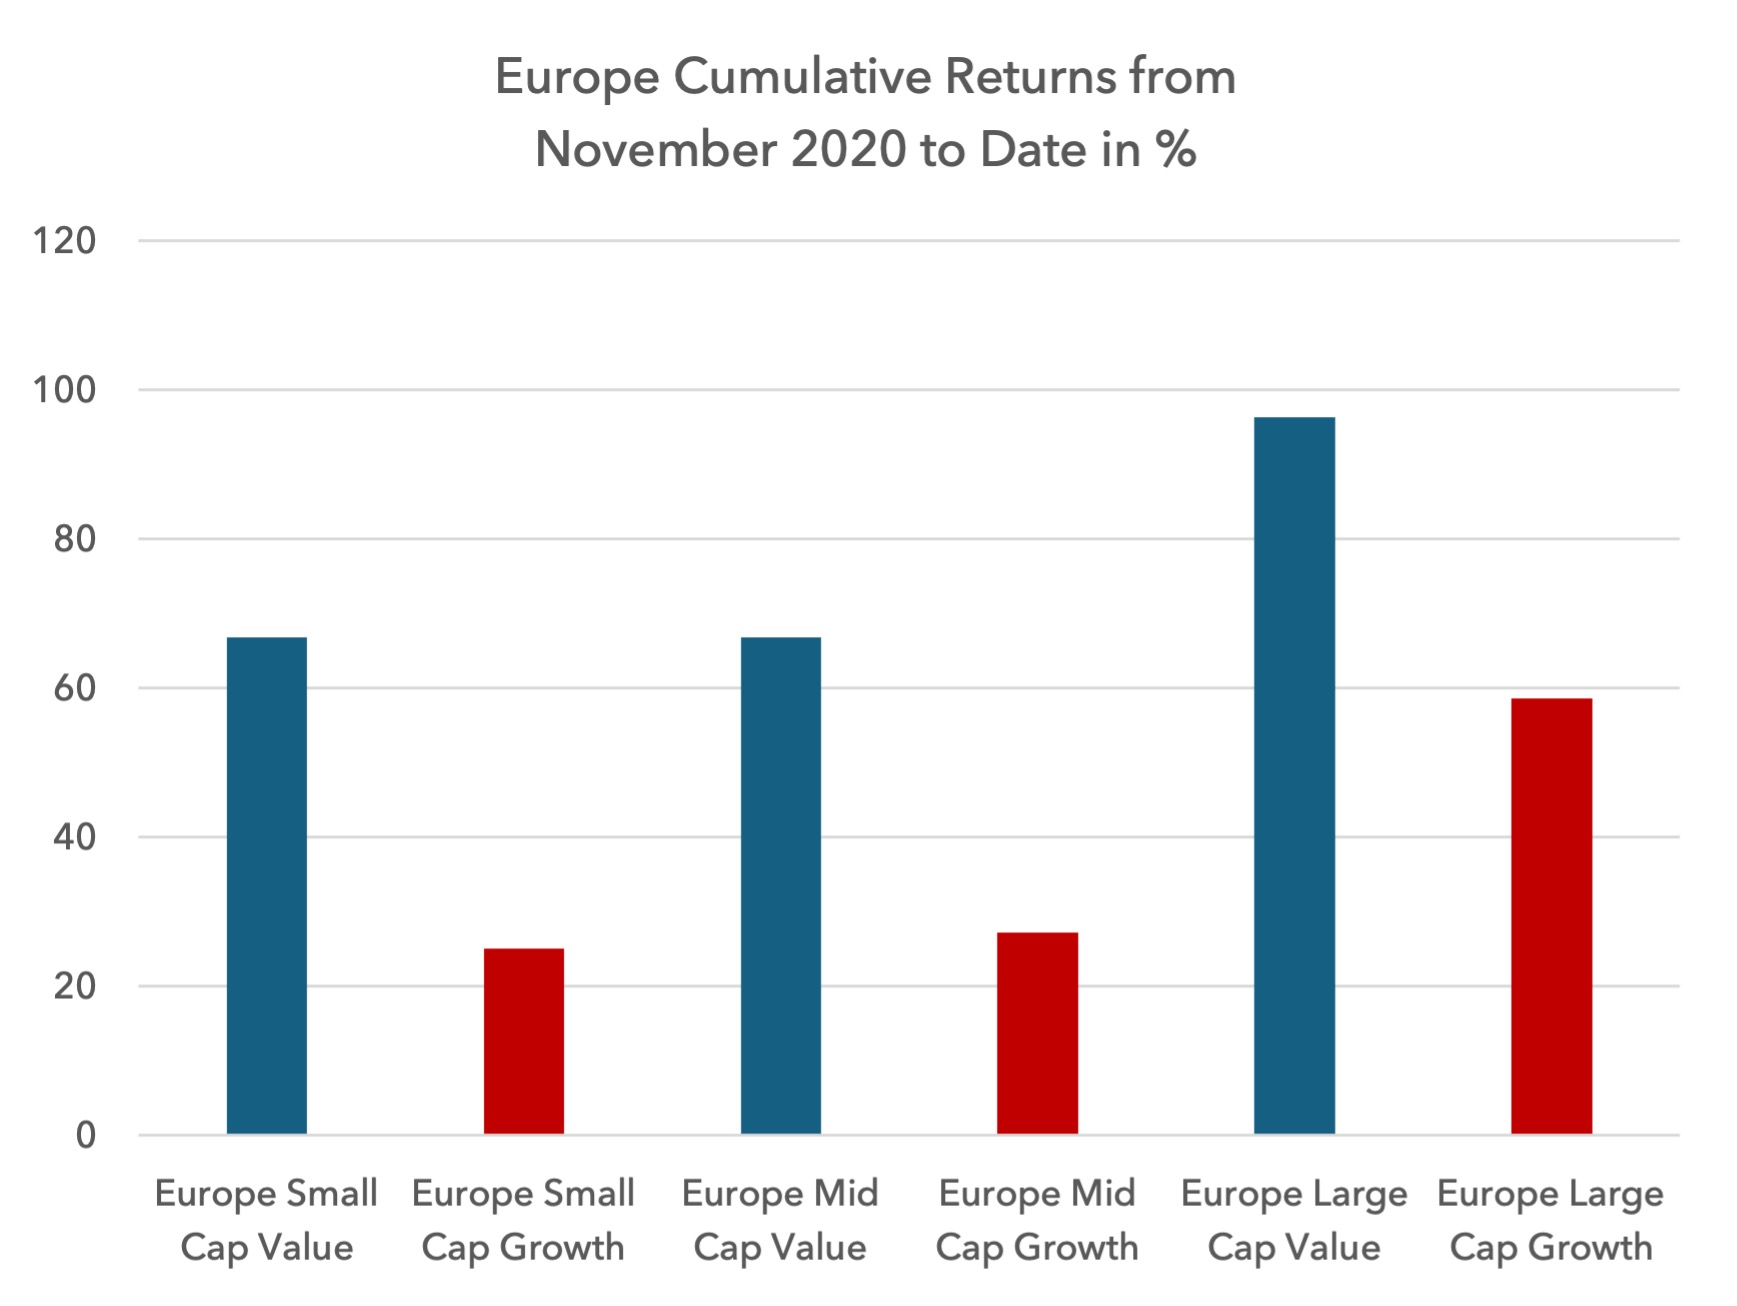
Value has exhibited equal or lower downside volatility to growth during this period, contributing to a superior Sortino ratio – or risk-adjusted return.
 Year to Date Performance
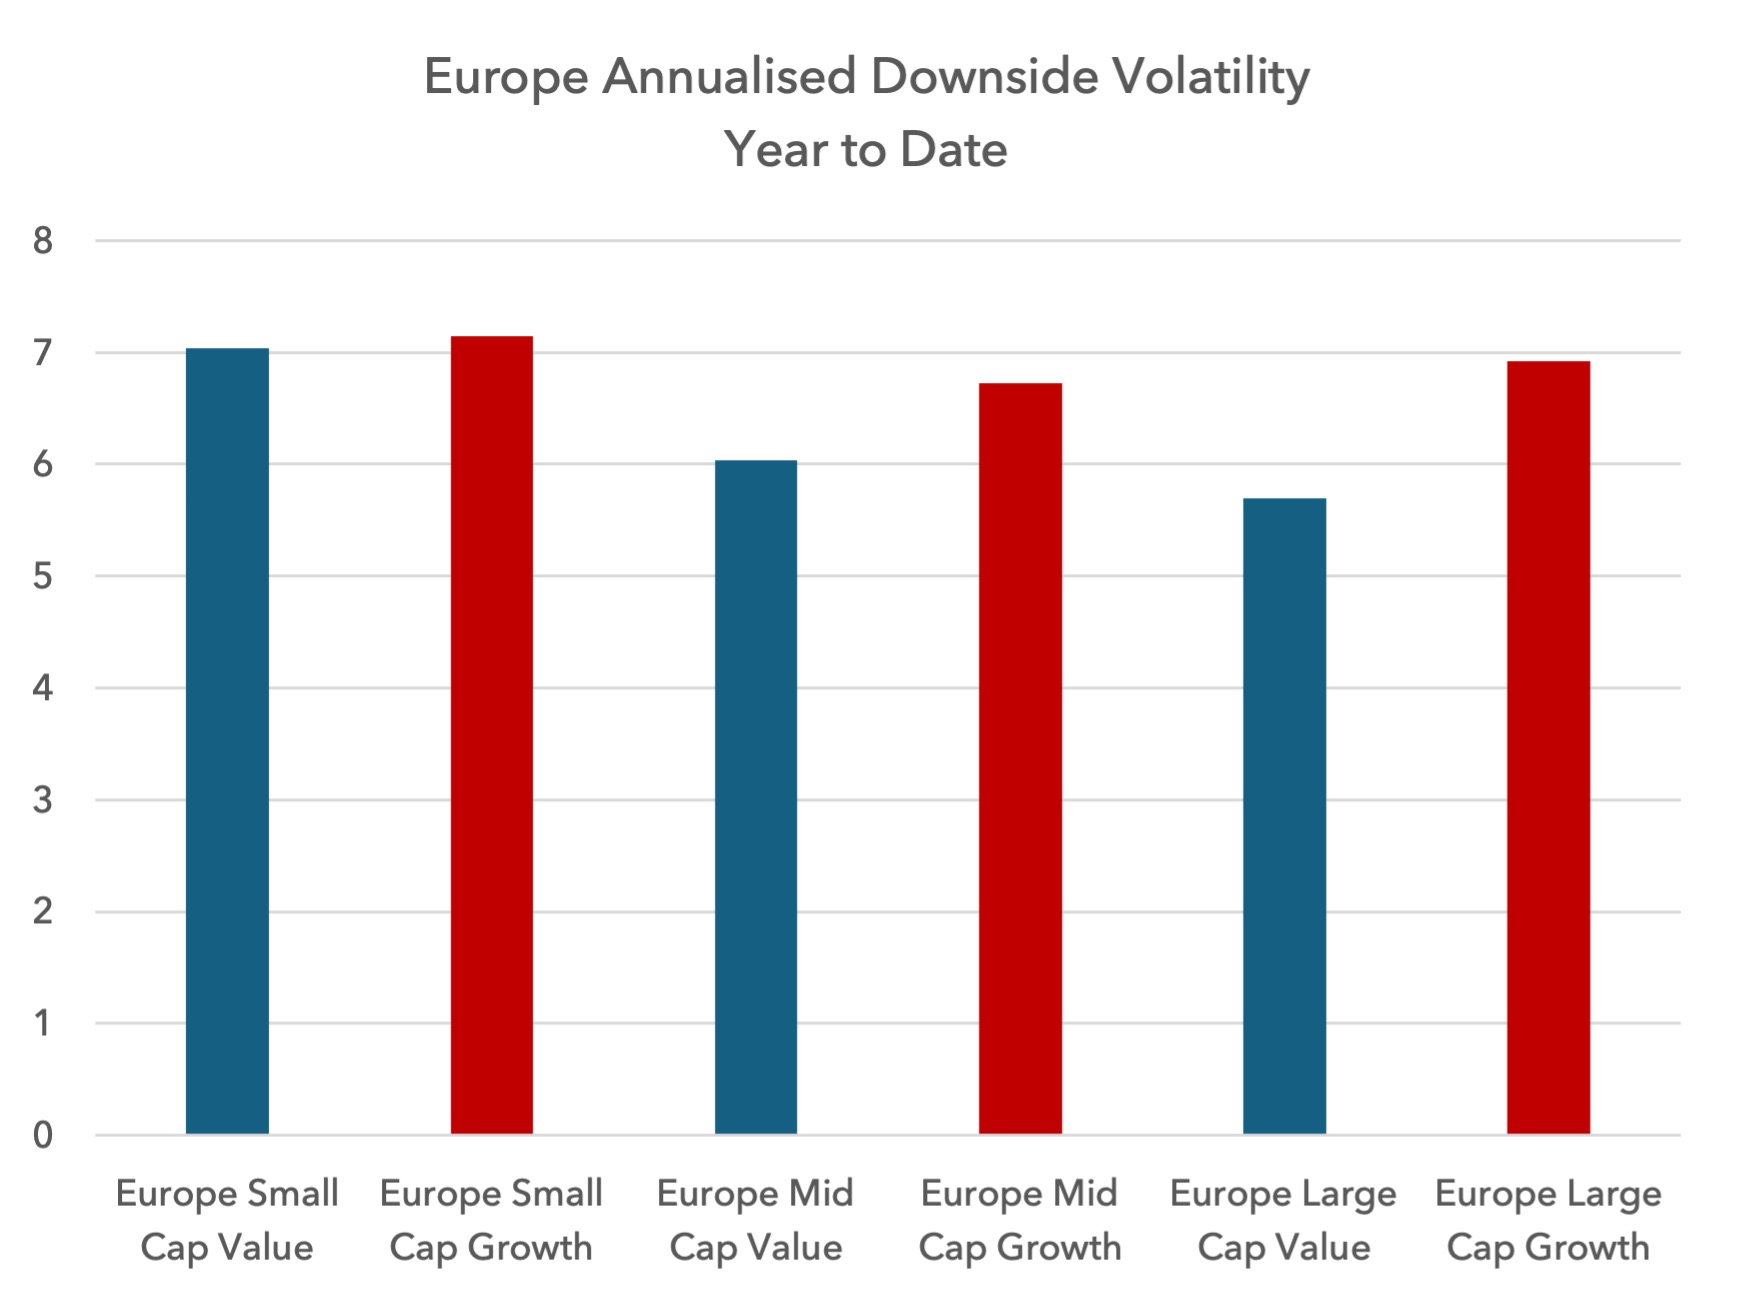
On a year to date basis, value has also outperformed in Europe, even in large caps.
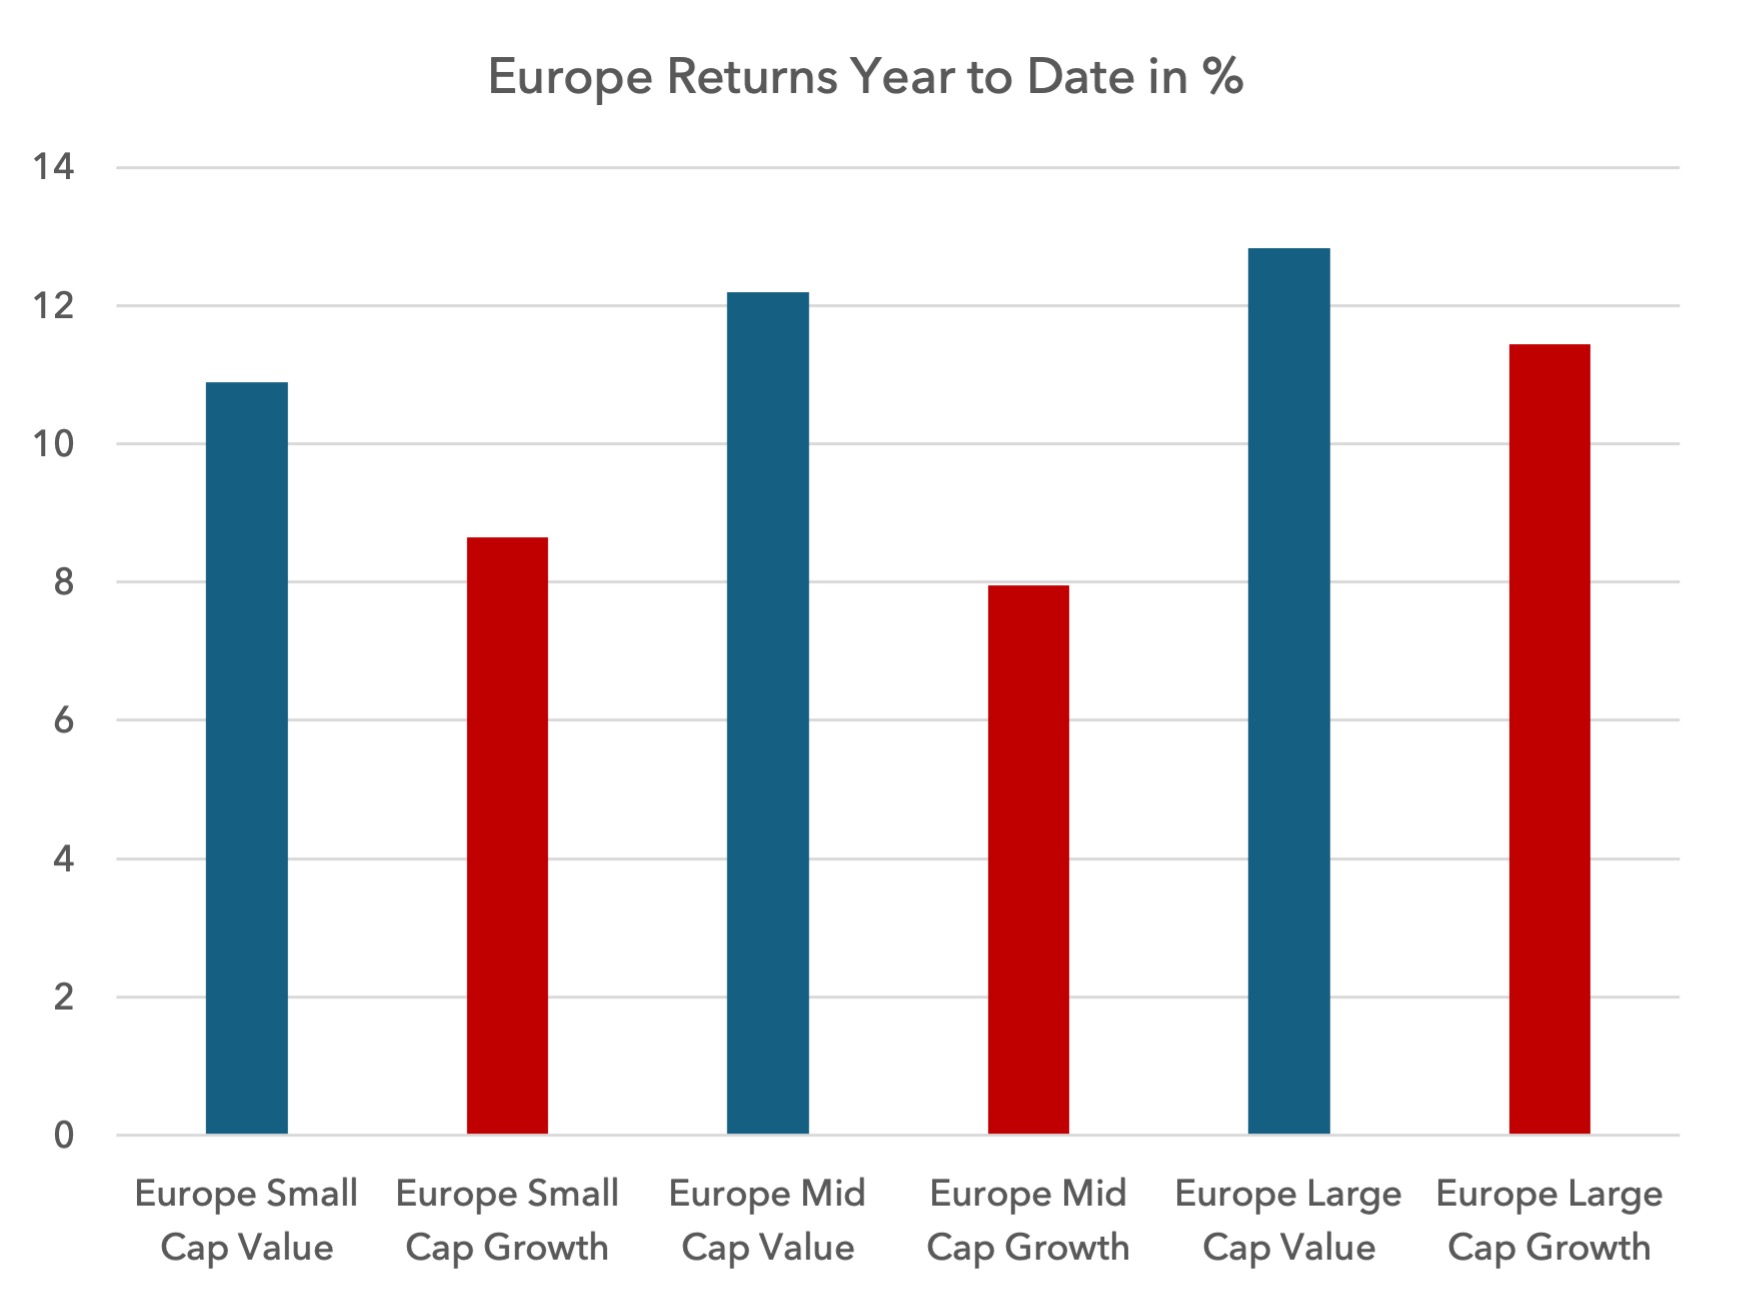 In recent months, European large-cap growth’s downside volatility has started to rise again compared to value, further weakening its risk-adjusted return profile.
 US
US
November 2020 to date
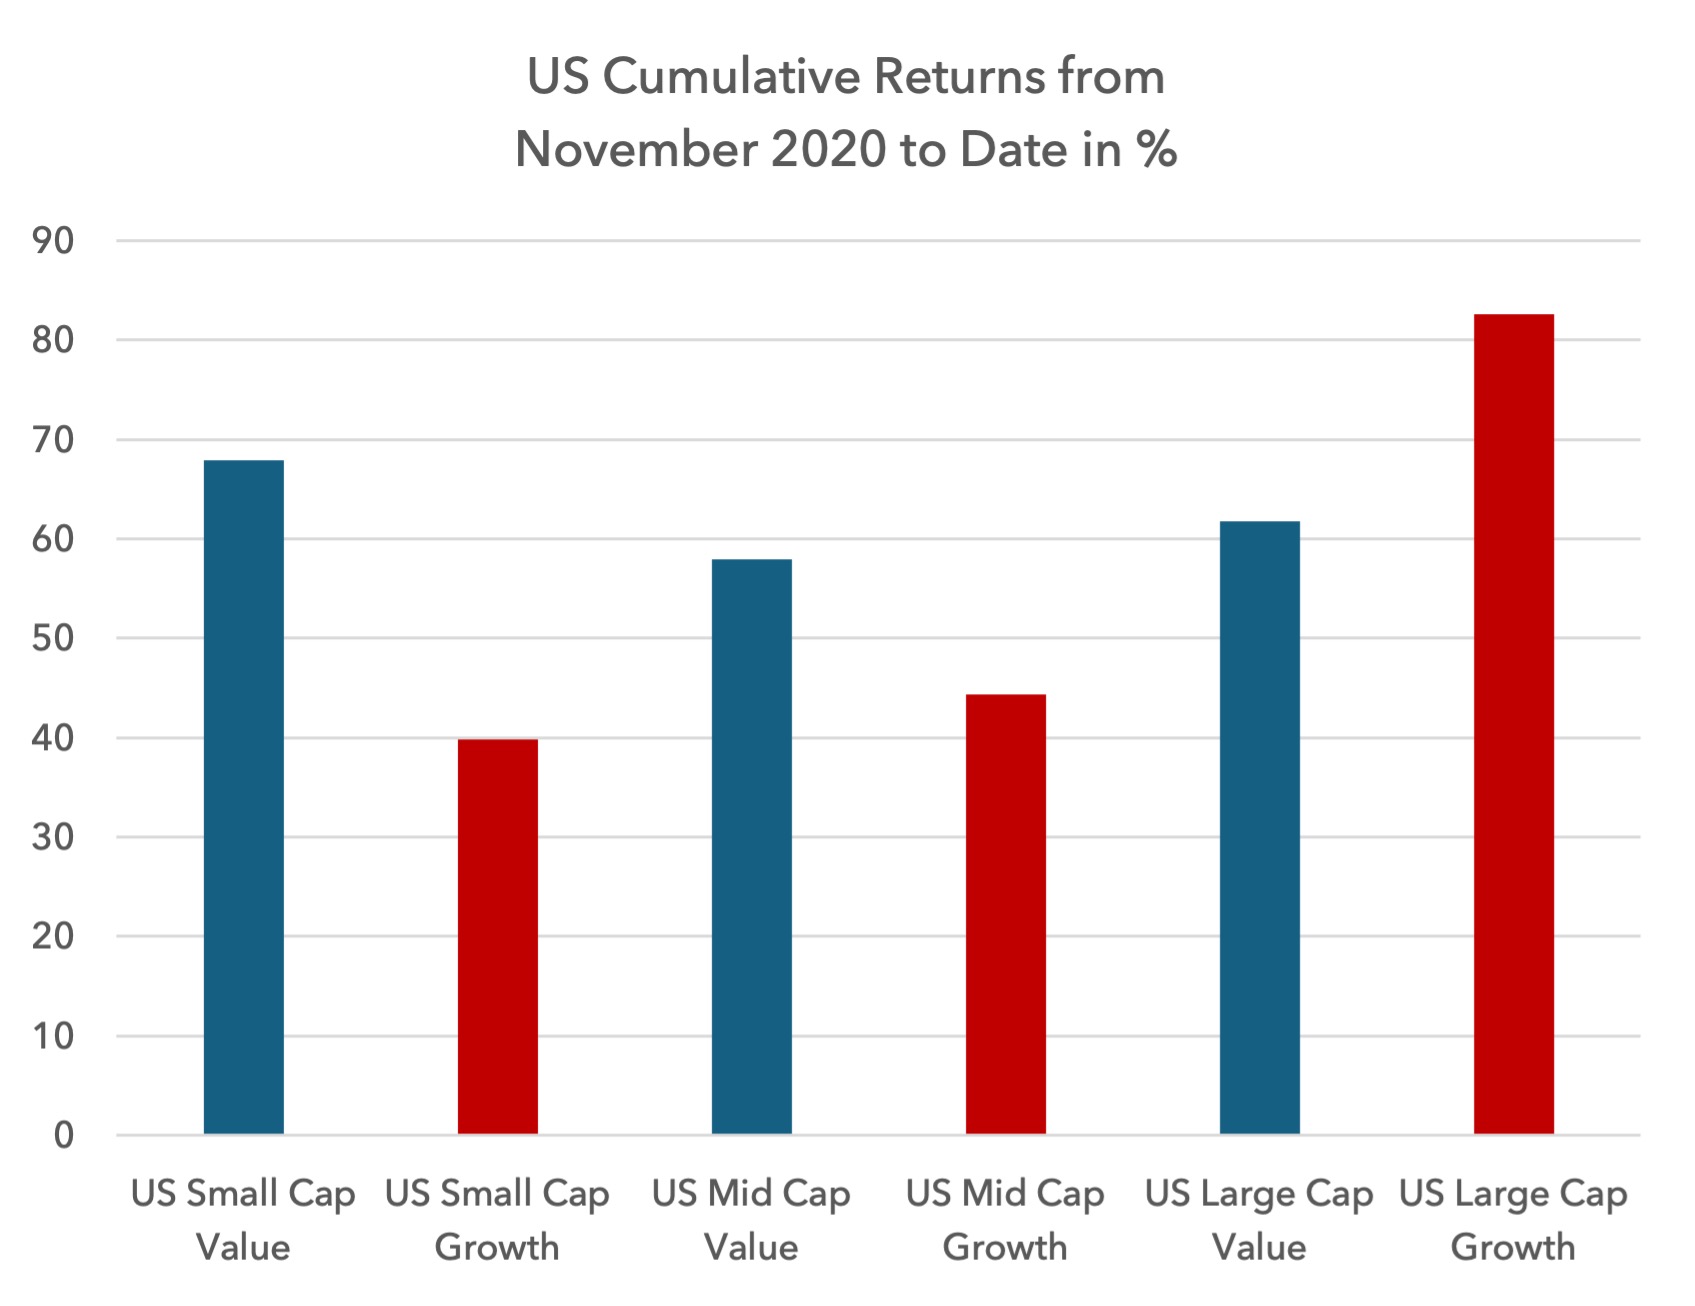
In the US, investors may be surprised to see that small and mid-cap value has been outperforming since November 2020. Large-cap value has underperformed, but perhaps by less than some may have expected.
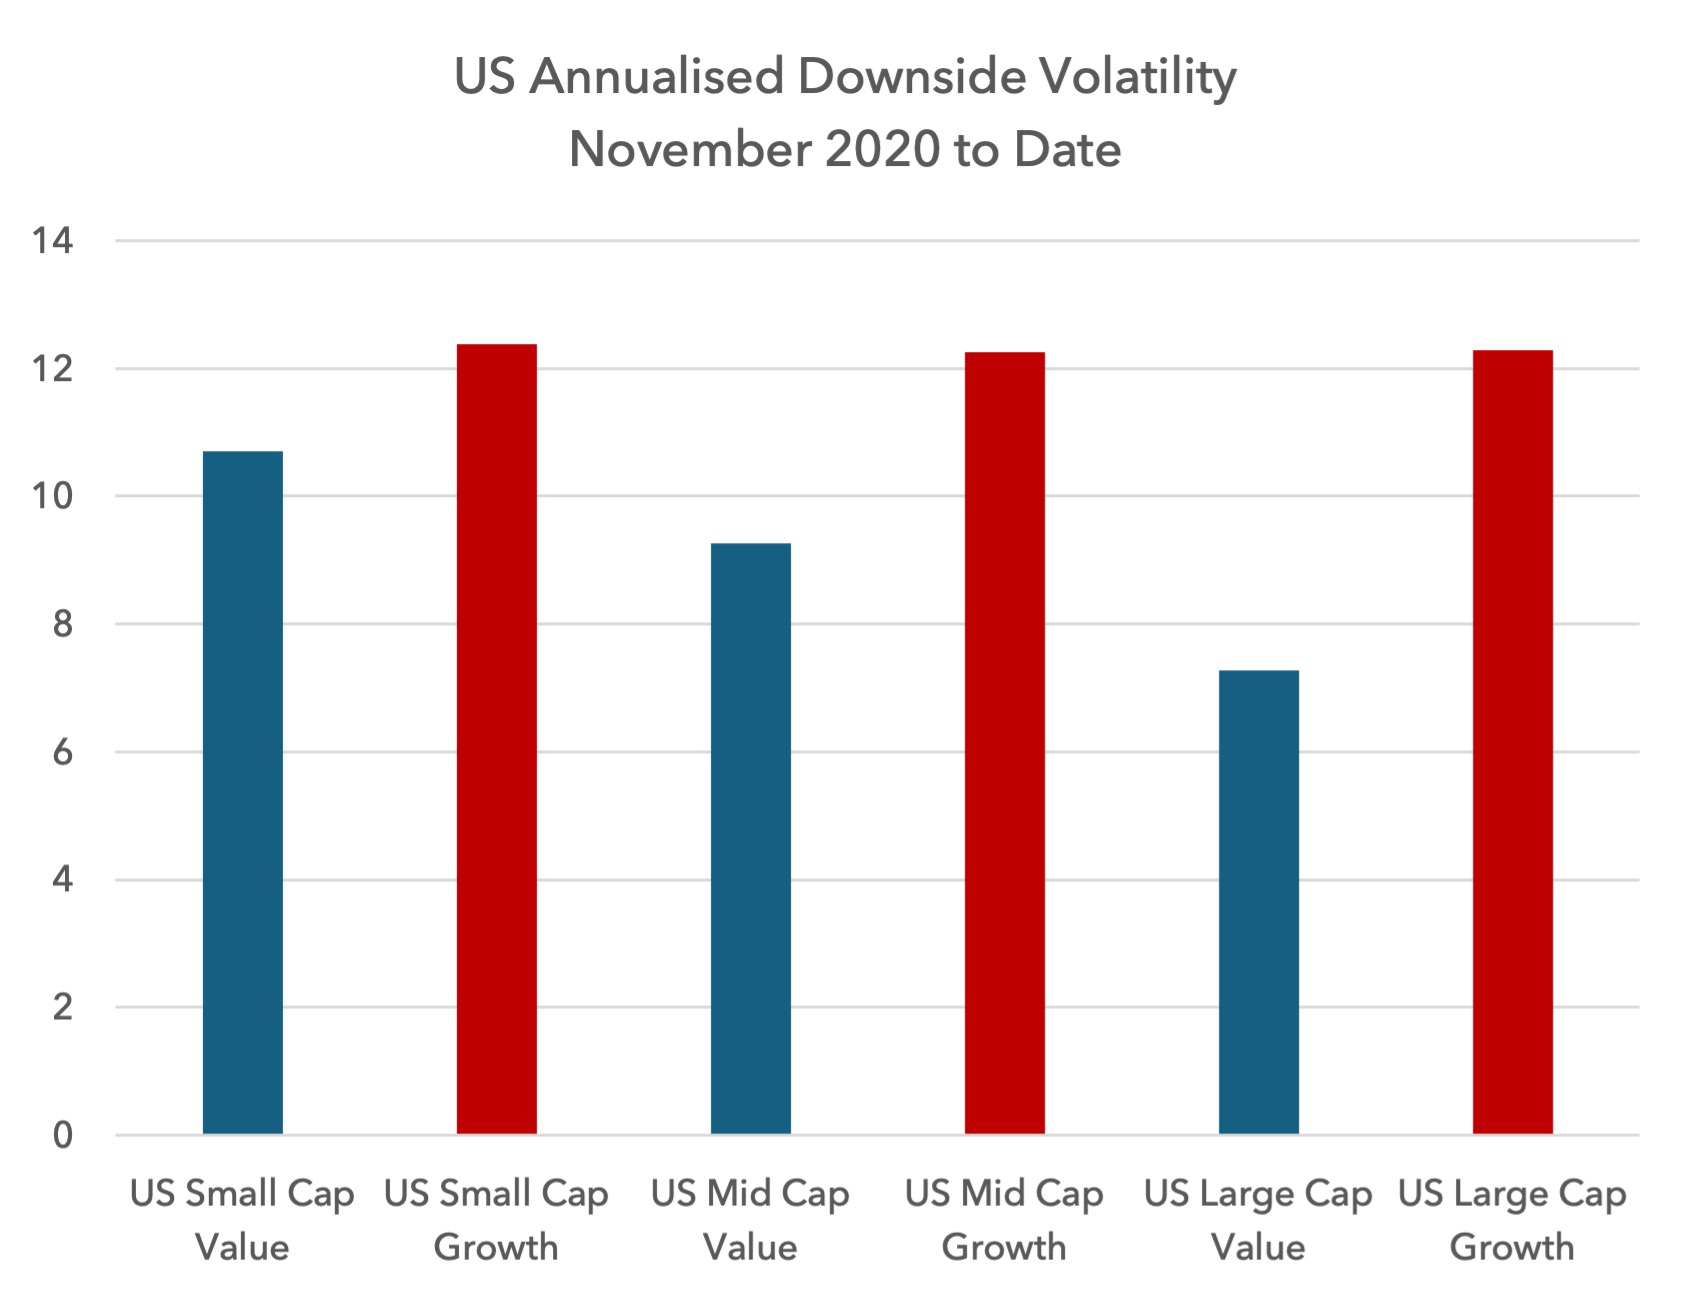
 But the real surprise is in the downside volatility, which is far higher for US growth equities than US value equities in recent years.
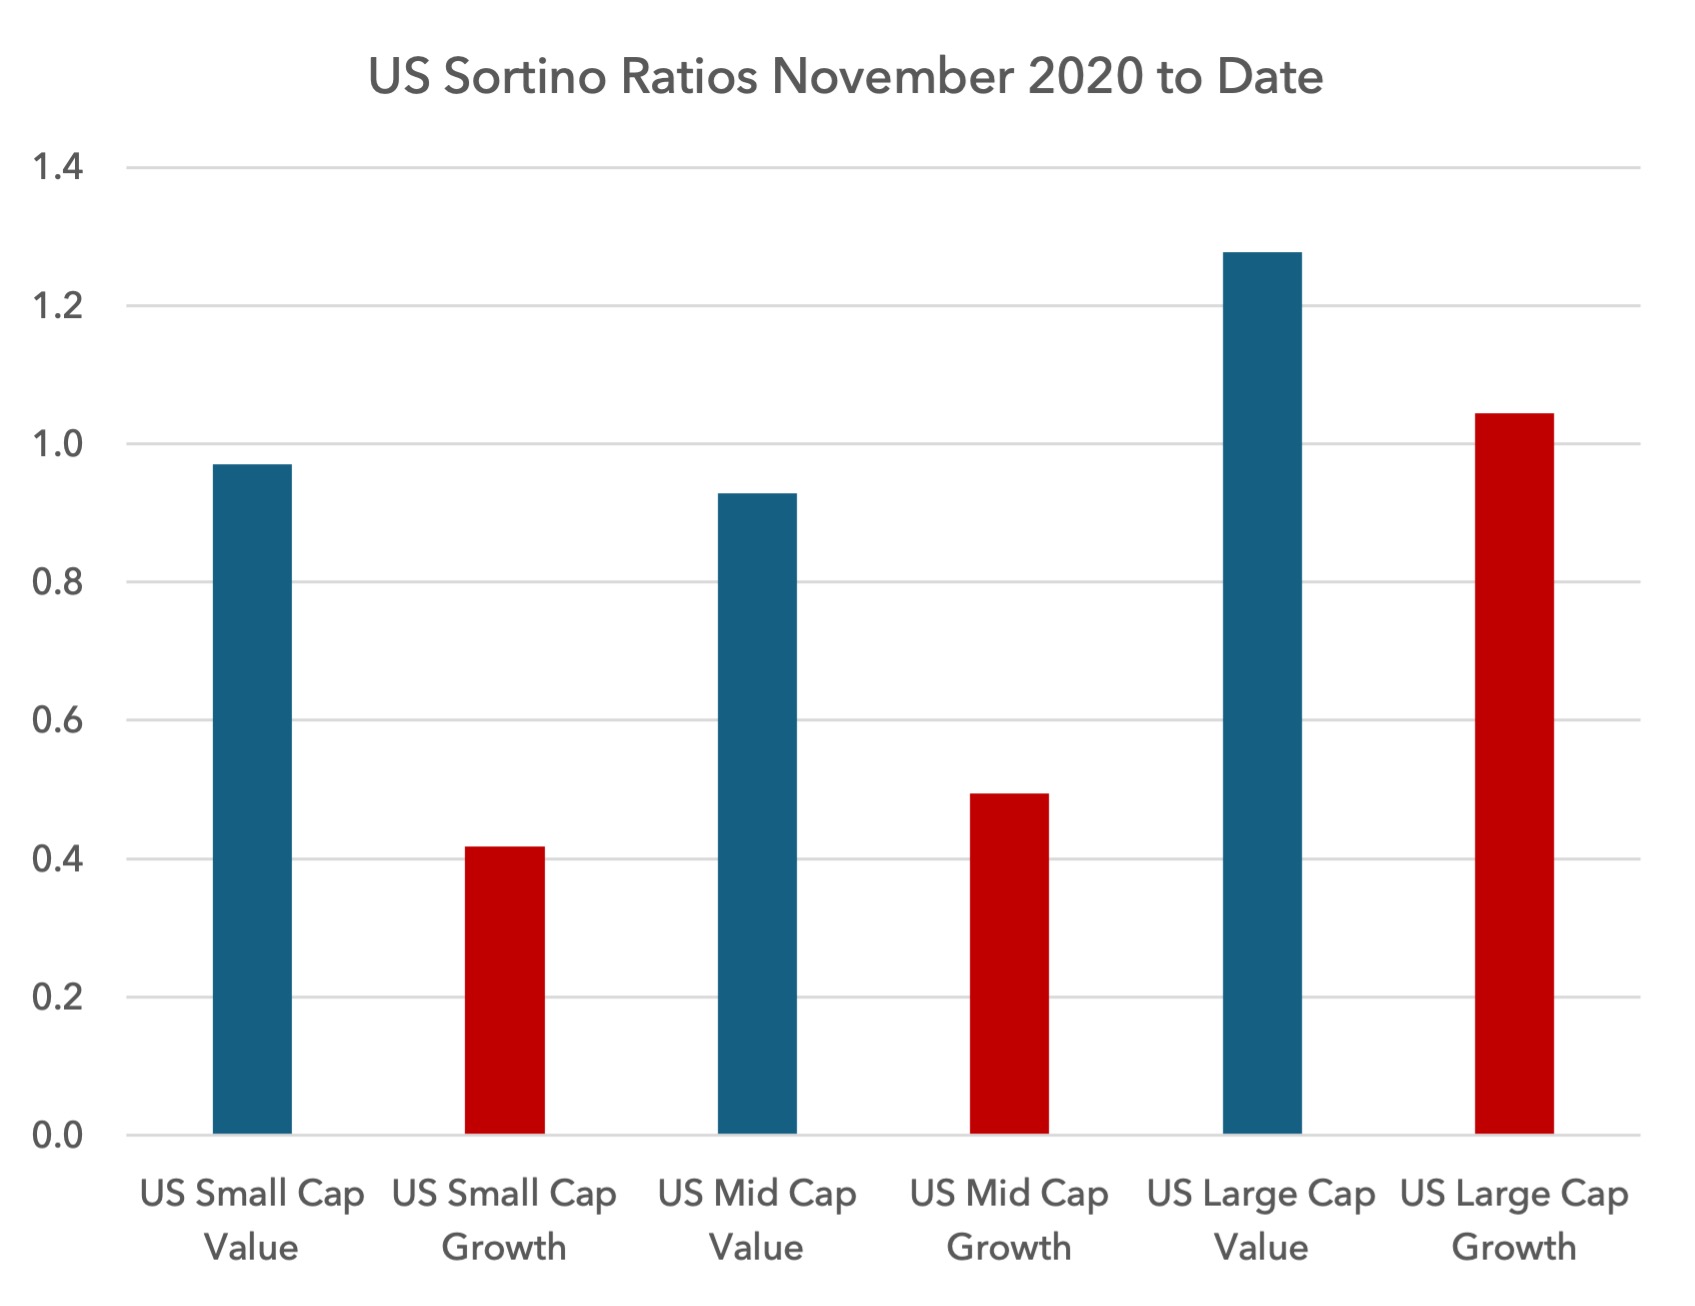
 This has resulted in value posting a superior Sortino ratio even in large caps, from November 2020 to date.
 Year to Date Performance
On a year to date basis in the US, growth has outperformed in small caps and large caps.
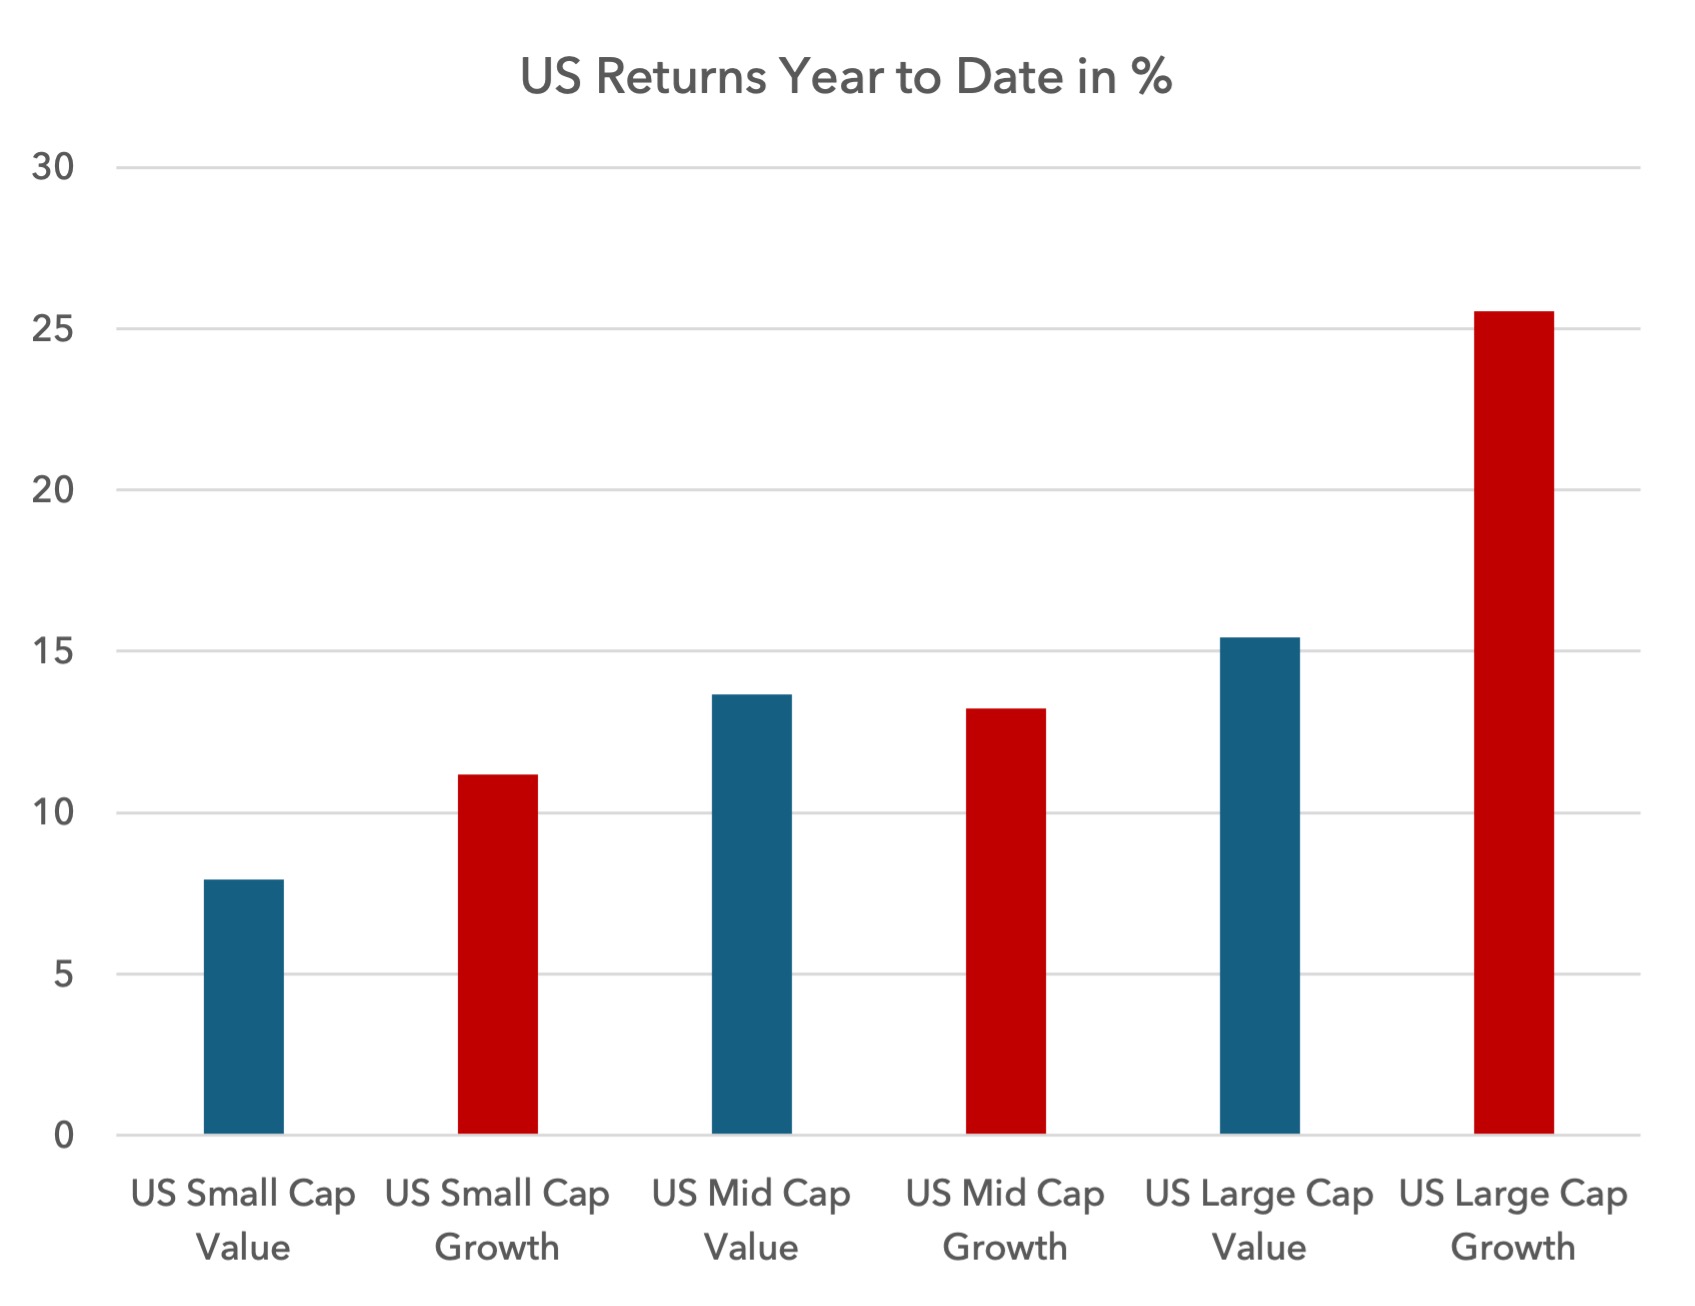 But once more, growth equities are seeing much higher downside volatility than value this year, especially in large caps. This is resulting in superior risk-adjusted returns for US value over US growth in 2024.
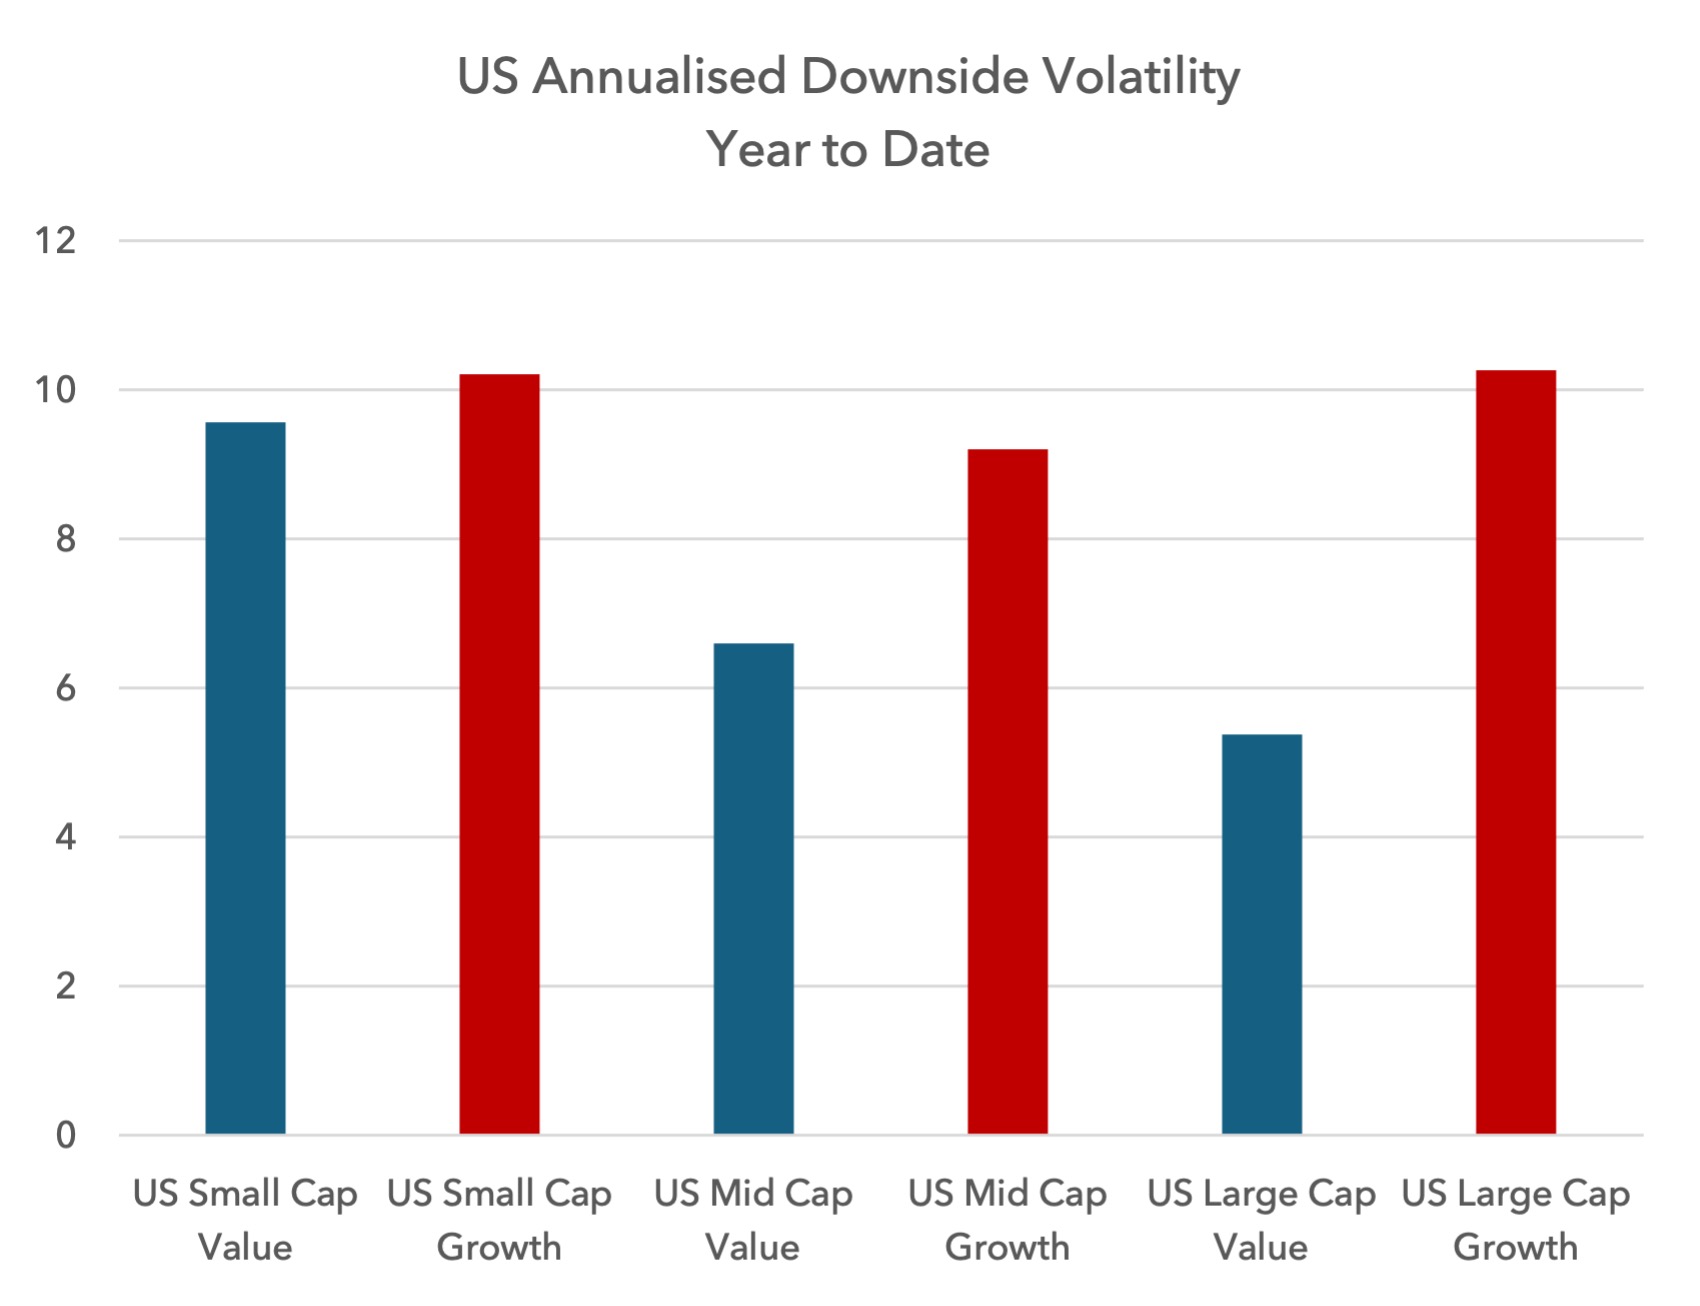 Downside volatility often rises before absolute price declines, and so this volatility from US growth equities is noteworthy. Whilst we cannot be sure that this relationship will hold in this circumstance, it is an important counterweight to the argument that US mega-cap growth stocks are a safe haven. The stock market’s behaviour under the surface is suggesting otherwise.
UK
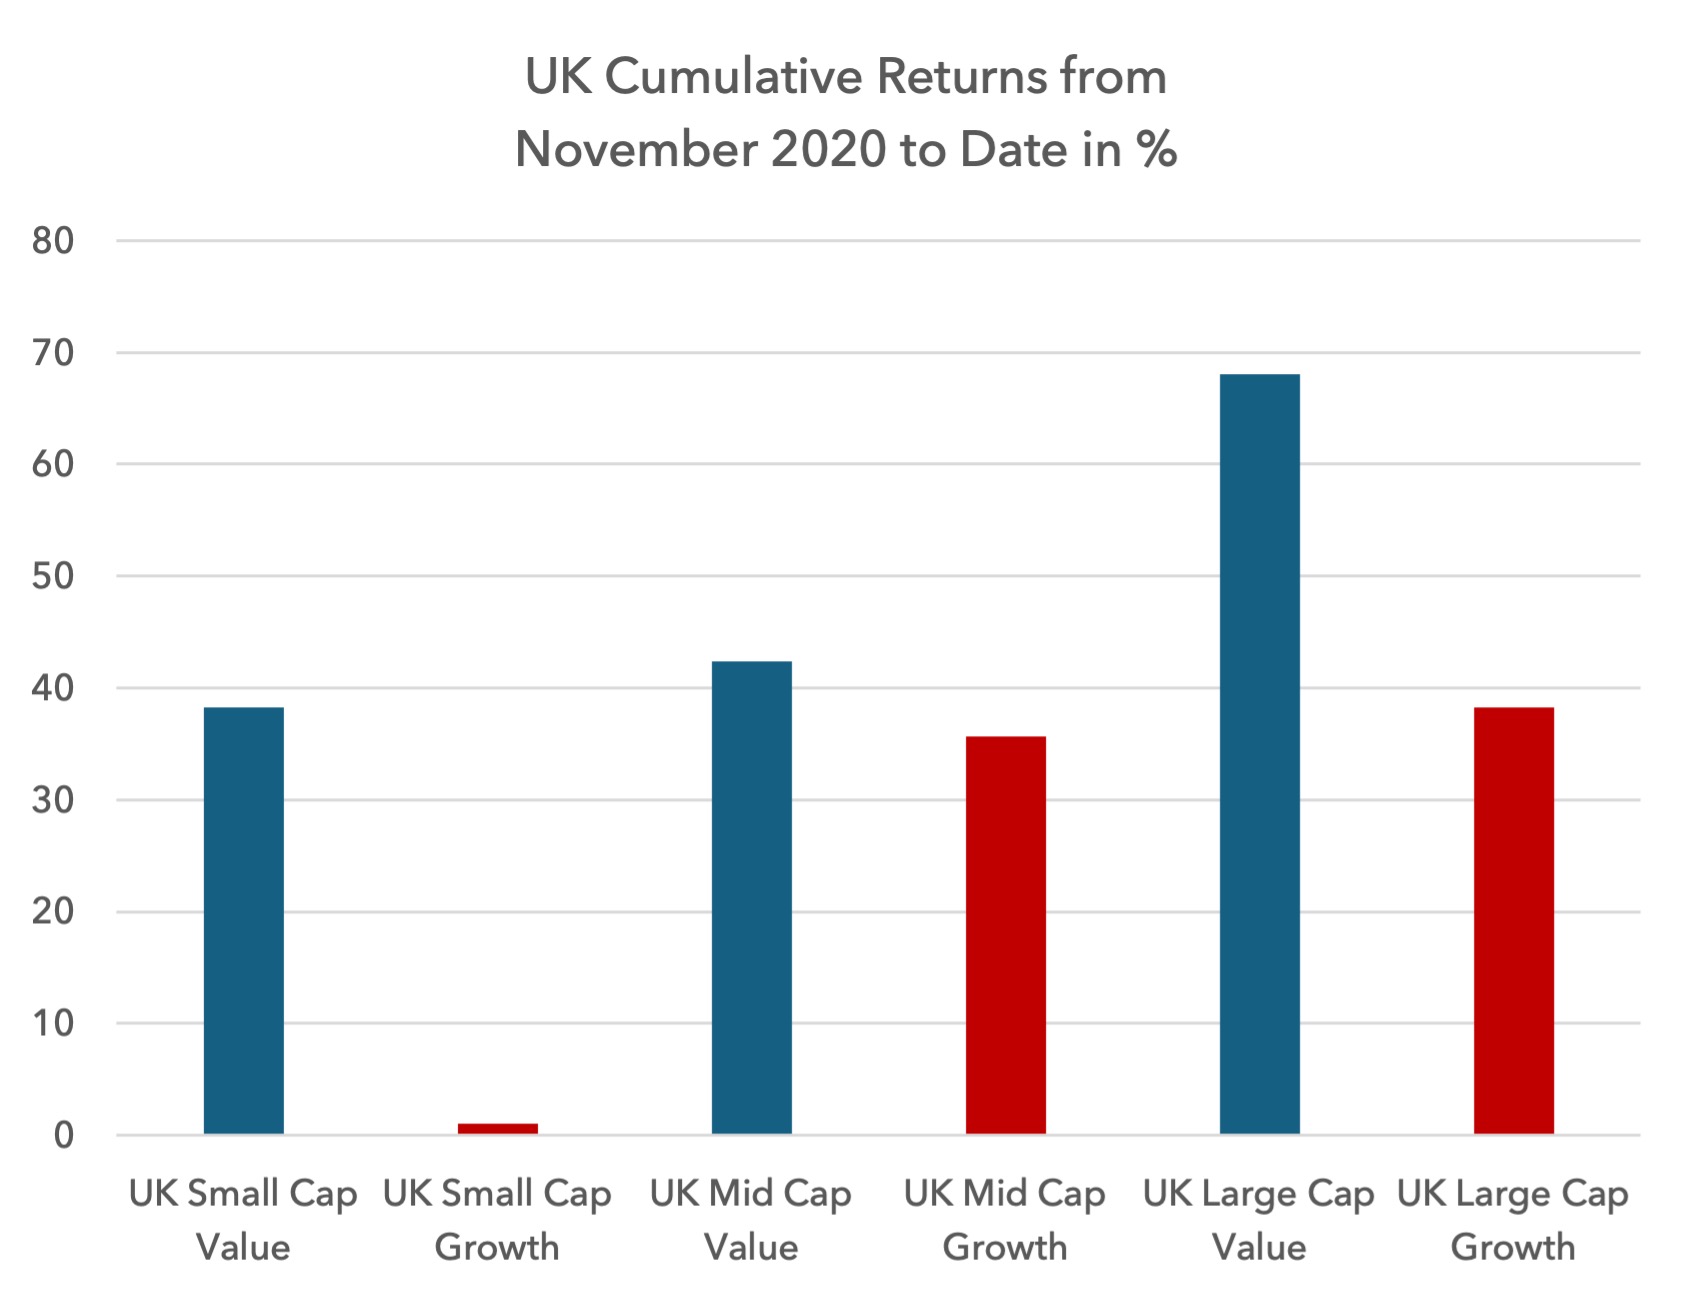
In the UK, value has been dominant over growth since November 2020.
 Year to date, large-cap value has underperformed by a small margin, whilst small and mid-cap value has outperformed.
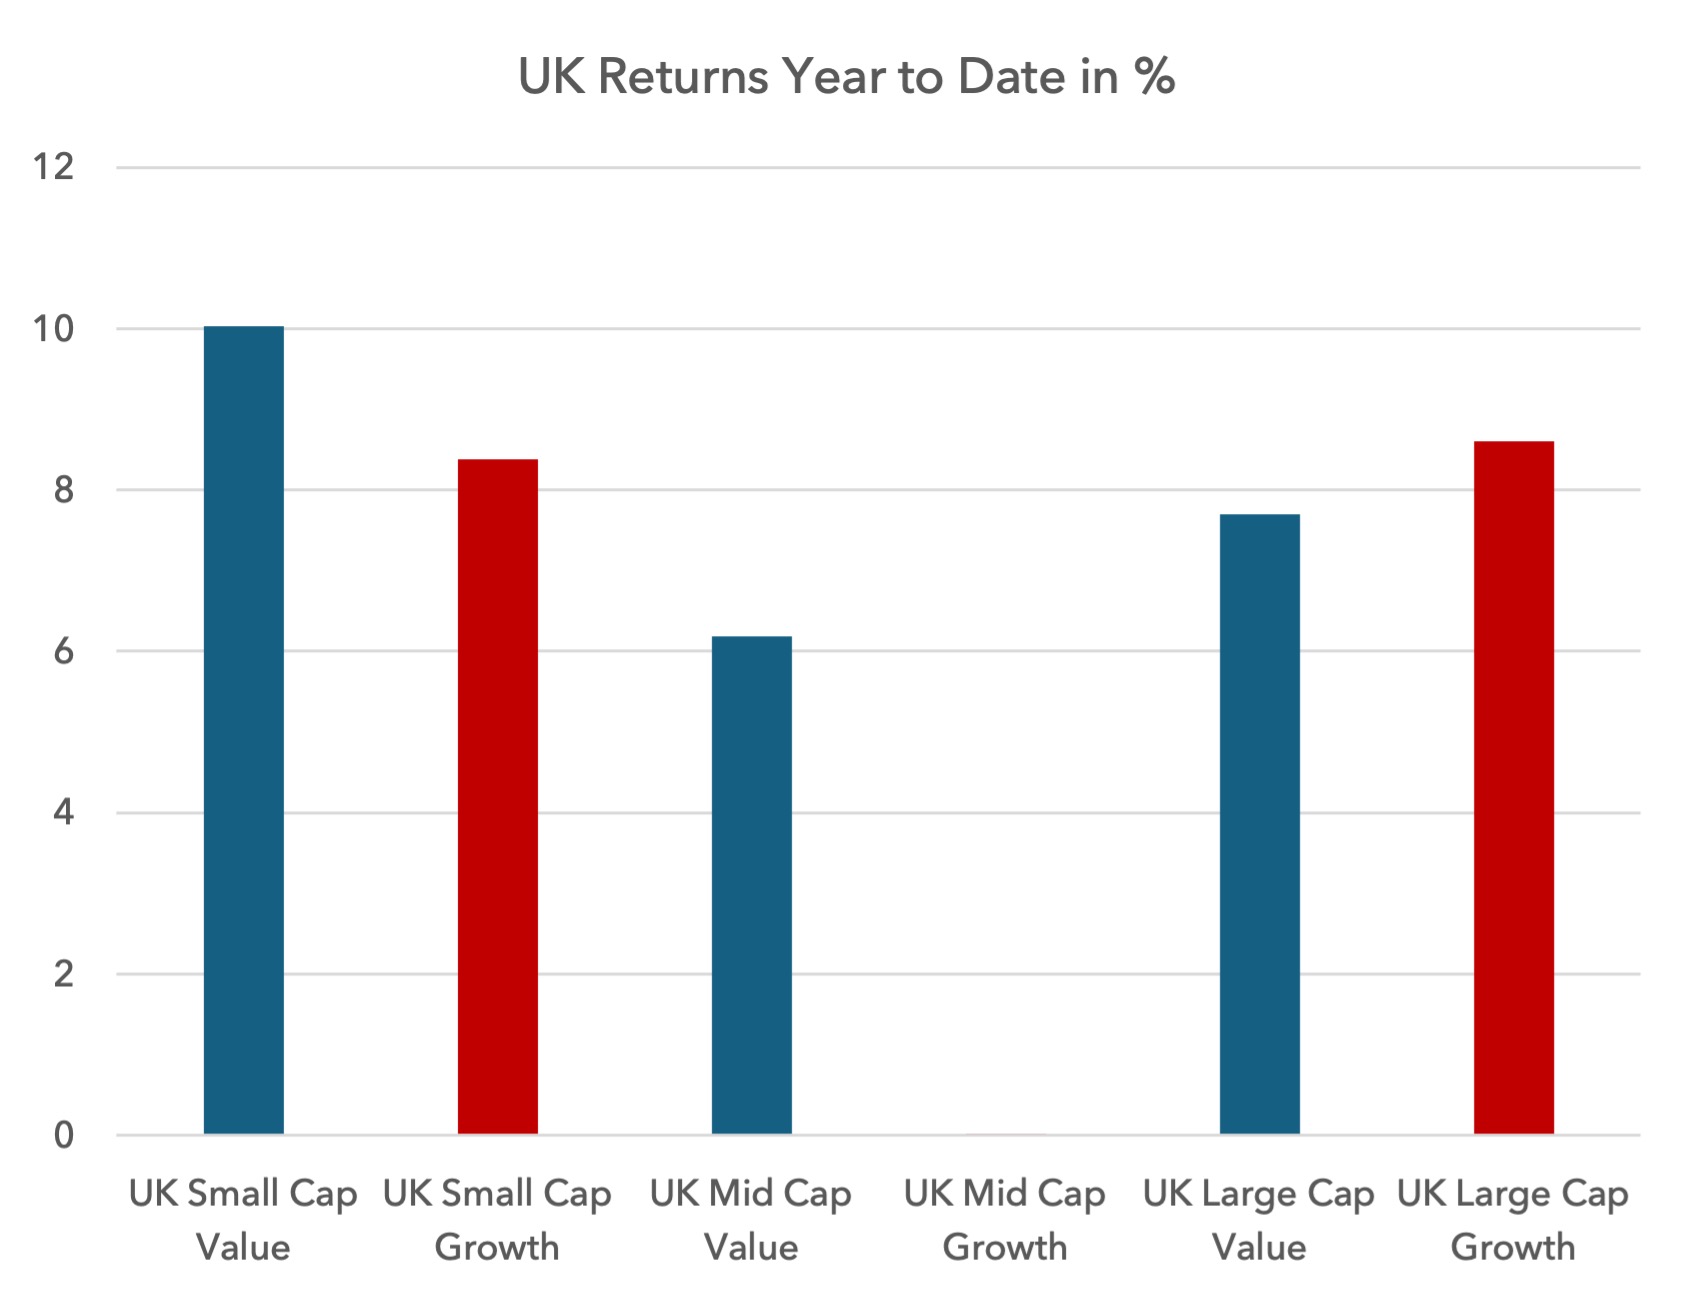 Downside volatility has not been very different between growth and value over both time periods, resulting in risk-adjusted returns that are relatively similar to the absolute returns.
Japan
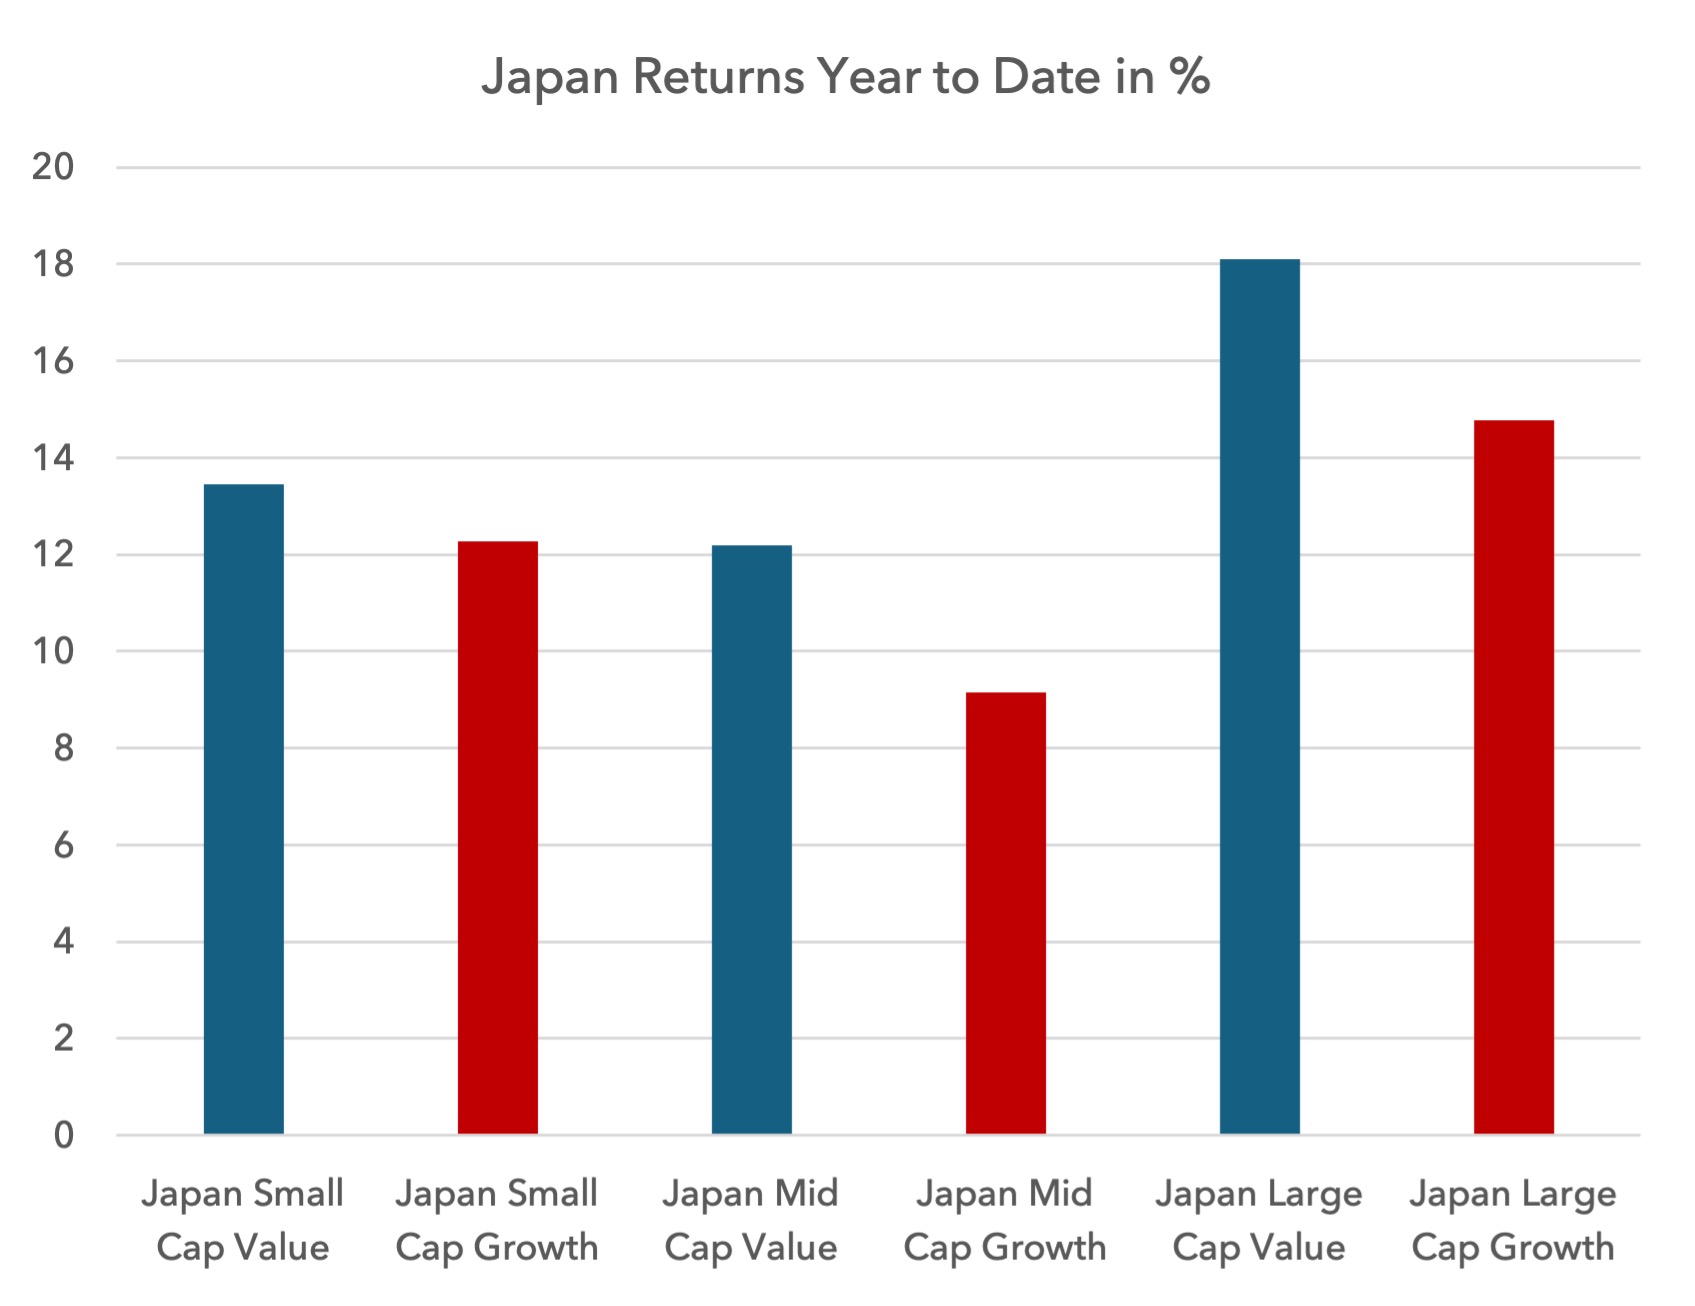
Like Europe and the UK, Japanese value has been dominant over growth since November 2020.
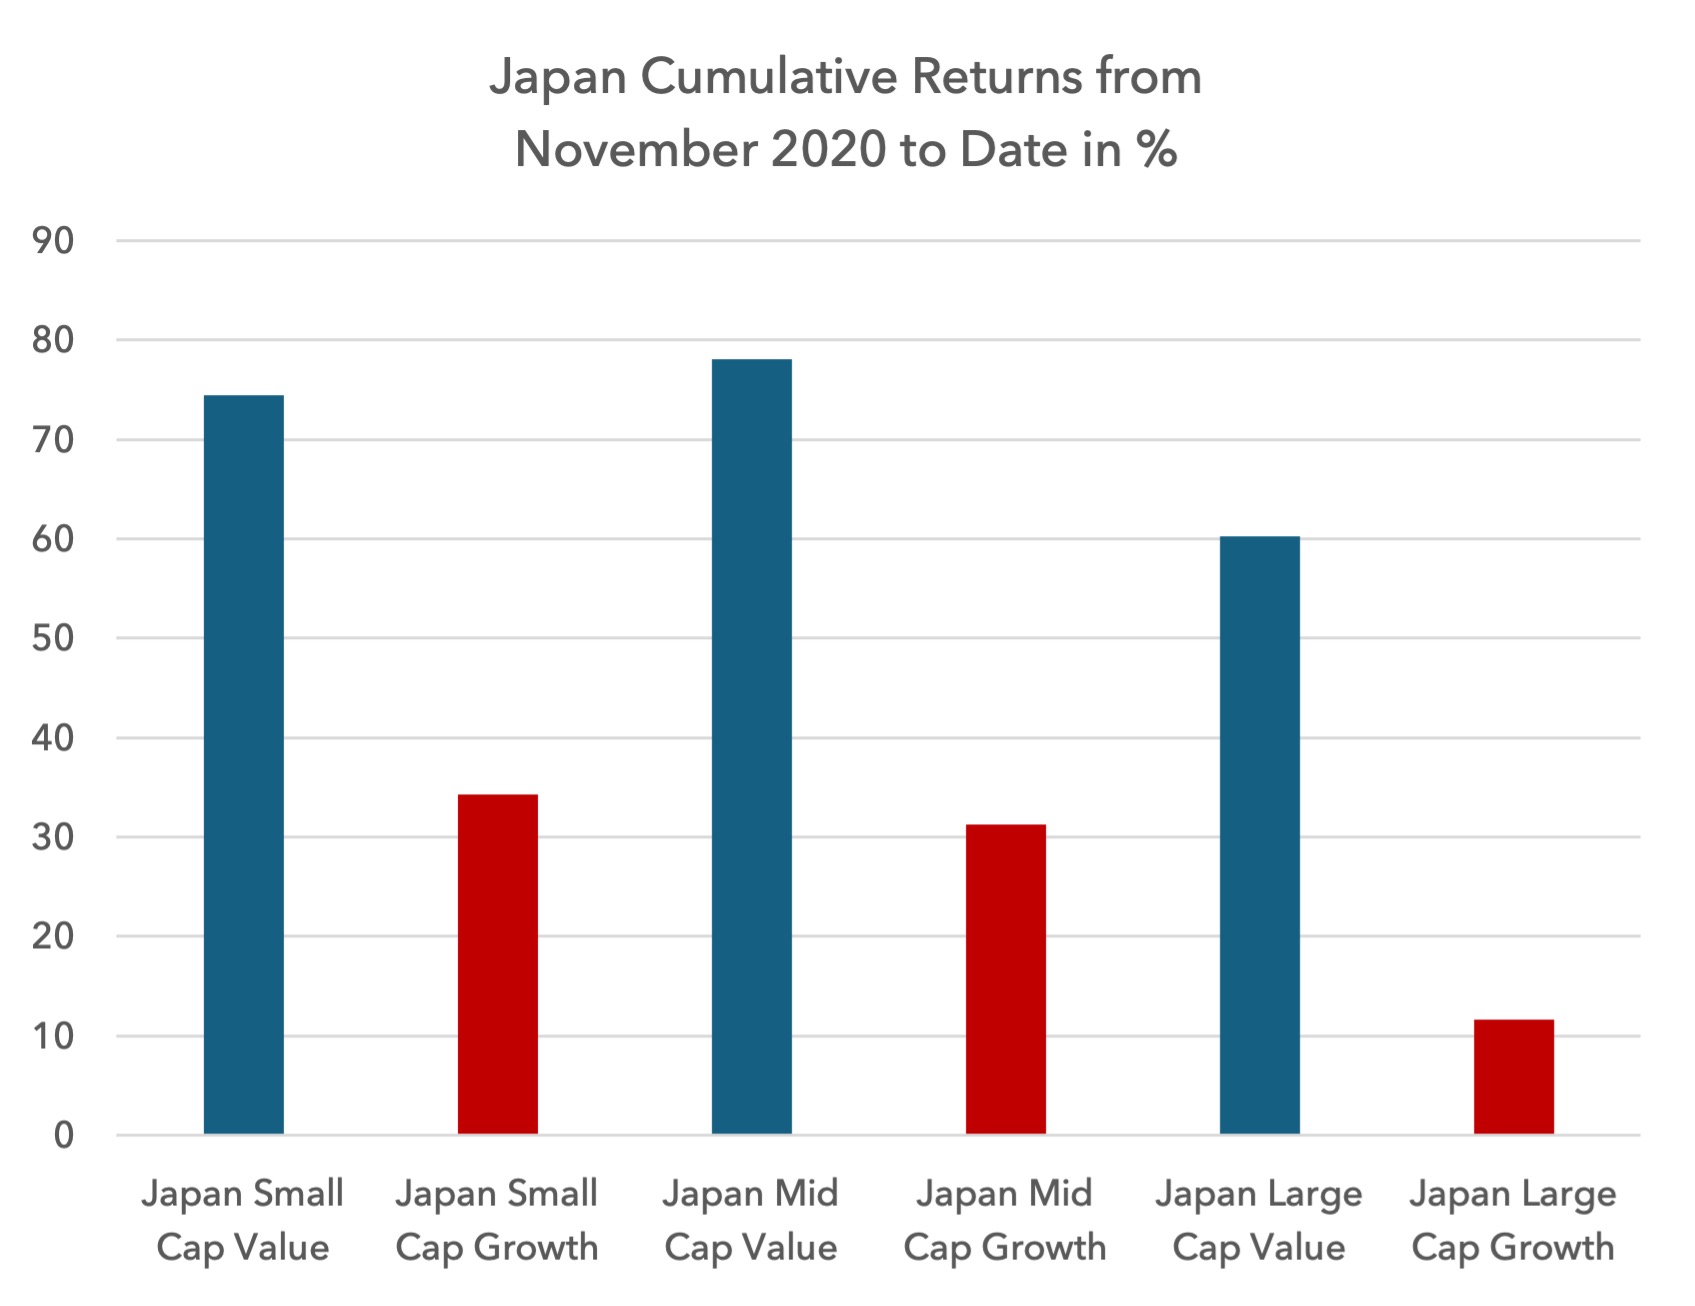 On a year to date basis, value has continued to dominate, with risk-adjusted returns better in small and large caps, but not in mid caps.
 Emerging Markets
As in the UK, Europe and Japan, Emerging Market (“EM”) value has decisively outperformed growth since November 2020.
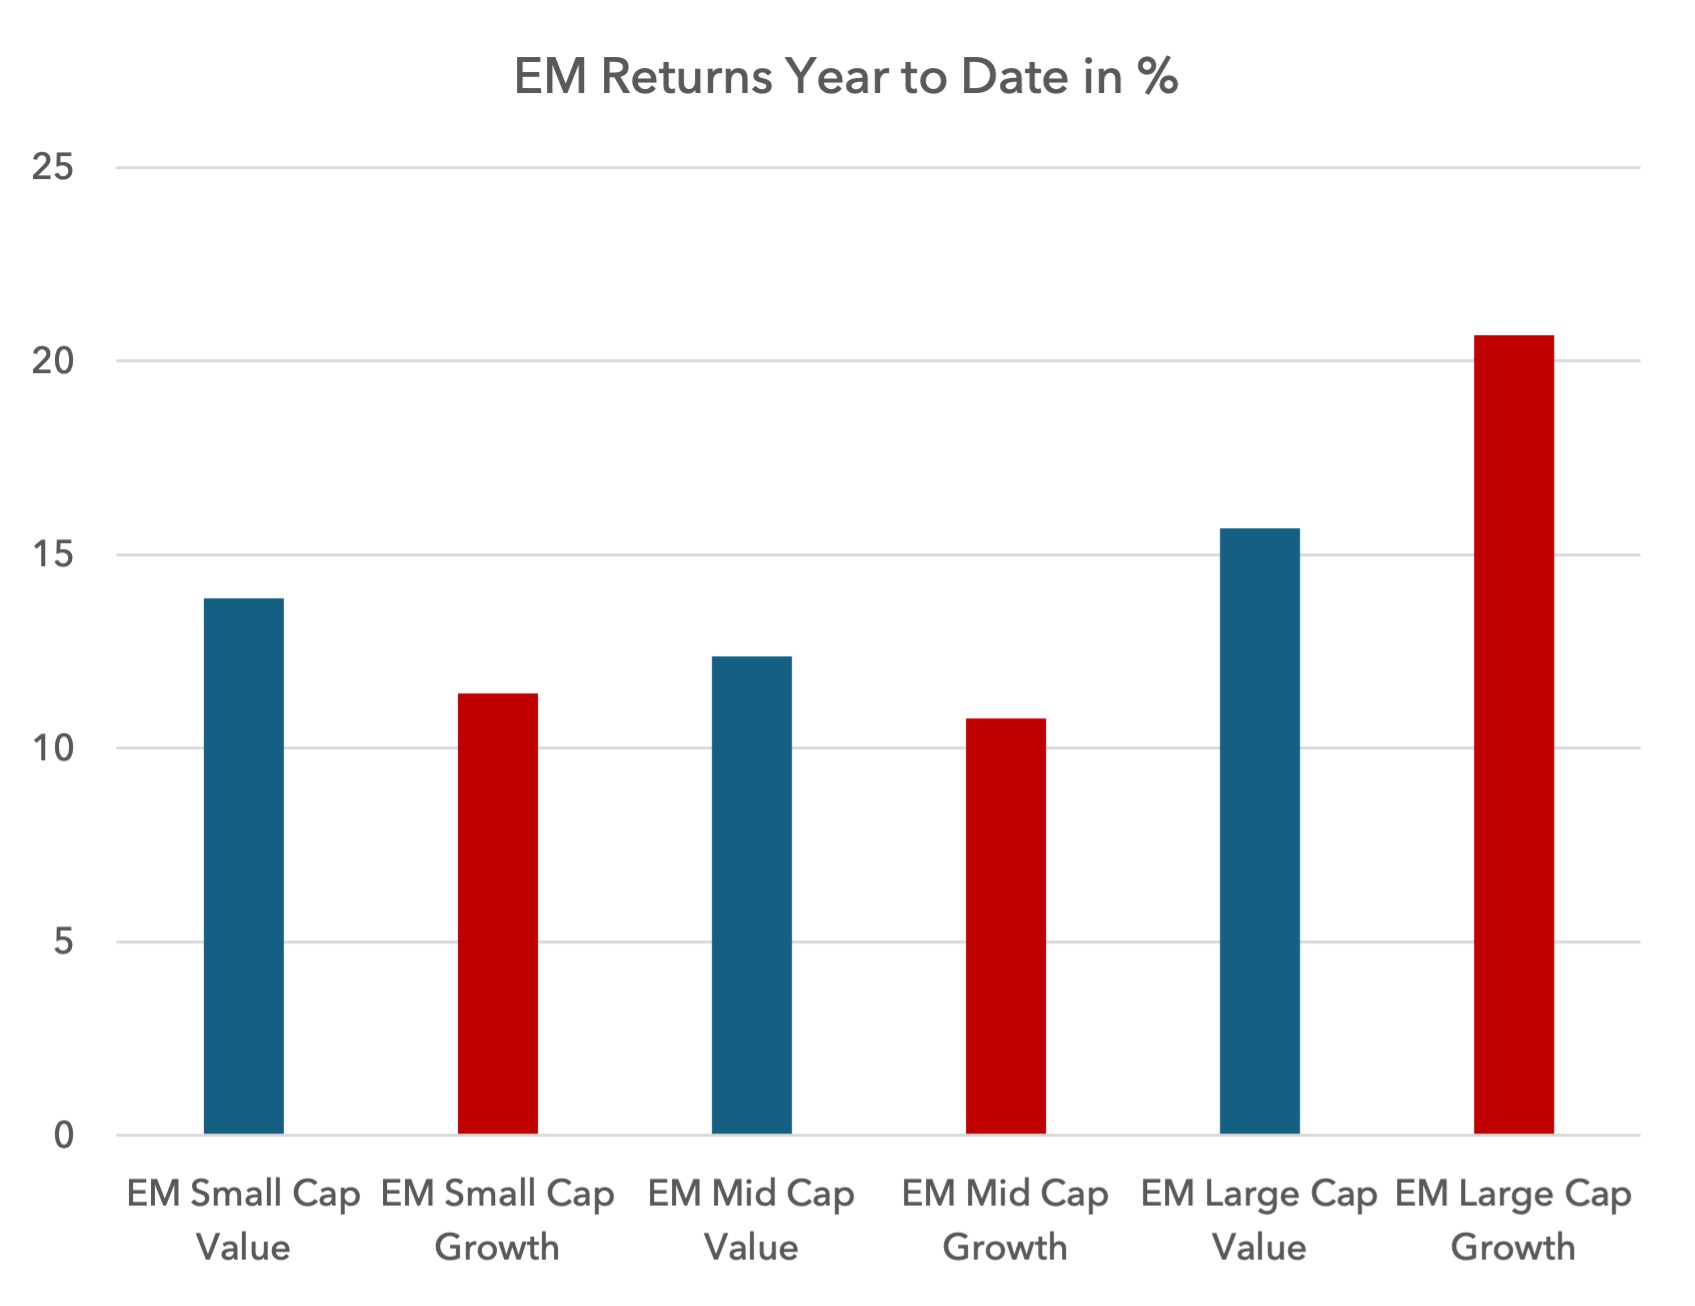
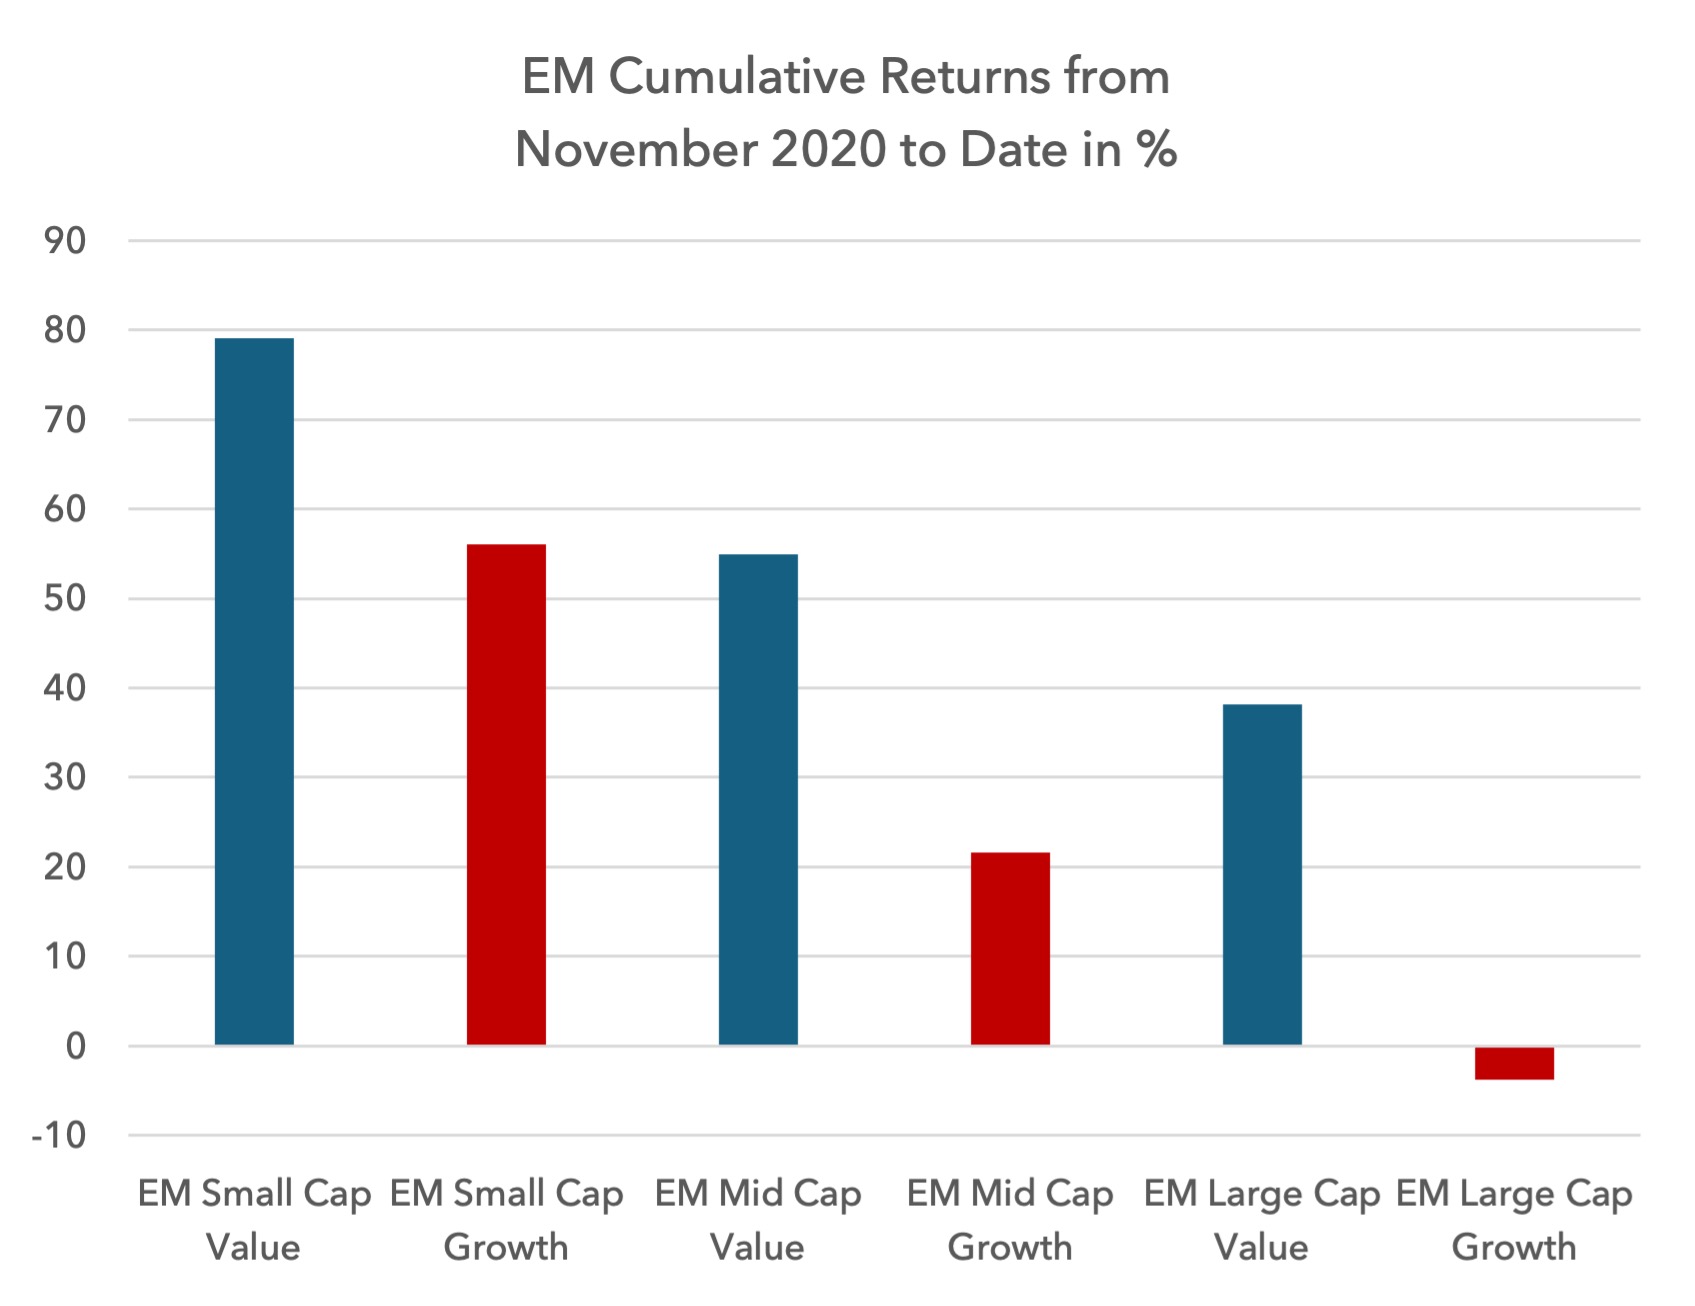 Year to date in Emerging Markets, small and mid-cap value have outperformed but not in large caps. As in the US, however, risk-adjusted returns for growth equities are broadly weaker, driven by higher downside volatility.
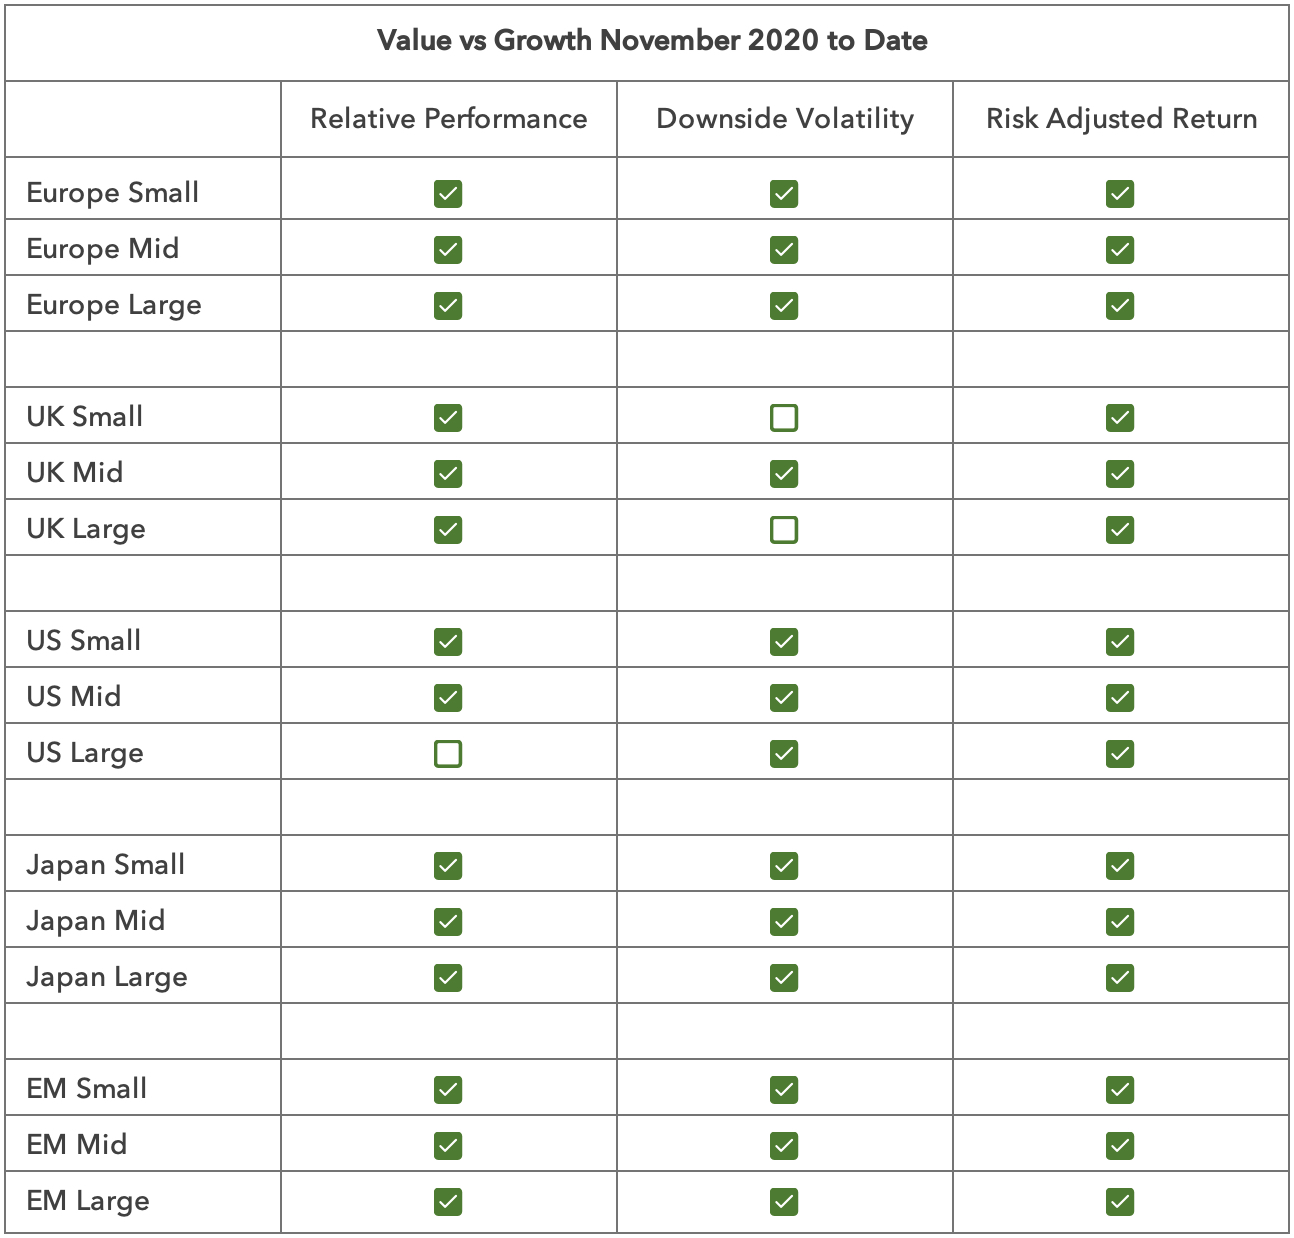
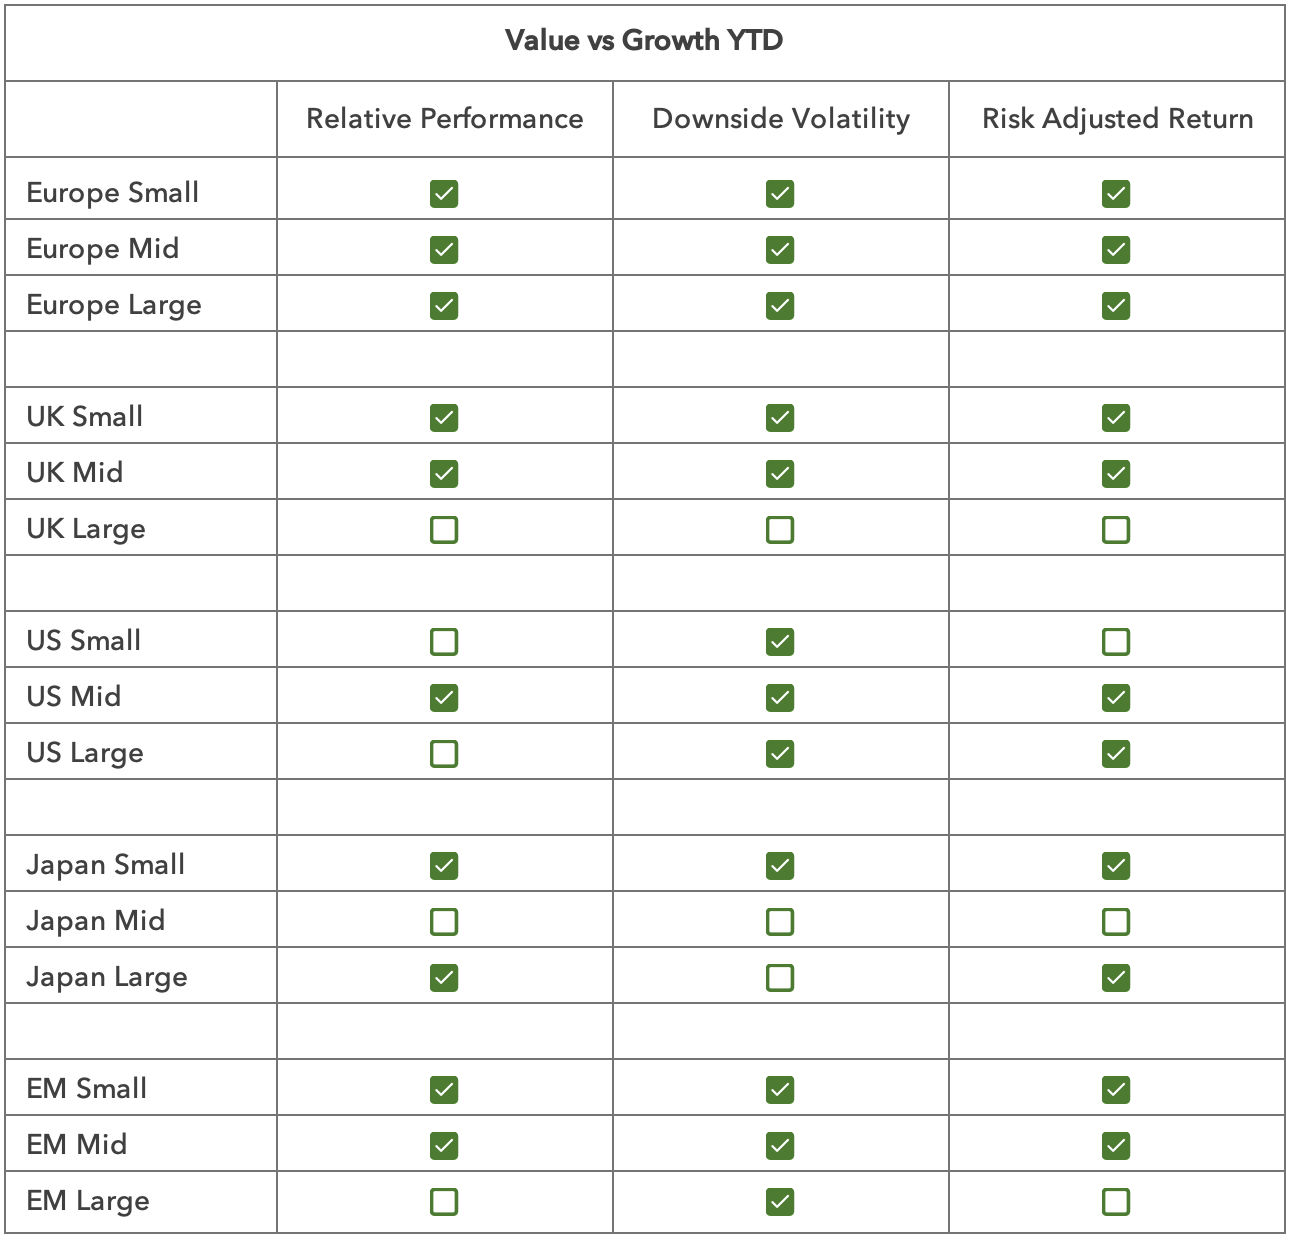
 We summarise all the data in the following two tables.
A green tick means value is outperforming growth, either in price terms or with lower downside volatility or with a better Sortino ratio.
Whilst the logic for investor allocations towards value is sound, and the long-term track record solid, investors have been nervous about the timing. Value had a tough decade from 2010 to 2020, and this has cast a long shadow, resulting in heavy investor allocations to growth funds and light allocations to value.
The data above shows that value appears to have reasserted its dominance around the world. It is only really in US large caps that growth has decisively outperformed in price terms. But US large cap growth’s downside volatility is bad and showing signs of deteriorating further, making it inferior to value on a risk-adjusted basis.
The past century has taught us that our default expectation should be for value to outperform. For growth equity outperformance, we appear to need one or more of three elements in place. Ultra-low / negative interest rates, ultra-low / negative inflation and super-abundant liquidity. From 2010 to 2020 all three of these elements were in place, resulting in nirvana-like conditions for growth investors. But since late 2020 interest rates and inflation have moved to more normal levels. The liquidity backdrop has been volatile, tightening in late 2021 and 2022 before flooding back into the system in 2023. But this torrent (from the Reverse Repo Facility) started to run out in Q1 this year, and with it the last major support for expensive securities fell away.
We believe November 2020 marked a structural turning point for value. There is now nothing to wait for – no macro catalyst or flow-based signal is required. It appears simply that the typical behaviour of stock markets over the past century has returned.
Sources:
MSCI indices are used as proxies for the various market segments; Sortino ratios are calculated using annualised risk and return values; the 10 year treasury yield is used as the risk-free return. Other data taken from Bloomberg, Kenneth R French Data Library, Lightman Investment Management. All data to 30 September 2024.
Legal
Disclaimer
This communication and its content are owned by Lightman Investment Management Limited (“Lightman”, “we”, “us”). Lightman Investment Management Limited (FRN: 827120) is authorised and regulated by the Financial Conduct Authority (“FCA”) as a UK MiFID portfolio manager eligible to deal with professional clients and eligible counterparties in the UK. Lightman is registered with Companies House in England and Wales under the registration number 11647387, having its registered office at c/o Buzzacott LLP, 130 Wood Street, London, United Kingdom, EC2V 6DL.
Target audience
This communication is intended for ‘Eligible Counterparties’ and ‘Professional’ clients only, as described under the UK Financial Services and Markets Act 2000 (“FSMA”) (and any amendments to it). It is not intended for ‘Retail’ clients and Lightman does not have permission to provide investment services to retail clients. Generally, marketing communications are only intended for ‘Eligible Counterparties’ and ‘Professional’ clients in the UK, unless they are being used for purposes other than marketing, such as regulations and compliance etc. The Firm may produce marketing or communication documents for selected investor types in non UK jurisdictions. Such documents would clearly state the target audience and target jurisdiction.
Collective Investment Scheme(s)
The collective investment scheme(s) – WS Lightman Investment Funds (PRN: 838695) (“UK OEIC”, “UK umbrella”), and WS Lightman European Fund (PRN: 838696) (“UK sub-fund”, “UK product”) are regulated collective scheme(s), authorised and regulated by the FCA. In accordance with Section 238 of FSMA, such schemes can be marketed to the UK general public. Lightman, however, does not intend to receive subscription or redemption orders from retail clients and accordingly such retail clients should either contact their investment adviser or the Management Company Waystone Management (UK) Limited (“Waystone UK”) in relation to any fund documents.
The collective investment scheme(s) - Elevation Fund SICAV (Code: O00012482) (“Luxembourg SICAV”, “Luxembourg umbrella”), and Lightman European Equities Fund (Code: O00012482_00000002) (“Luxembourg sub-fund”, “Lux product”) are regulated undertakings for collective investments in transferrable securities (UCITS), authorised and regulated by the Commission de Surveillance du Secteur Financier (CSSF) in Luxembourg. In accordance with regulatory approvals obtained under the requirements of the Law of 17 December 2010 relating to undertakings for collective investment, the schemes can be marketed to the public in Luxembourg, Norway, Spain, and Republic of Ireland. Lightman, however, does not intend to receive subscription or redemption orders from any client types for the Lux product and accordingly such client should either contact a domestic distributor, domestic investment advisor or the Management Company Link Fund Solutions (Luxembourg) S.A. (“Link Luxembourg”) in relation to any fund documents.
Luxembourg umbrella and Luxembourg sub-fund are also approved for marketing to professional clients and eligible counterparties in the UK under the UK National Private Placement Regime (NPPR). UK registration numbers for the funds are as follows: Elevation Fund SICAV (PRN: 957838) and Lightman European Equities Fund (PRN: 957839). Please write to us at compliance@lightmanfunds.com for proof of UK registration of the funds.
Luxembourg sub-fund is also approved for marketing to qualified investors in Switzerland, within the meaning of Art. 10 para. 3 and 3ter CISA. In Switzerland, the representative is Acolin Fund Services AG, Leutschenbachstrasse 50, 8050 Zurich, Switzerland, whilst the paying agent is NPB Neue Privat Bank AG, Limmatquai 1 / am Bellevue, 8024 Zurich, Switzerland.
Accuracy and correctness of information
Lightman takes all reasonable steps to ensure the accuracy and completeness of its communications; we however request all recipients to contact us directly for the latest information and documents as issued documents may not be fully updated. We cannot accept any liability arising from loss or damage from the use of this communication.
Wherever our communications refer to a third party such as Waystone, Link, Northern Trust etc., we cannot accept any responsibility for the availability of their services or the accuracy and correctness of their content. We urge users to contact the third party for any query related to their services.
Important information for non-UK persons (Including US persons)
This communication is not intended for any person outside of the UK, Switzerland, or the European Economic Area (EEA). Lightman or any of the funds referenced in this communication are not approved for marketing outside of the UK, Switzerland, or the EEA. All such persons must consult their domestic lawyers in relation to services or products offered by Lightman.
Risk warning to all investors
The value of investments in any financial assets may fall as well as rise. Investors may not get back the amount they originally invested. Past performance is not an indicator of future performance. Potential investors should not use this communication as the basis of an investment decision. Decisions to invest in any fund should be taken only on the basis of information available in the latest fund documents. Potential investors should carefully consider the risks described in those documents and, if required, consult a financial adviser before deciding to invest.
Offer, advice, or recommendation
No information in this communication is intended to act as an offer, investment advice or recommendation to buy or sell a product or to engage in investment services or activities. You must consult your investment adviser or a lawyer before engaging in any investment service or product.
GDPR
Lightman may process personal information of persons using this communication. Please read our privacy policy.
Copyright
This communication cannot be distributed or reproduced without our consent.