
Markets have a habit of pulling investors in the wrong direction at the wrong time. Because megacaps performed well in 2023, investors are feeling pressured to go passive. But they must resist these siren voices. Whilst active managers are never great supporters of passive funds, today seems a uniquely dangerous time for this kind of investing. The risks embedded in passive portfolios are particularly high now, especially in US equities. The largest companies appear to have the largest downside risk. Active management with a value bias can significantly reduce these risks and help to protect client portfolios.
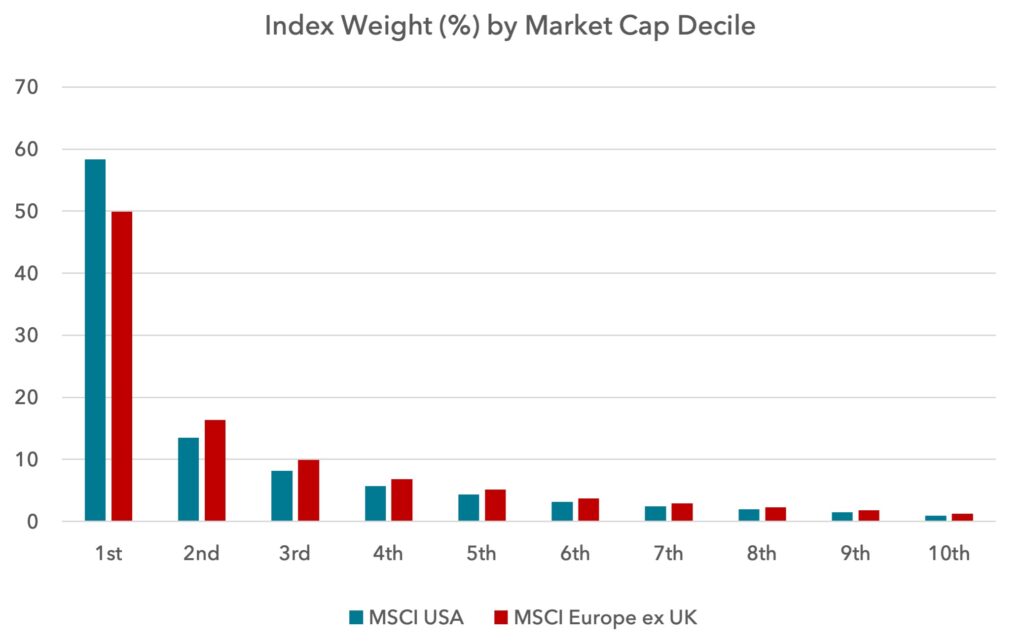
It is an obvious point, but most passive funds skew exposure to companies with the largest capitalisations. Below we show what that means for the US and European equity markets. 72% of the US index and 66% of the European index are made up by the top two deciles of market cap. And 85% and 83% are made up of the top four deciles. If you are going passive you need to be confident about the risk and return profile of the largest companies, because they will dominate the returns of your passive funds.
Relationship between market cap and valuation multiple
Today, when we look at the valuations of the US equity market by size, something abnormal appears: the larger the company, the higher the multiple. Below we show the median price to sales and median price to book for the MSCI USA index by market cap decile.
Large companies do not have a pre-ordained right to trade more expensively than other companies. On the contrary, due to base effects, it is often harder for large companies to grow faster than smaller companies and therefore in the great majority of the historical record, large companies traded at a discount. This is not the case today, where the larger the company, the more expensive it is.
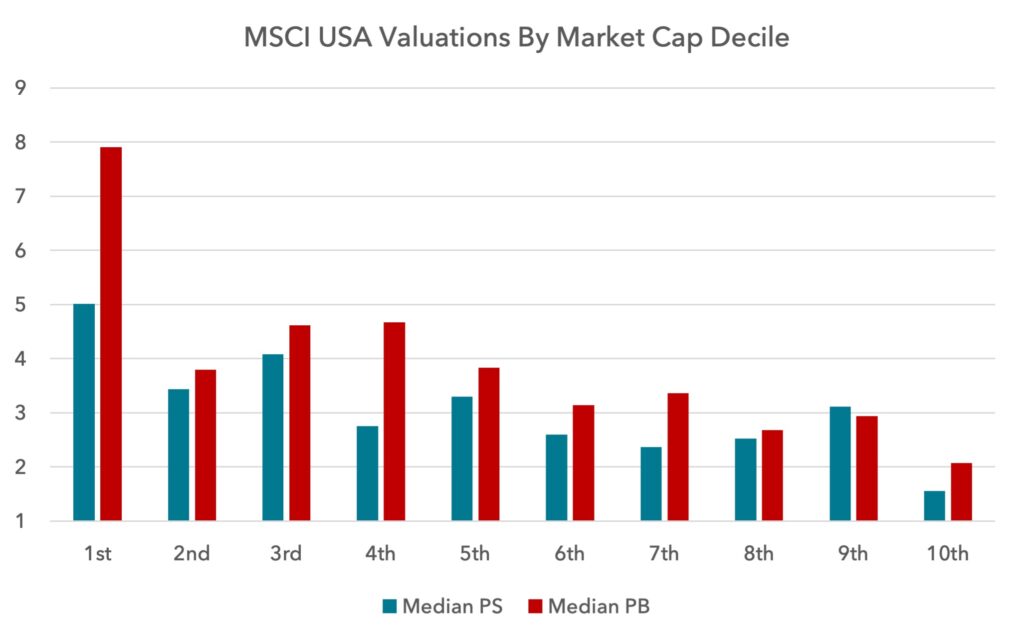
What is especially striking is the linear relationship between market cap and valuation. This is hard to justify fundamentally and suggests something else is going on. Non-fundamental, and therefore unsustainable, forces appear to have been at work, which we will get to.
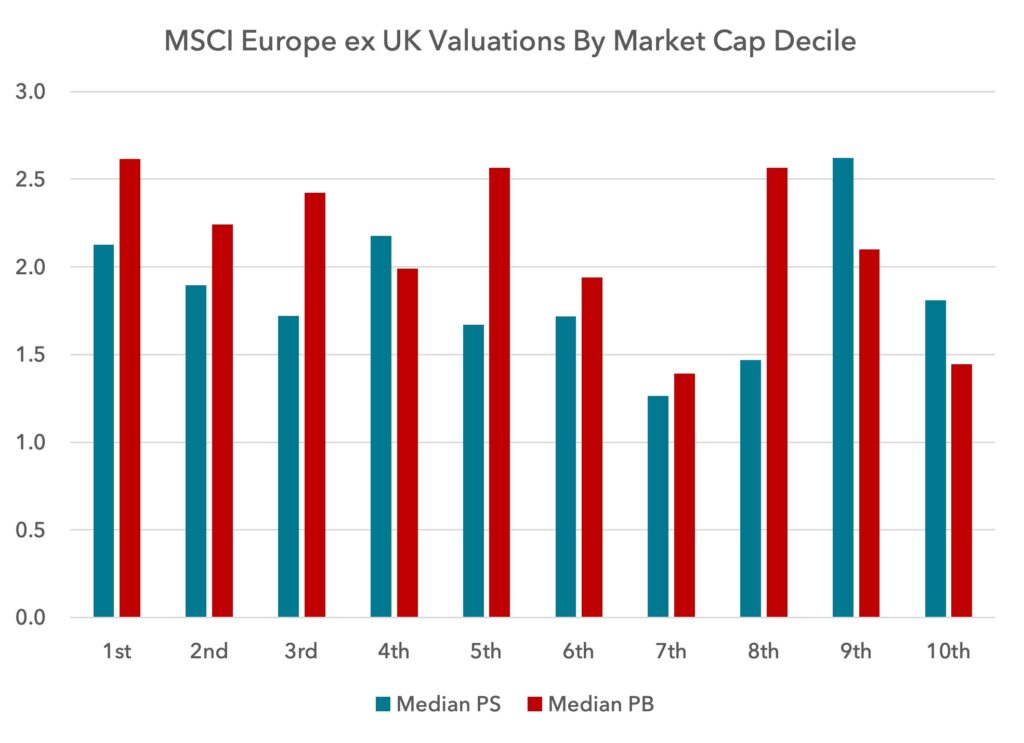
In Europe the situation is not as bad as in the US. Within the standard European benchmark, there is not much of a relationship between size and valuation multiple. As we will show, there are differences between large caps, mid caps and small caps – but within large caps, we do not have the same divergence as in the US.
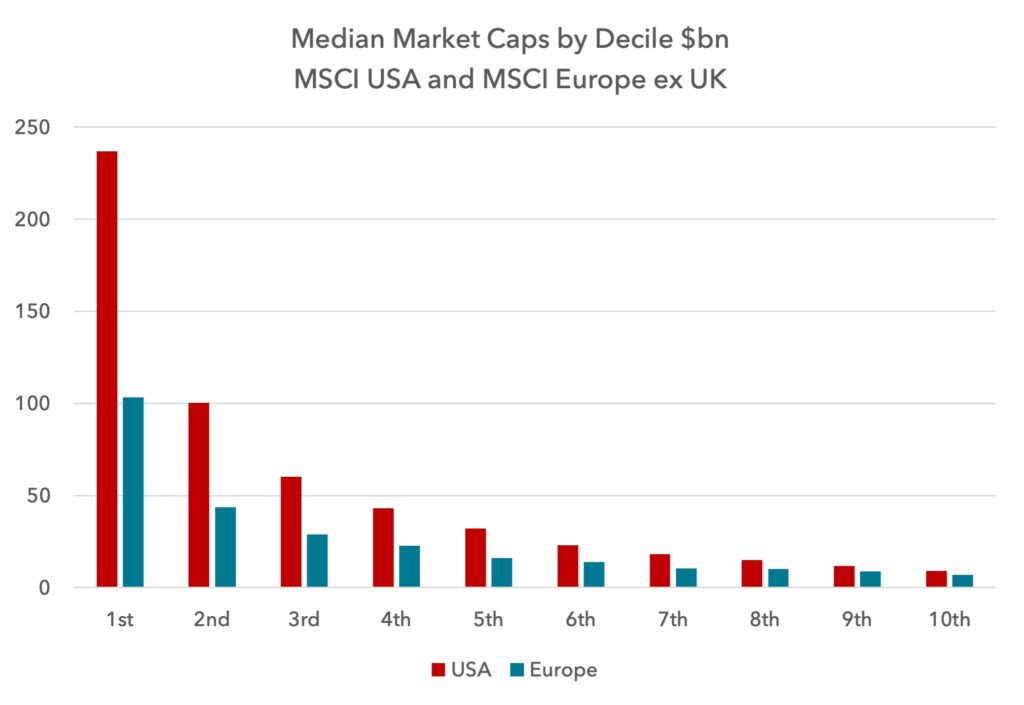
Below we show the median market caps measured in dollars, by decile, for the US and Europe. In the US it is the top 4-5 deciles, i.e. those that dominate passive funds, that are very expensive. This equates to those companies with a market cap above $30-$40bn.
How have valuations by market cap changed over time?
MSCI provides dedicated large, mid and small-cap indices for the USA and Europe. The median market caps for these indices are below:
Median Market Cap $bn |
||
| MSCI | US | Europe |
| Large Cap | 68.1 | 29.1 |
| Mid Cap | 15.9 | 6.7 |
| Small Cap | 1.7 | 1.0 |
Below we assess how price to sales, price to book and dividend yield have changed over time for large caps relative to small and mid caps.
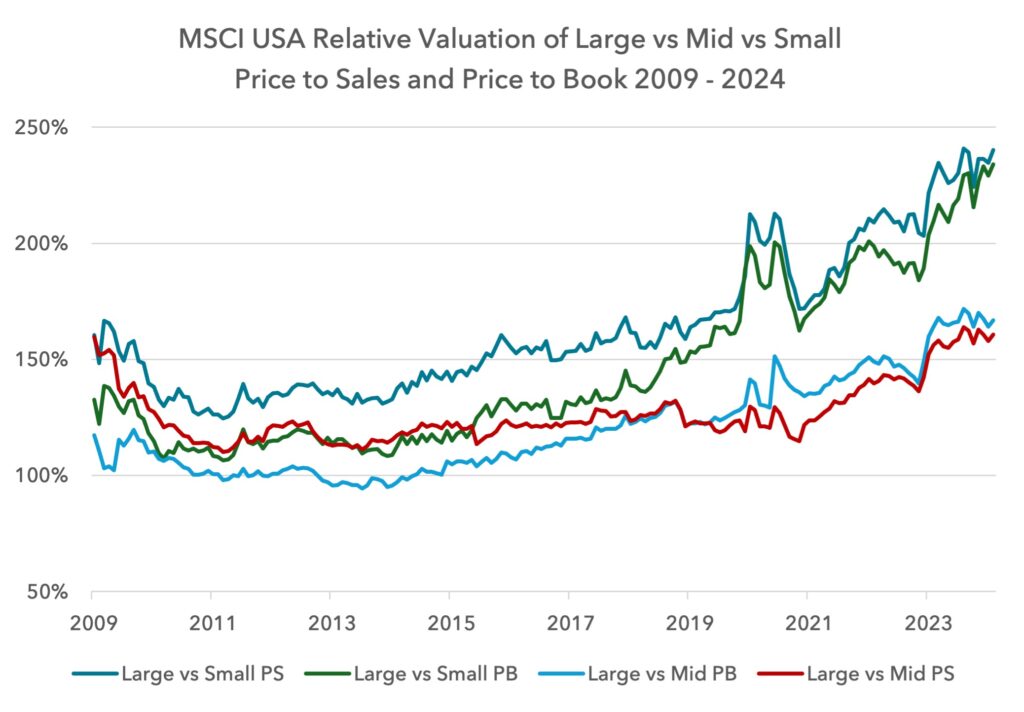
USA
US large caps started climbing in relative valuation versus small caps in 2015 and in 2021 versus mid caps. In the next chart, we can clearly see a steep acceleration in the last three years, with large caps now at significant premiums.
Whilst large caps have expanded their premium over mid caps, there has been a much larger premium between large and small caps.
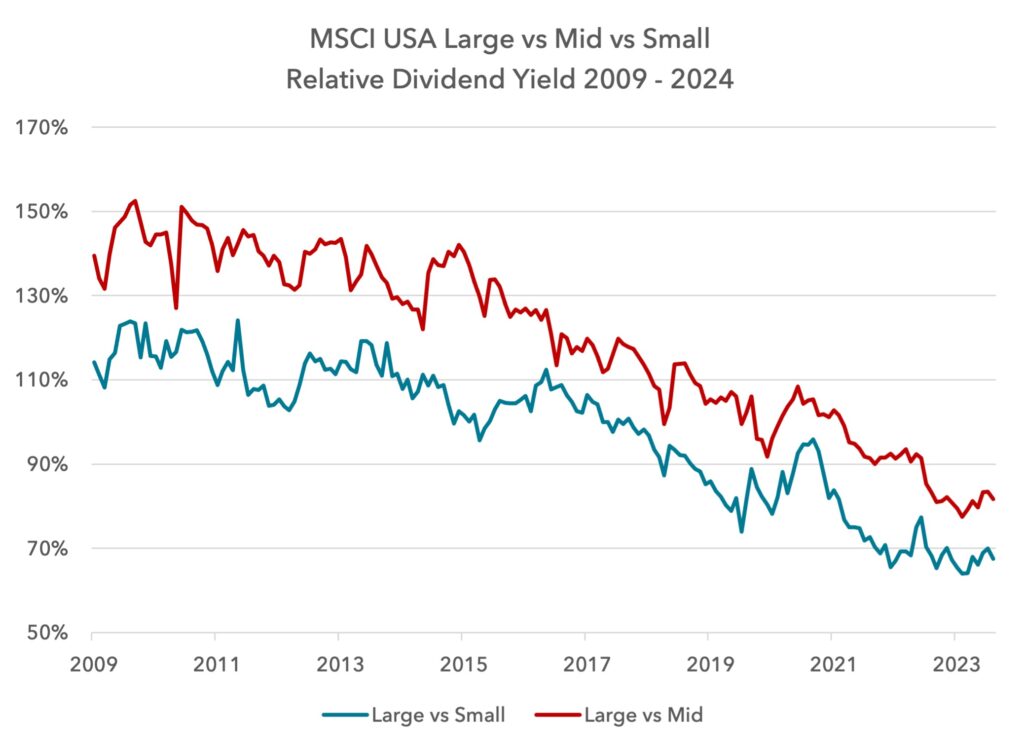
Amazingly, the dividend yield is now significantly lower for large companies versus small and mid-cap companies in the US. This is a very rare occurrence in the historical record and is usually a bad sign for forward index returns. The last time this occurred was during the peak of the dot-com bubble. And it did not last long.
What about mid cap vs small cap?
The premium for mid caps versus small caps has expanded, but the change is much more muted than has occurred with large caps. The big change is the premium that has emerged for large caps.
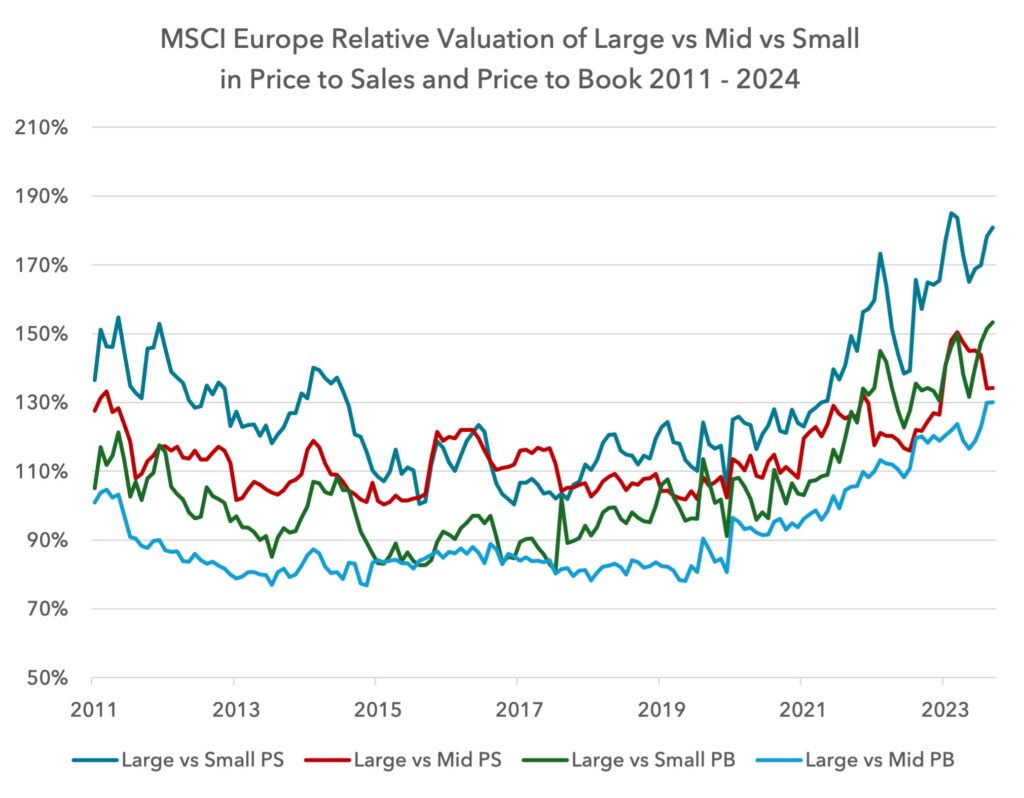
What about Europe?
In Europe, there was no clear premium for large caps until after the pandemic. Something changed during 2020 and 2021 that acted to drive up the valuations of large caps more powerfully than in the past. Whilst the premium is not as great as in the US, it has still changed sharply.
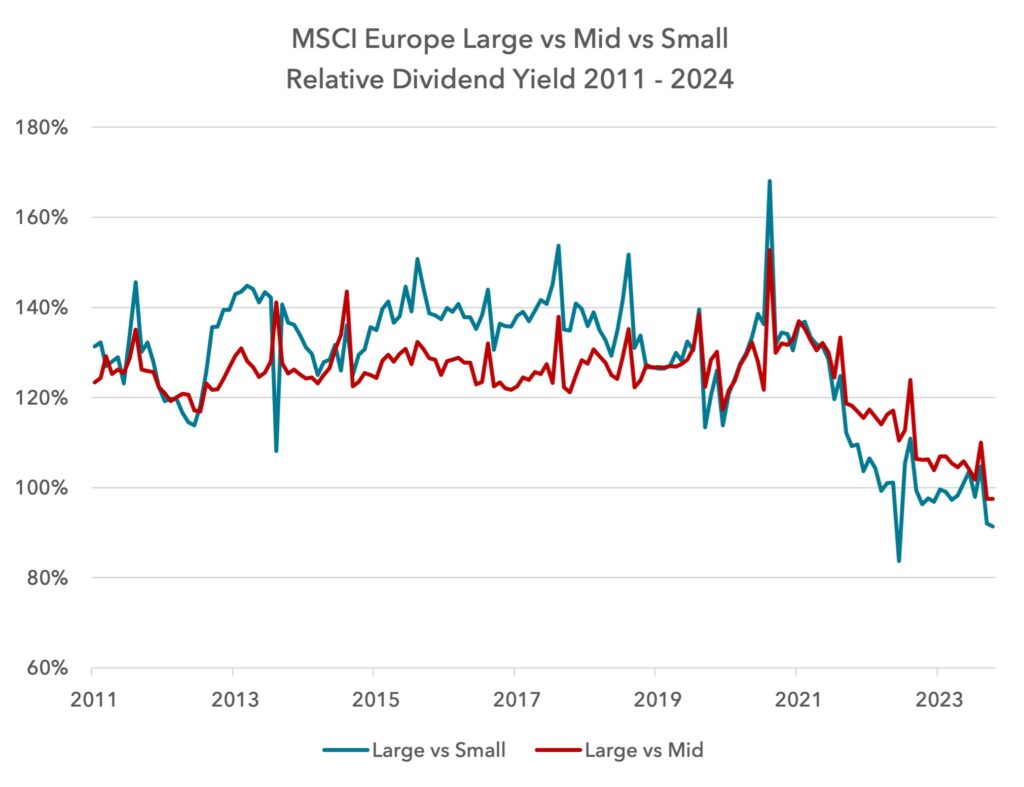
As in the US, European large caps now yield less in dividend terms compared to mid caps and small caps. Again, as in the US, this is very abnormal.
Is this premium for large caps driven by fundamentals or by something else?
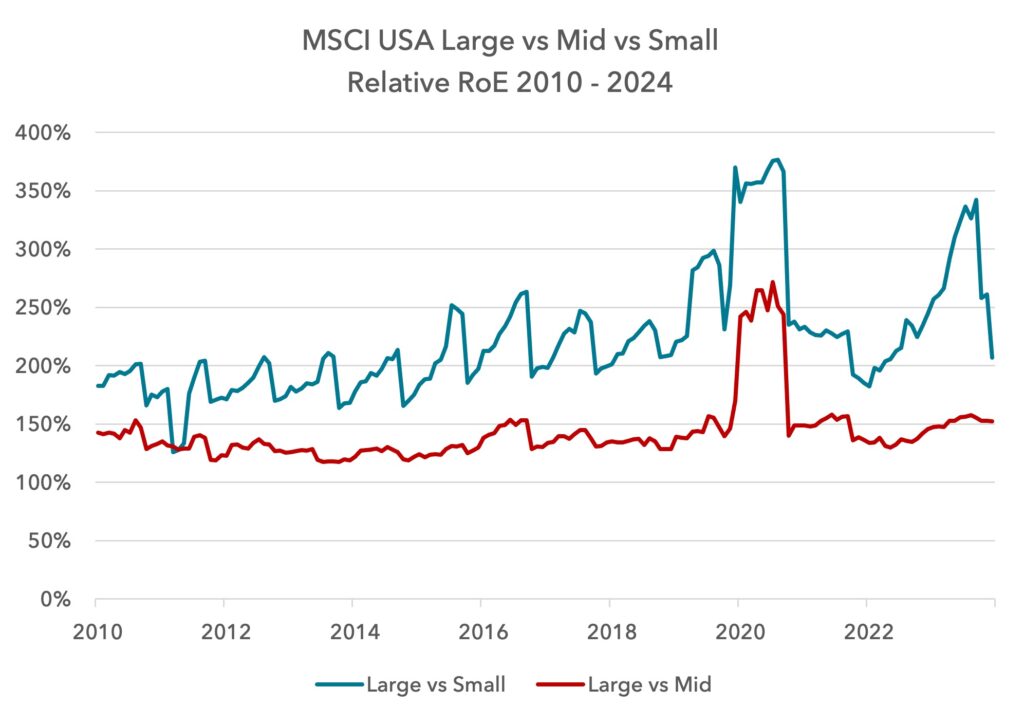
Many investors believe that large caps have seen a substantial increase in return on equity (RoE) compared to the rest of the market and this is why valuations have changed. During the pandemic and in 2023 this appeared to be the case, but it was largely driven by smaller companies seeing a drop in their RoE. This RoE advantage has largely unwound recently, due to small-cap RoE recovering.
The chart below shows the relative RoE for large versus mid and small cap. The data is a little streaky because of outliers and low reporting frequency. It is clear, however, that RoE is higher for large caps, but it has not changed sustainably over the past decade.
In Europe, similarly to the US, the pick-up in relative RoE has been more about small-cap RoE declining and less about large-cap RoE rising. Europe has been close to recession for much of the past twelve months and this has impacted smaller companies more than larger companies. This will probably unwind in due course, leaving less of a clear fundamental driver for the jump in relative valuation for large companies.

If it is not about a change in profitability, what is driving this premium for large caps?
We wrote recently about the importance of liquidity in driving asset prices. When central banks create money that flows into capital markets, it lifts asset prices. But it appears to lift large-cap asset prices more.
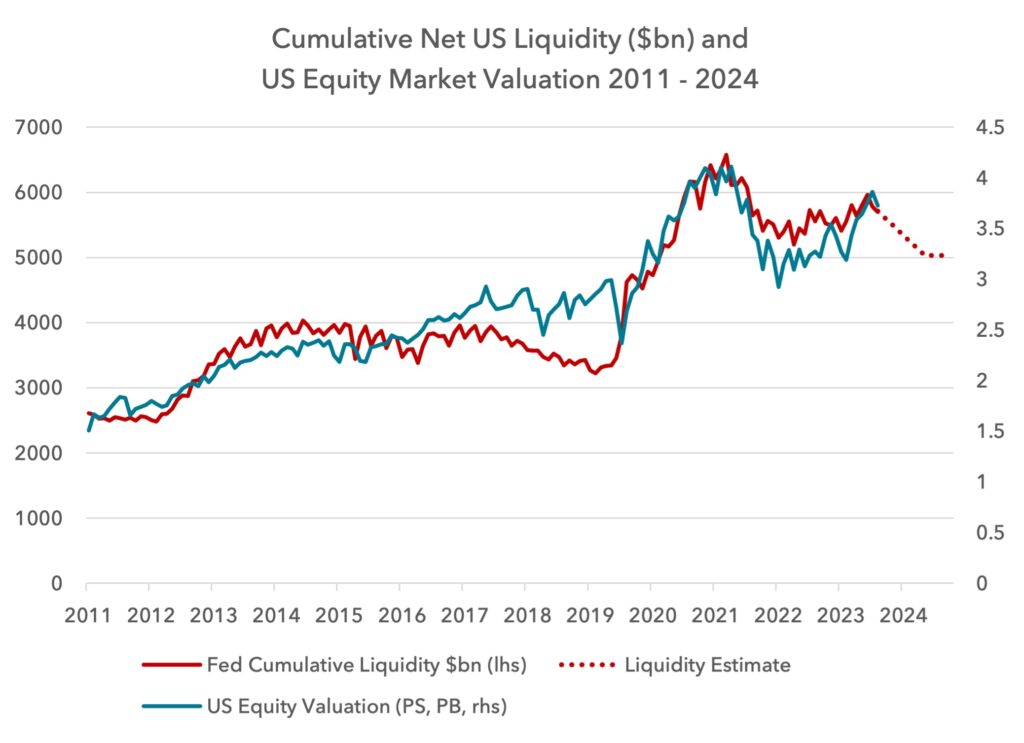
Below we show aggregate central bank liquidity versus market valuation. This is a dual scale chart, so we must be careful drawing overly precise conclusions from it, but it is hard to argue that central bank net liquidity creation is not a powerful force in valuation.
The chart shows the valuation of the MSCI World index as measured by an average of price to book and price to sales, and we compare it to net liquidity, with a forecast.

You will notice what appears to be a de-coupling over the past year, where global liquidity has tightened and yet valuations have risen.
This can be explained by a large expansion of US liquidity over the past year. Even though global liquidity has tightened, the expansion in the US has appeared to be powerful enough to lead the US and global markets higher.
Below we show US equity market valuation and Fed liquidity in isolation.
A dangerous moment for the largest companies
Markets have seen an atypical ramp-up in the valuation of the largest companies since the pandemic. Large caps now trade at big premiums to smaller companies, without any obvious fundamental driver.
Liquidity is likely the key driver of this change, just as it was during the late dot-com period. Unless QE restarts, there is a high likelihood that US and global liquidity will contract over the coming year. This ought to put downward pressure on equity market valuations, but it is the megacaps that are most expensive and most vulnerable.
Passive investing has received a tremendous boost from the $15 trillion of security buying by global central banks since 2011. But that tailwind looks set to be a headwind in the coming years. Large caps are not likely to hold their valuation premium, so a passive investing approach is taking on unnecessary risk. We have firm conviction that active management with a value bias can protect client portfolios in the coming years.
Sources:
MSCI, Bloomberg, Lightman Investment Management
Legal
Disclaimer
This communication and its content are owned by Lightman Investment Management Limited (“Lightman”, “we”, “us”). Lightman Investment Management Limited (FRN: 827120) is authorised and regulated by the Financial Conduct Authority (“FCA”) as a UK MiFID portfolio manager eligible to deal with professional clients and eligible counterparties in the UK. Lightman is registered with Companies House in England and Wales under the registration number 11647387, having its registered office at c/o Buzzacott LLP, 130 Wood Street, London, United Kingdom, EC2V 6DL.
Target audience
This communication is intended for ‘Eligible Counterparties’ and ‘Professional’ clients only, as described under the UK Financial Services and Markets Act 2000 (“FSMA”) (and any amendments to it). It is not intended for ‘Retail’ clients and Lightman does not have permission to provide investment services to retail clients. Generally, marketing communications are only intended for ‘Eligible Counterparties’ and ‘Professional’ clients in the UK, unless they are being used for purposes other than marketing, such as regulations and compliance etc. The Firm may produce marketing or communication documents for selected investor types in non UK jurisdictions. Such documents would clearly state the target audience and target jurisdiction.
Collective Investment Scheme(s)
The collective investment scheme(s) – WS Lightman Investment Funds (PRN: 838695) (“UK OEIC”, “UK umbrella”), and WS Lightman European Fund (PRN: 838696) (“UK sub-fund”, “UK product”) are regulated collective scheme(s), authorised and regulated by the FCA. In accordance with Section 238 of FSMA, such schemes can be marketed to the UK general public. Lightman, however, does not intend to receive subscription or redemption orders from retail clients and accordingly such retail clients should either contact their investment adviser or the Management Company Waystone Management (UK) Limited (“Waystone UK”) in relation to any fund documents.
The collective investment scheme(s) - Elevation Fund SICAV (Code: O00012482) (“Luxembourg SICAV”, “Luxembourg umbrella”), and Lightman European Equities Fund (Code: O00012482_00000002) (“Luxembourg sub-fund”, “Lux product”) are regulated undertakings for collective investments in transferrable securities (UCITS), authorised and regulated by the Commission de Surveillance du Secteur Financier (CSSF) in Luxembourg. In accordance with regulatory approvals obtained under the requirements of the Law of 17 December 2010 relating to undertakings for collective investment, the schemes can be marketed to the public in Luxembourg, Norway, Spain, and Republic of Ireland. Lightman, however, does not intend to receive subscription or redemption orders from any client types for the Lux product and accordingly such client should either contact a domestic distributor, domestic investment advisor or the Management Company Link Fund Solutions (Luxembourg) S.A. (“Link Luxembourg”) in relation to any fund documents.
Luxembourg umbrella and Luxembourg sub-fund are also approved for marketing to professional clients and eligible counterparties in the UK under the UK National Private Placement Regime (NPPR). UK registration numbers for the funds are as follows: Elevation Fund SICAV (PRN: 957838) and Lightman European Equities Fund (PRN: 957839). Please write to us at compliance@lightmanfunds.com for proof of UK registration of the funds.
Luxembourg sub-fund is also approved for marketing to qualified investors in Switzerland, within the meaning of Art. 10 para. 3 and 3ter CISA. In Switzerland, the representative is Acolin Fund Services AG, Leutschenbachstrasse 50, 8050 Zurich, Switzerland, whilst the paying agent is NPB Neue Privat Bank AG, Limmatquai 1 / am Bellevue, 8024 Zurich, Switzerland.
Accuracy and correctness of information
Lightman takes all reasonable steps to ensure the accuracy and completeness of its communications; we however request all recipients to contact us directly for the latest information and documents as issued documents may not be fully updated. We cannot accept any liability arising from loss or damage from the use of this communication.
Wherever our communications refer to a third party such as Waystone, Link, Northern Trust etc., we cannot accept any responsibility for the availability of their services or the accuracy and correctness of their content. We urge users to contact the third party for any query related to their services.
Important information for non-UK persons (Including US persons)
This communication is not intended for any person outside of the UK, Switzerland, or the European Economic Area (EEA). Lightman or any of the funds referenced in this communication are not approved for marketing outside of the UK, Switzerland, or the EEA. All such persons must consult their domestic lawyers in relation to services or products offered by Lightman.
Risk warning to all investors
The value of investments in any financial assets may fall as well as rise. Investors may not get back the amount they originally invested. Past performance is not an indicator of future performance. Potential investors should not use this communication as the basis of an investment decision. Decisions to invest in any fund should be taken only on the basis of information available in the latest fund documents. Potential investors should carefully consider the risks described in those documents and, if required, consult a financial adviser before deciding to invest.
Offer, advice, or recommendation
No information in this communication is intended to act as an offer, investment advice or recommendation to buy or sell a product or to engage in investment services or activities. You must consult your investment adviser or a lawyer before engaging in any investment service or product.
GDPR
Lightman may process personal information of persons using this communication. Please read our privacy policy.
Copyright
This communication cannot be distributed or reproduced without our consent.