
- Valuations for parts of the equity market are now extremely stretched, at levels that preceded significant price declines in the past.
- Extreme valuations can persist provided liquidity remains abundant. But liquidity conditions look set to peak and then decline within a few months. This suggests we are in the late stages of this growth equity rally.
- Technology stocks appear to be the most vulnerable.
- This scenario looks similar to late-2021. We believe investors should reduce exposure to growth and technology and add to value equities.
Under the surface of this equity market rally, we see growing fragility. This fragility comes from pressure in three areas: valuation, liquidity and discount rates.
Record valuations
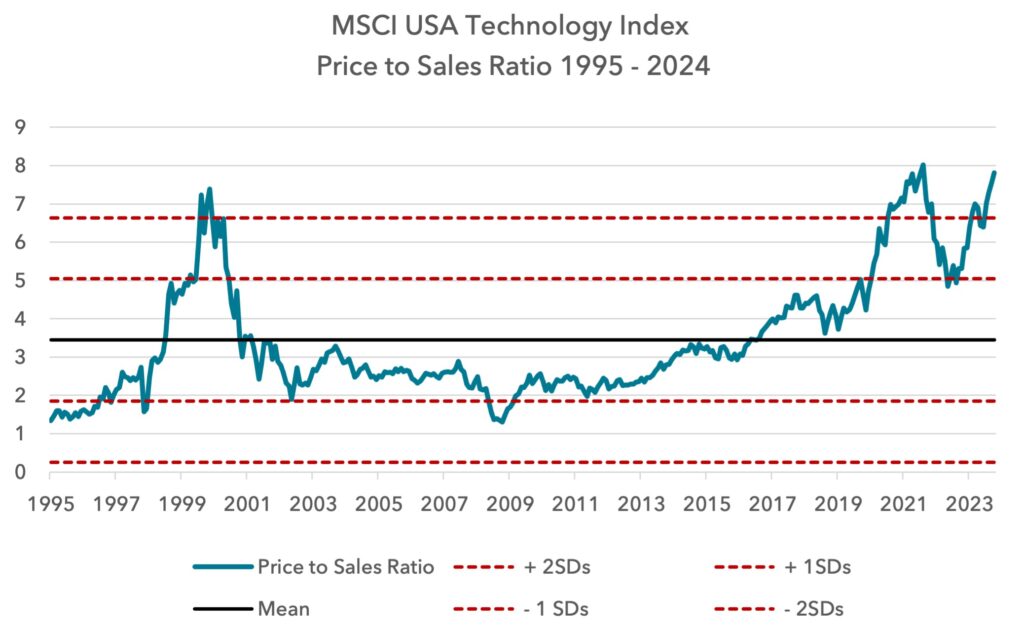
The speed of the move higher over recent months has pushed valuations for certain companies to record levels. Below we show the MSCI USA Technology Index’s Price to Sales Ratio from 1995-2024. We plot the mean valuation over the 29-year period with standard deviation (SD) lines. The valuation is now back to the all-time high reached in late 2021. Incredibly, today’s valuation eclipses the peak of the dot-com bubble. The current reading of 7.9x sales is at nearly 3 standard deviations from the mean and has been eclipsed only once in 29 years.
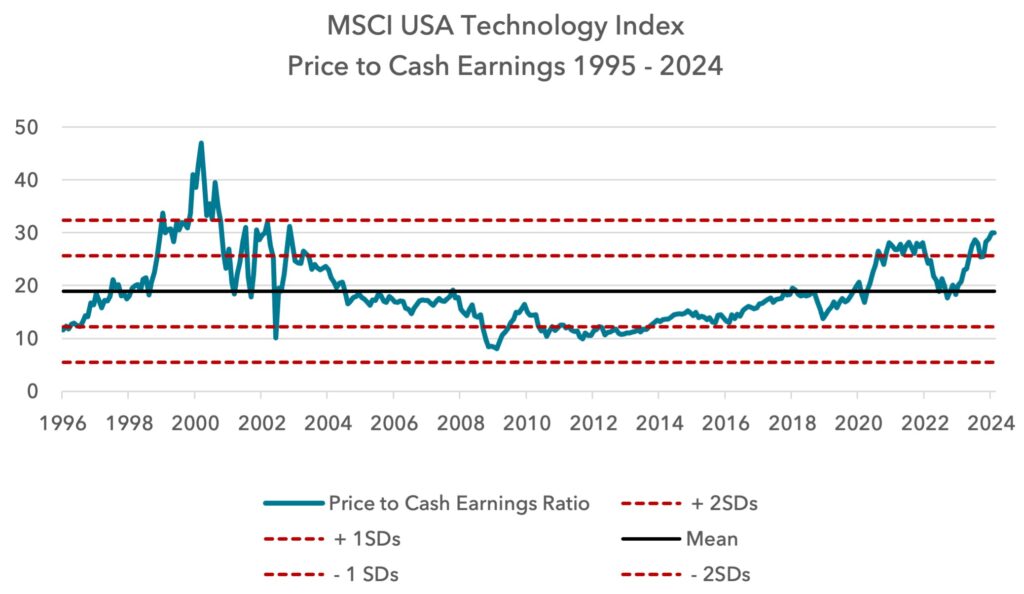
It could be argued that price to sales is an unfair metric for Technology companies, particularly compared to the dot-com era, since these companies are more profitable now than in the past. In order to address this argument we perform the same analysis using Price to Cash Earnings – this is an MSCI definition that adds back depreciation and amortization to earnings.
In this case, valuations were only ever higher than today during the dot-com bubble, when many tech companies had no earnings. Strikingly, valuations today are higher than in late 2021, at a time of near euphoria.
What about European equities?
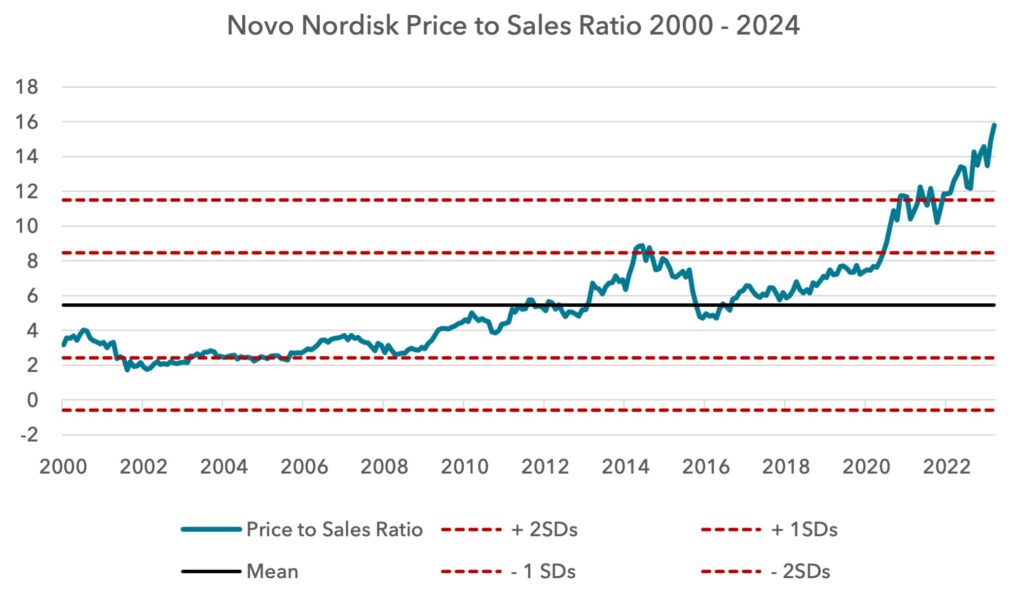
The latest rally has been propelled by large-cap growth stocks. Year to date, Novo Nordisk and ASML are responsible for over 85% of the European index’s return.
Novo’s valuation is now at an incredible level, eclipsing all of the Magnificent 7, bar Nvidia.
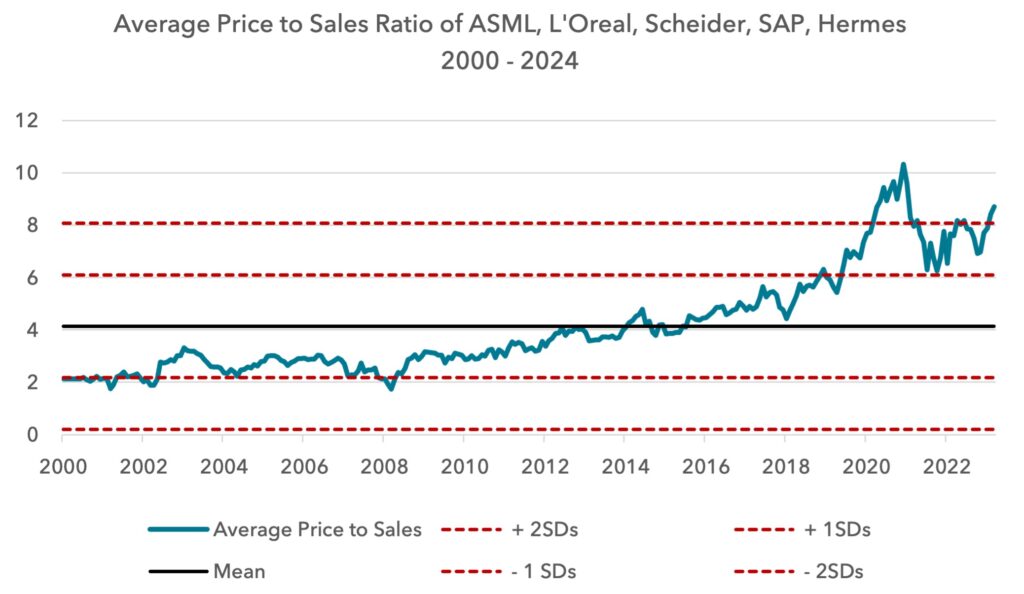
But it is not just Novo Nordisk. Many European large-cap growth stocks are trading at record valuations. Below we show the average price to sales ratio of five popular growth equities: ASML, L’Oréal, Schneider, SAP and Hermès. Here we can see that valuations are not at the all-time highs reached in November and December 2021, but are not far off.
So what is propelling these incredible valuations?
The dominant force propelling these valuations is the same one that was at work pushing record prices in 2000 and in 2021: abundant liquidity. When there is large money creation flooding markets, the money tends to chase the companies and ideas most in vogue. Clearly AI is one such concept. The weight loss story of GLP-1 drugs is another. There are genuine earnings drivers from these concepts but the multiple expansion of these companies illustrates how easily these concepts can descend into mania.
In December 2023 we wrote about liquidity and how it was dominating market returns.
Whilst quantitative tightening (QT) has been occurring since June 2022, it was fully offset in 2023 by a huge release of liquidity from the Reverse Repo Facility (RRP). Since the start of 2023, QT acted to remove $1tn of liquidity, but the RRP added back over $2tn.
QE-like conditions have been back these past 13 months, driving these record valuations. The question is how long will these conditions last?
One of the key focus areas going forward is the RRP. As we show below, this reservoir of cash has been pouring into markets since January 2023. How much is left to come?
In January 2023 the balance was $2.5tn; today it is $500bn. If the current pace is maintained, the RRP could run dry within two months or so.
The speed of the RRP decline is a function of the confidence that money market funds have in the likelihood and imminence of rate cuts. The sooner rate cuts are expected, the faster the balance will fall.
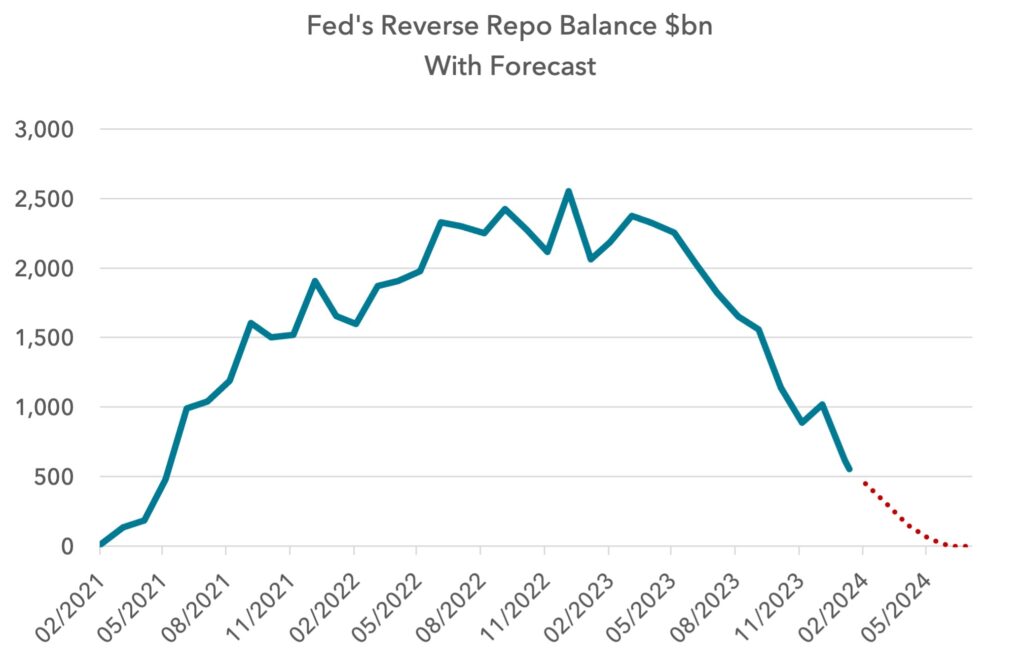
It is conceivable that the RRP will not fall further if rate cuts are taken off the table. This would mean it stops providing an uplift to markets, but this is not our base case. We still see support from the RRP for a month or two more, but once this support is removed, we expect markets to be on more fragile ground.
What about tapering quantitative tightening?
Recent speeches by Fed officials have opened up the idea of reducing and then ending QT. Lorie Logan, the president of the Dallas Fed, discussed this in January. She actually cited the sharp decline in the RRP as a reason that QT should be tapered. This was interesting, reinforcing the idea that the RRP is seen by Fed officials as having acted as a key support for markets over the last year.
We saw what QT without a liquidity offset looked like during 2022. It helped set the scene for a 27% decline in the S&P 500 and a 36% decline in the Nasdaq.
The huge volumes of government debt that need to be issued this year will require all the help the authorities can provide. This suggests we should expect an end to QT sooner rather than later. But we do not believe this will be a bullish catalyst. In 2023 we saw net liquidity of over $1tn from these two facilities. Once the RRP balance is drained, a full exit from QT amounts to zero liquidity creation. This is a big change compared to the large expansion of the past year.
In our analysis in December, we showed that, over the last 3 years, Technology and Growth equities appear to struggle unless there is a sustained deluge of liquidity. The amount that appears to be required to propel Tech and Growth outperformance is a net $150bn liquidity creation per month. Zero liquidity creation is unlikely to cut it, and that will likely be the backdrop at some point this year.
Banking system stress could create more liquidity
We do not believe the pressures on the financial system from commercial real estate and other overvalued long duration investments are over. Elevated long-term bond yields are continuing to exert pressure on valuations and funding costs.
But given this threat, investors have to be prepared for more emergency lending from the Fed, as in March 2023. The Fed’s March emergency loans pushed additional liquidity into the system, on top of those funds from the RRP, lifting asset prices and, in particular, growth equities.
The question will be the size and duration of any future Fed emergency lending. We believe that further Fed liquidity injections, if they are to occur, will be more targeted than in March 2023 and have a more muted impact.
Perhaps it is an obvious point, but the general mood on inflation will be critical in determining the scale of any central bank policy response. If inflation is seen as already dealt with, central banks will feel emboldened to print money on a large scale. If inflation is still seen as a threat, money printing will need to be more targeted and tactical and, of course, may not happen at all.
Our broad thesis is that this decade will see conditions more like the latter scenario, where inflation remains a persistent threat, limiting the scope of central bank money creation, and supporting the case for value equities.
Are there any other sources of liquidity to hand?
Given it is an election year, it is likely that the US Government will work hard at supporting both the economy and markets in the short term. Can they pull another rabbit out of the hat?
There is one other balance that could be deployed this year: the Treasury General Account. This is the checking account of the Treasury held at the Fed, and today it stands at c.$800bn. In order to take pressure off the bond market, Janet Yellen could decide to run this balance down and fund government spending without issuing debt. This would amount to fresh liquidity creation.
Last year this balance was run down during the debt ceiling impasse and was then replenished. After the impasse, the Treasury made it known that it would like to keep this balance at around $750bn as a buffer for future debt ceiling crises. But these guidelines might be ignored in a situation where the Treasury felt that liquidity pressures were building.
We find it hard to believe that this balance will be run down completely in any circumstance. But could this be run down to $200-300bn? Conceivably. If this were to happen it would give markets a few more months of liquidity, extending our timeline for a correction by a few more months.
The importance of the fiscal deficit for bond yields
We believe the fiscal position of governments is becoming more important than in the past, both for liquidity and for discount rates.
On 7th February 2024 the Congressional Budget Office published its new long-term deficit expectations based on current US Government spending plans.
The CBO expects a big reduction in the deficit this year, which seems optimistic. They are expecting lower spending, despite tax cuts being debated in Congress, and a large increase in capital gains tax. Over their long-term forecast, the economy is expected to grow nominally at an average pace of 4.1% through the period with no recession.
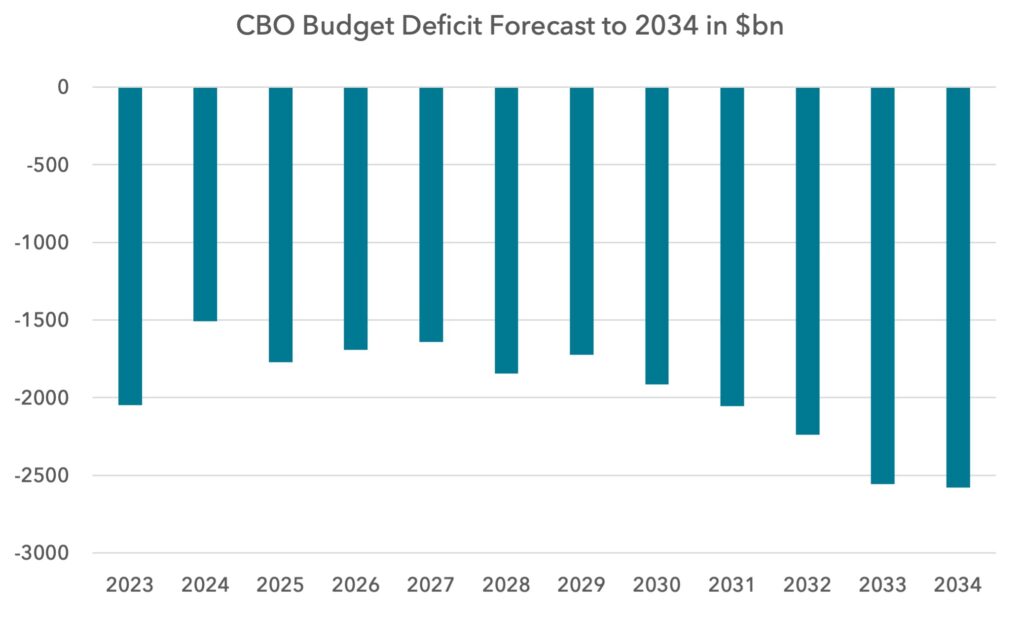
In our note from August 2023, we highlighted how difficult it will be to find buyers for this debt. Remember that the deficit means that the US Government needs to find c.$1.8tn-$2tn of new buyers each year, on top of existing buyers rolling over existing holdings. The total market size is $26.3tn, meaning we will see an increase in supply of Treasury debt of over 20% in just three years.
If you view US Government Bonds like a stock, the outlook is bearish. New treasury supply could be viewed like a rights issue for a company on the stock market. Whilst the size of government debt tends to rise, it is the speed of the increase that can generate stress. From an equity market perspective, the Government has told investors that they will have repeated rights issues, year after year, diluting investors by 7% per year in good times, with more dilution in bad times. Publicly held debt is expected to rise from $26tn today to $48tn by 2034, even with the expectation of no recession and high GDP growth rates. This means, even in good times, in 10 years the supply of debt will have nearly doubled. As a US debt holder, this means your claims to the total cashflows of the Government will have halved.
Equity investors would demand, at a minimum, a double-digit dividend yield for this kind of risk profile.
The global fiscal picture
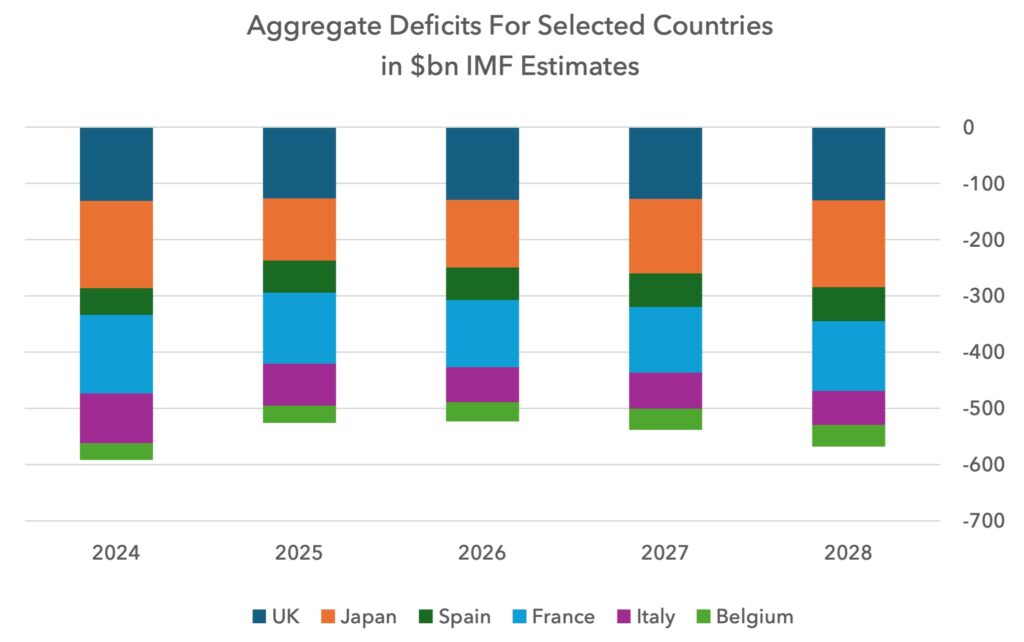
In earlier notes we highlighted Japan, the UK, France, Spain, Belgium and Italy as likely to run deficits greater than 3% in the coming years, with debt to GDP ratios above 100%.
Below we use IMF deficit estimates to calculate the aggregate new borrowing per year from these six countries in dollars. Whilst the numbers are not as large as in the US, they are still significant for the countries involved. The UK and France must each find $130bn of new buyers of their debt each and every year through to 2028, and likely beyond. Japan requires close to $150bn of new demand per year.
The most likely funding source for Japan will come from the repatriation of some of their US Treasury holdings of $1.1tn, which may add to US funding pressures.
The purpose of this chart is to show that fiscal weakness is a global phenomenon today. These deficits will mechanically drain capital from other sources and have the potential to push the global cost of capital higher.
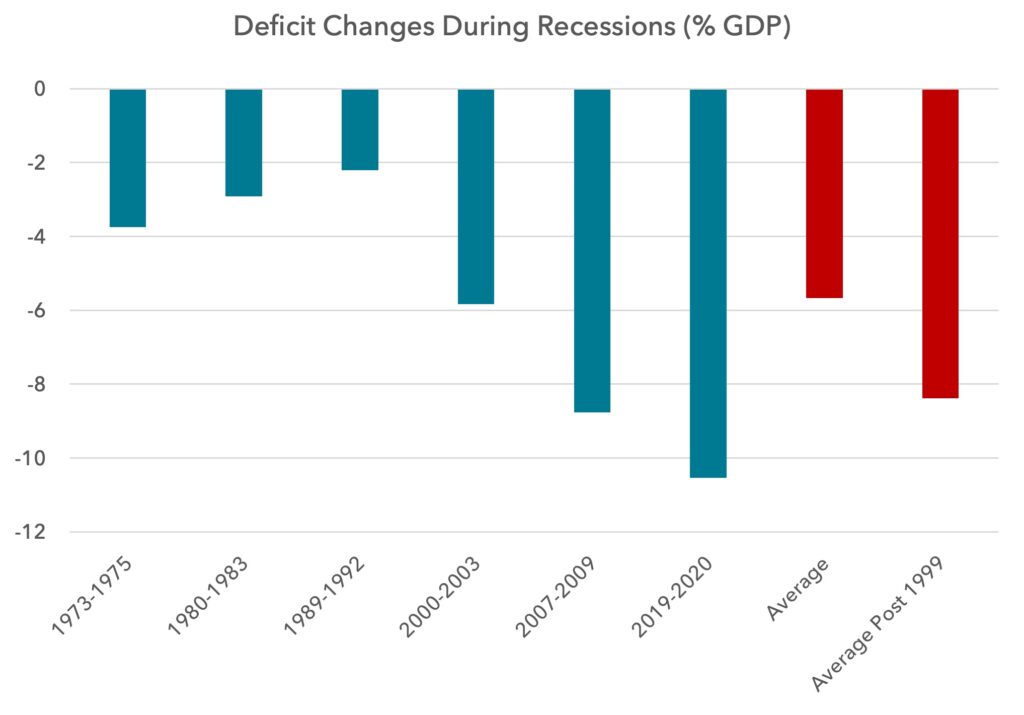
What happens to deficits in recessions?
Whilst the US economy has been resilient over the last year, this has not helped the fiscal position of the Government. We have never been in a situation where the deficit has been so large with unemployment so low. Usually when the unemployment rate is less than 4.5%, like today, the deficit is less than 1%. Today unemployment is near an all time low and the deficit is 7%.
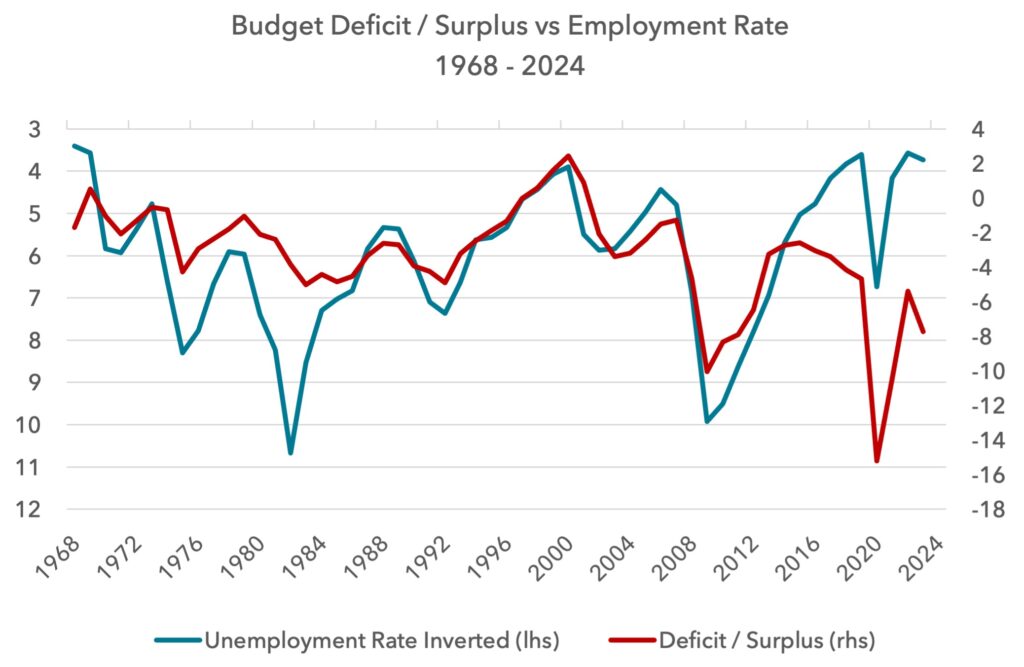
This begs the question of what would happen to the deficit in a recession. Below we show how the US deficit has changed during recessions over the past 50 years. The average widening of the deficit over the entire period is 5.6%, but the last three recessions have seen a widening of 8.4%. If history is a guide, we should be prepared for a deficit in the next recession reaching well into double digits.
As we argued in our August note, these fiscal problems will be surmountable eventually. This pending crisis will get solved. A political consensus will arrive that forces a reduction in spending and an increase in taxes. The question is how we get there. As we have noted before, it usually takes market pressure to drive the necessary consensus.
Looking at the remainder of 2024 and 2025, we see a coming collision between positioning, valuation and fundamentals.
Investors have bid up valuations aggressively, driven by the expectations of significant rate cuts and abundant liquidity. But whether the Fed cuts rates three times or ten times, it is hard to see the long end of the yield curve falling much more, given the supply-demand imbalance of government debt.
The cost of money for much of the economy is expected to stay high, exerting pressure on valuations and earnings. More pertinently, liquidity, so dominant a force in market returns over the last two years, looks set to dry up soon. There appears to be about two months of liquidity flows left from the RRP. If the Treasury Department decides to drain the TGA, which is possible, that would add a couple more months of support.
But one way or another, the forces that have pushed up excessive valuations are slowly running out of power.
How to protect client wealth from this pending collision
We believe the following attributes will be helpful in navigating this scenario:
- Low valuations with a focus on high free cash flow yields
- Strong balance sheets, where sustained high interest rates can be withstood
- Earnings expectations that are already cautious and can be beaten
- Solid dividends and buy-backs
- Exposure to supply-constrained industries
Our portfolios have been left behind by the rally over the last 12 months, not gaining as risk appetite has surged. This has been painful. But we believe this insensitivity to liquidity will prove to be a blessing as 2024 progresses.
Our portfolios’ median forecast PE ratio is 10.9 in 2024 and 9.8 in 2025. The median price to sales ratio is less than 1x, with a forecast dividend yield in excess of 5%. We believe we can generate positive absolute and relative returns in 2024, even in more challenging conditions for the benchmark.
Sources:
The Federal Reserve, The Congressional Budget Office, The IMF, Dan Clifton, Strategas Washington Policy Team, MSCI, Bloomberg, Lightman Investment Management
Legal
Disclaimer
This communication and its content are owned by Lightman Investment Management Limited (“Lightman”, “we”, “us”). Lightman Investment Management Limited (FRN: 827120) is authorised and regulated by the Financial Conduct Authority (“FCA”) as a UK MiFID portfolio manager eligible to deal with professional clients and eligible counterparties in the UK. Lightman is registered with Companies House in England and Wales under the registration number 11647387, having its registered office at c/o Buzzacott LLP, 130 Wood Street, London, United Kingdom, EC2V 6DL.
Target audience
This communication is intended for ‘Eligible Counterparties’ and ‘Professional’ clients only, as described under the UK Financial Services and Markets Act 2000 (“FSMA”) (and any amendments to it). It is not intended for ‘Retail’ clients and Lightman does not have permission to provide investment services to retail clients. Generally, marketing communications are only intended for ‘Eligible Counterparties’ and ‘Professional’ clients in the UK, unless they are being used for purposes other than marketing, such as regulations and compliance etc. The Firm may produce marketing or communication documents for selected investor types in non UK jurisdictions. Such documents would clearly state the target audience and target jurisdiction.
Collective Investment Scheme(s)
The collective investment scheme(s) – WS Lightman Investment Funds (PRN: 838695) (“UK OEIC”, “UK umbrella”), and WS Lightman European Fund (PRN: 838696) (“UK sub-fund”, “UK product”) are regulated collective scheme(s), authorised and regulated by the FCA. In accordance with Section 238 of FSMA, such schemes can be marketed to the UK general public. Lightman, however, does not intend to receive subscription or redemption orders from retail clients and accordingly such retail clients should either contact their investment adviser or the Management Company Waystone Management (UK) Limited (“Waystone UK”) in relation to any fund documents.
The collective investment scheme(s) - Elevation Fund SICAV (Code: O00012482) (“Luxembourg SICAV”, “Luxembourg umbrella”), and Lightman European Equities Fund (Code: O00012482_00000002) (“Luxembourg sub-fund”, “Lux product”) are regulated undertakings for collective investments in transferrable securities (UCITS), authorised and regulated by the Commission de Surveillance du Secteur Financier (CSSF) in Luxembourg. In accordance with regulatory approvals obtained under the requirements of the Law of 17 December 2010 relating to undertakings for collective investment, the schemes can be marketed to the public in Luxembourg, Norway, Spain, and Republic of Ireland. Lightman, however, does not intend to receive subscription or redemption orders from any client types for the Lux product and accordingly such client should either contact a domestic distributor, domestic investment advisor or the Management Company Link Fund Solutions (Luxembourg) S.A. (“Link Luxembourg”) in relation to any fund documents.
Luxembourg umbrella and Luxembourg sub-fund are also approved for marketing to professional clients and eligible counterparties in the UK under the UK National Private Placement Regime (NPPR). UK registration numbers for the funds are as follows: Elevation Fund SICAV (PRN: 957838) and Lightman European Equities Fund (PRN: 957839). Please write to us at compliance@lightmanfunds.com for proof of UK registration of the funds.
Luxembourg sub-fund is also approved for marketing to qualified investors in Switzerland, within the meaning of Art. 10 para. 3 and 3ter CISA. In Switzerland, the representative is Acolin Fund Services AG, Leutschenbachstrasse 50, 8050 Zurich, Switzerland, whilst the paying agent is NPB Neue Privat Bank AG, Limmatquai 1 / am Bellevue, 8024 Zurich, Switzerland.
Accuracy and correctness of information
Lightman takes all reasonable steps to ensure the accuracy and completeness of its communications; we however request all recipients to contact us directly for the latest information and documents as issued documents may not be fully updated. We cannot accept any liability arising from loss or damage from the use of this communication.
Wherever our communications refer to a third party such as Waystone, Link, Northern Trust etc., we cannot accept any responsibility for the availability of their services or the accuracy and correctness of their content. We urge users to contact the third party for any query related to their services.
Important information for non-UK persons (Including US persons)
This communication is not intended for any person outside of the UK, Switzerland, or the European Economic Area (EEA). Lightman or any of the funds referenced in this communication are not approved for marketing outside of the UK, Switzerland, or the EEA. All such persons must consult their domestic lawyers in relation to services or products offered by Lightman.
Risk warning to all investors
The value of investments in any financial assets may fall as well as rise. Investors may not get back the amount they originally invested. Past performance is not an indicator of future performance. Potential investors should not use this communication as the basis of an investment decision. Decisions to invest in any fund should be taken only on the basis of information available in the latest fund documents. Potential investors should carefully consider the risks described in those documents and, if required, consult a financial adviser before deciding to invest.
Offer, advice, or recommendation
No information in this communication is intended to act as an offer, investment advice or recommendation to buy or sell a product or to engage in investment services or activities. You must consult your investment adviser or a lawyer before engaging in any investment service or product.
GDPR
Lightman may process personal information of persons using this communication. Please read our privacy policy.
Copyright
This communication cannot be distributed or reproduced without our consent.