
At certain times in 2023, it has felt like quantitative easing (QE) has returned. Markets have seen sudden liquidity-driven price moves where expensive equities sharply outperformed. This was particularly the case from March to May and in November.
How can we have seen “QE-like” conditions with no QE? A deeper look into the Federal Reserve’s balance sheet shows that at certain times this year changes in specific components of the balance sheet have indeed resulted in sharp increases in liquidity. These changes more than offset quantitative tightening (QT).
The reason it felt like QE had returned was because in some ways, for certain months this year, it had.
The good news is that this stealth or hidden QE is close to running its course and will not be present for the majority of 2024, nor likely 2025. Tighter market liquidity in 2024 should set the scene for a broader year of outperformance by value. It may also limit the scope for positive absolute returns from growth equities and, in particular, the Technology sector.
A calm year for absolute returns, but volatility in relative performance
When looking at the distribution of monthly returns in 2023, value faced three very difficult months. It faced sharp relative drawdowns in March, May and November. Whilst value may have outperformed over more months than growth so far this year, it has not felt like it.
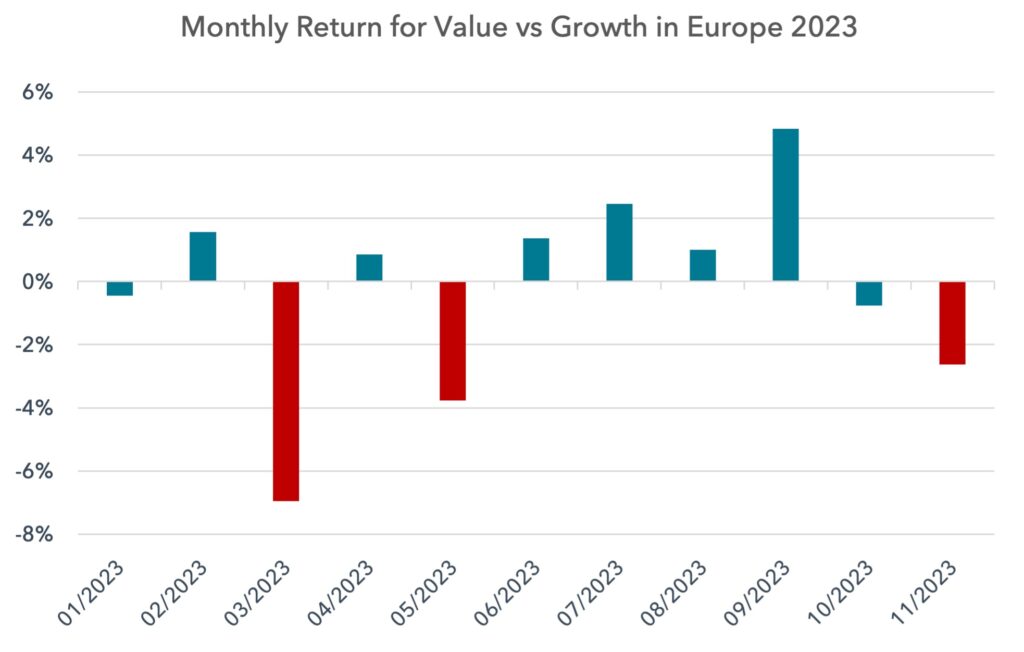
In each of those difficult months, value securities were left behind, with expensive securities leaping higher. Markets behaved as if liquidity suddenly changed. In order to assess this, we need to look into the Fed’s balance sheet.
Components of the Fed’s balance sheet
There are four components of the Fed Balance Sheet we need to focus on. It is the net change of all four added together that gives us the overall picture of market liquidity. Later in this note, we will show the net effect of these combined balances, but first we will show each individually.
1) Quantitative tightening
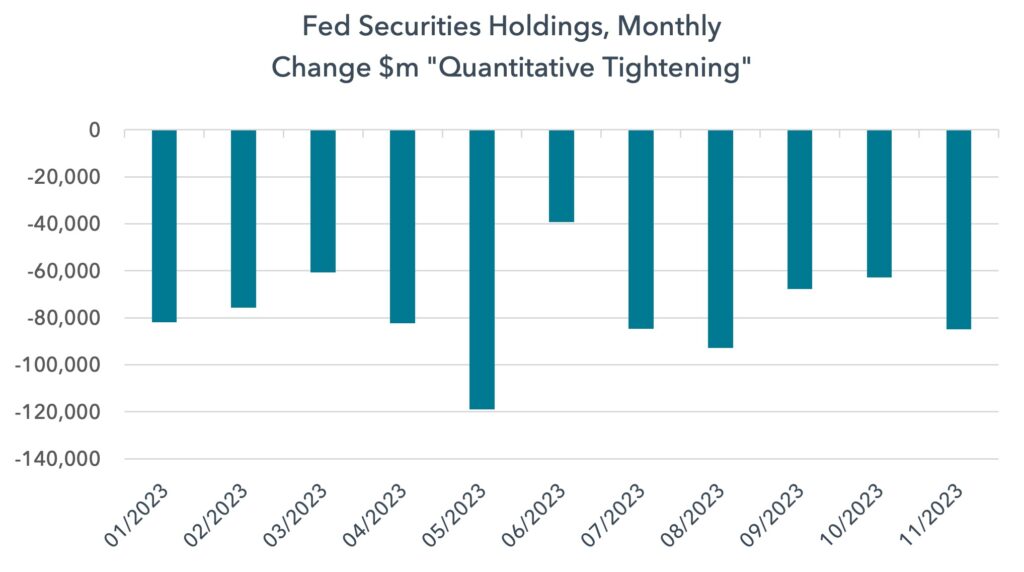
The first component that most investors monitor is the Fed’s securities holdings. This includes securities bought under quantitative easing which are now running down under quantitative tightening. Quantitative tightening has continued through 2023, as we show in the chart below, averaging just under $77bn per month.
As the Fed runs down its securities holdings, new buyers need to be found for them. This acts to drain liquidity from financial markets to the tune of $75-80bn per month.
2) Fed Emergency Loans
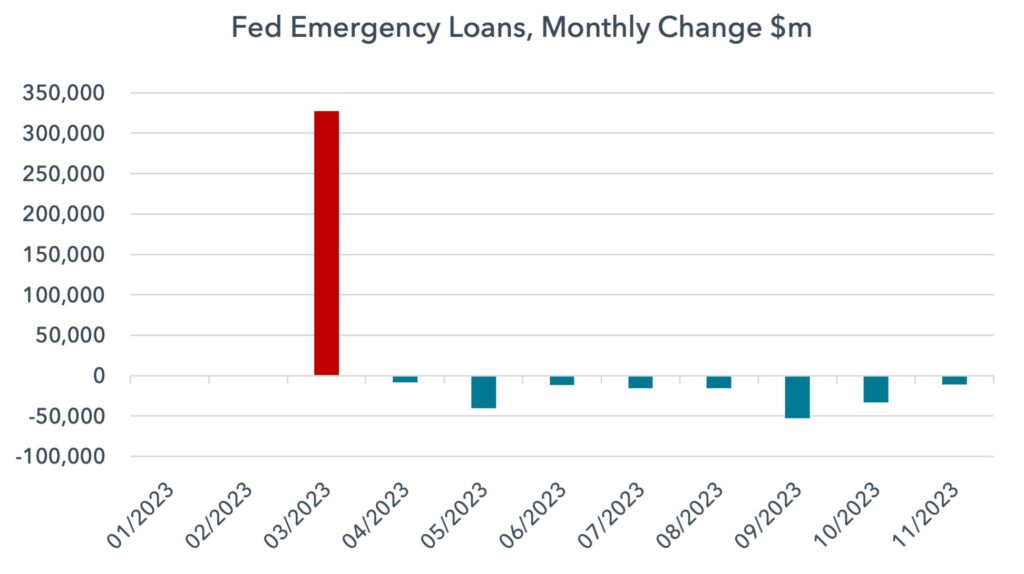
During the Financial Crisis, the Pandemic and also during the Silicon Valley failure in March this year, the Fed made emergency loans to certain financial institutions. In normal times, this balance does not move much, but in times of crisis it can amount to significant liquidity creation. In March 2023 this balance jumped by $327bn. This liquidity was an important support to markets at that time. Liquidity creation, at a large enough scale, can drive markets higher, irrespective of other forces.
3) The Treasury General Account
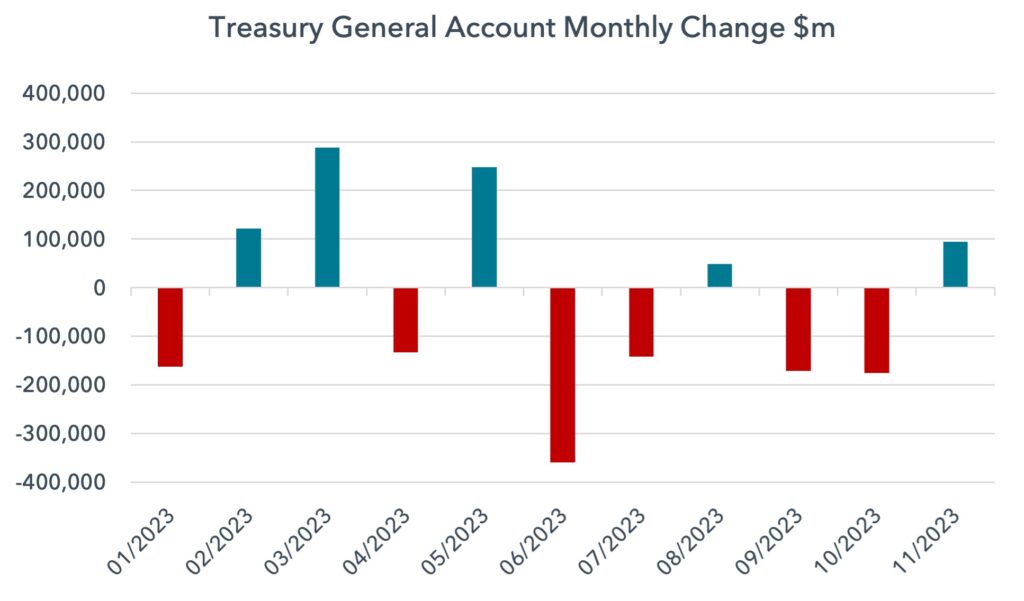
The Treasury General Account (TGA) is the Treasury’s checking account, where it keeps its cash, held at the Federal Reserve. The balance moves up and down according to US Government spending and revenue raising. Revenue can come from the receipt of tax payments or the sale of Treasury securities. Whilst the relationship is not perfect, from the point of view of market liquidity, as this balance moves higher, liquidity is broadly drained from financial markets; as it falls, liquidity is added. It can be understood like any other current account: as the balance rises, money is withdrawn from use and saved; as the balance falls, money is put to work and spent.
Earlier this year, as the debt ceiling impasse took place, the Treasury was not able to issue debt. This forced it to run down its TGA balance to fund government spending, acting to increase liquidity – there was no borrowing and so no drain from financial markets, and there was government spending on the other side.
In the chart below, at the risk of repetition, a decline in the balance amounts to an increase in market liquidity, whilst an increase in the balance amounts to a decrease in liquidity. When bars are coloured red, it denotes an expansion in liquidity, while blue denotes a contraction.
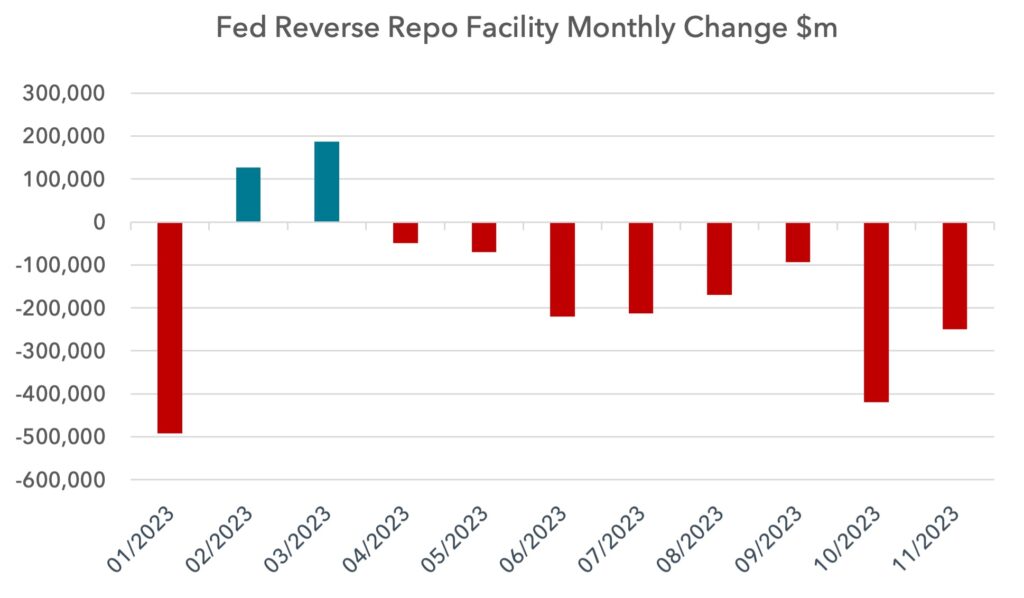
4) The Reverse Repo Facility
The final balance to consider is the Fed’s Reverse Repo Facility (RRP). This has played a big role in influencing market liquidity in 2023.
This facility is one of the Fed’s tools to control interest rates. It is designed for non-bank financial institutions like money market funds, and here the Fed pays an overnight interest rate for balances deposited by these institutions.
Money market funds typically have a choice of investing in short-dated Treasuries or the RRP. As interest rates rise and are expected to rise further, money market funds tend to be incentivised to deposit money at the RRP. As rates are expected to fall, money tends to leave the RRP and go into the Treasury market.
Due to the peculiarities of the financial system post-Covid, these balances became very large in recent years. In 2021 and 2022, the RRP facility grew sharply, rising from $10bn in February 2021 to $2.5tn in December 2022. As this balance rose, it acted to drain money from financial markets. During 2023, as investors have seen rate hikes coming to an end, the RRP has fallen sharply, adding liquidity back.
At the time of writing, the RRP is at $830bn, having started the year at $2550bn. As can be seen in the chart below, the monthly changes can be large. The average monthly liquidity increase from the RRP this year has been $150bn, with some periods seeing $400-500bn in a single month.
As with the TGA balance in the previous chart, a decline in this balance amounts to an increase in liquidity.
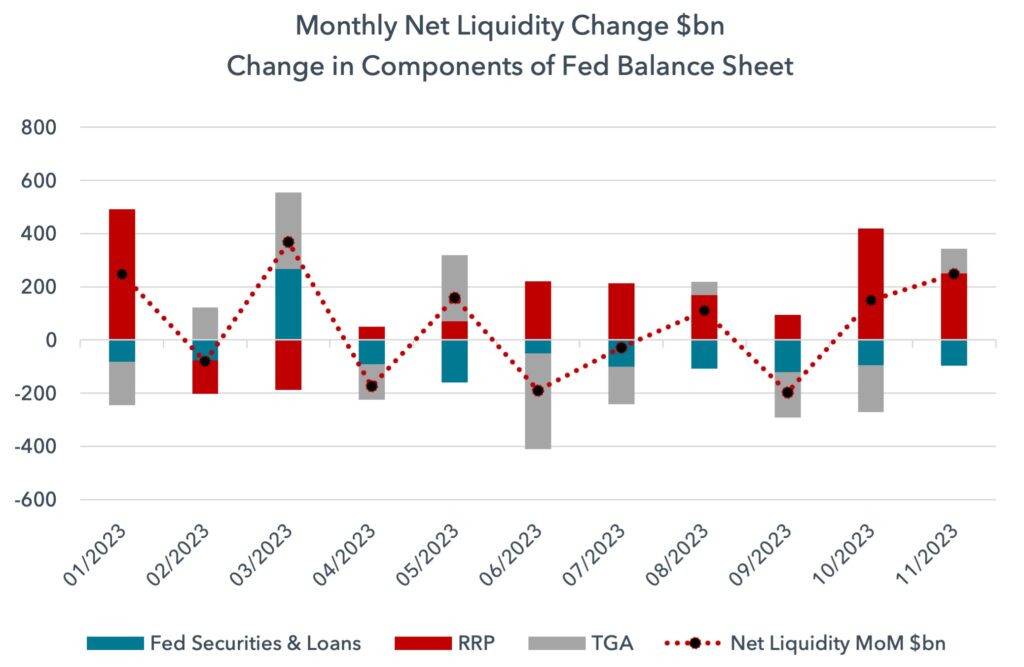
Aggregating all the changes in Fed balances to get a total monthly change in liquidity
Below we show how all the components have shifted by month to impact liquidity in 2023. We have put the Fed’s securities and loans into a single series. The bars show how the components changed month-on-month and the dotted line shows the net monthly change. In 2023 we saw liquidity creation in January, March, May, August, October and November.
The impact of this liquidity on markets
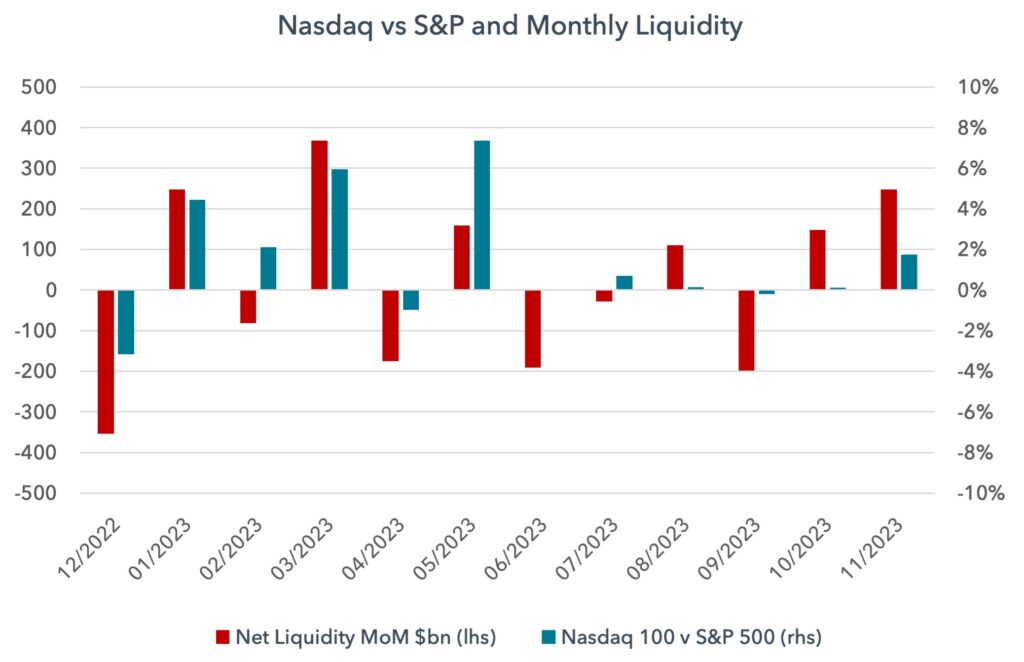
Growth vs value appears to be heavily impacted by this liquidity over the last year. In all months where growth outperformed value, liquidity expanded by $150bn in a single month. Every time there was less than $150bn liquidity expansion, value outperformed.
In the chart below, we show growth relative to value, where a reading above zero means growth is outperforming and a reading below zero means value is outperforming.

2023 has seen the Nasdaq outperform the S&P 500 quite consistently. But the bursts of outperformance appear strongest when there are large liquidity expansions, as we show below.
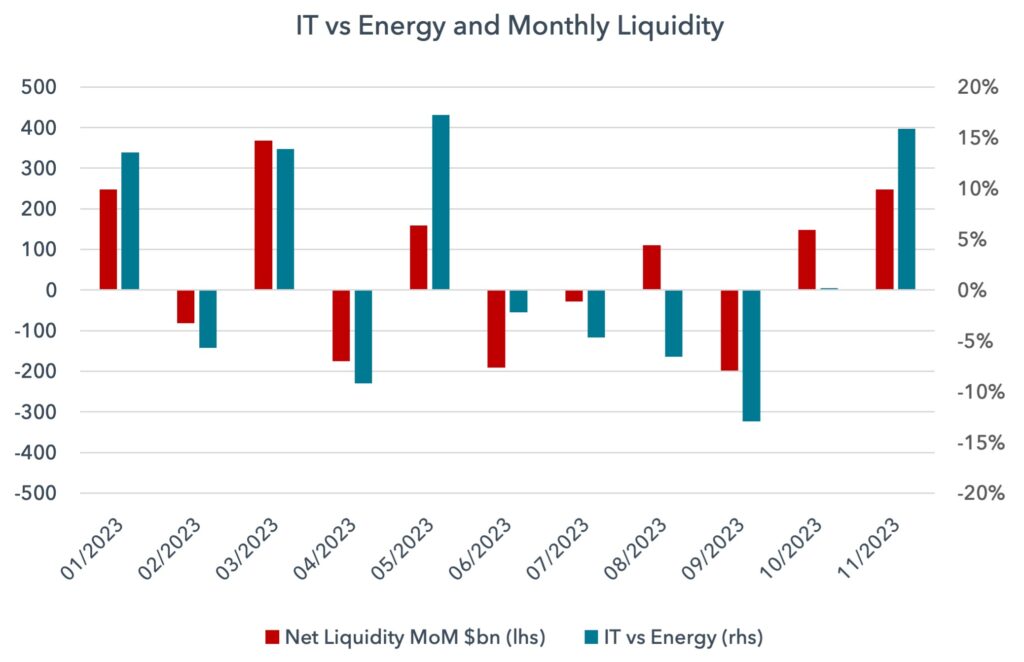
In a similar way, the IT sector appears to benefit from liquidity much more than the Energy sector. When liquidity has contracted, Energy has been defensive.
Within our own allocation to value, our overweights have shown themselves to be less sensitive to liquidity creation. Energy and Metals & Mining received no uplift when liquidity expanded. Similarly, they experienced no headwind when liquidity contracted. As these two sectors are large overweights, this has acted to hold the portfolios back in 2023.
The two most sensitive sectors to expanding liquidity are IT and Consumer Discretionary. We are close to zero weight these sectors. So both in our underweights and overweights, we have low sensitivity to liquidity. This is the major reason why our funds have lagged year to date. But this attribute ought to help the funds in 2024 and 2025 as liquidity conditions become less abundant and potentially contract.
Why might these relationships hold?
There is a possibility that these relationships are spurious and simply coincidental. But the quantitative easing era saw peculiar stock market behaviour relative to the last century. As we all know, value suffered significantly during QE. As soon as QE reversed and switched to QT, value decisively outperformed. This year, in the months where we have seen liquidity expand sharply, value has been held back once more.
The reason this relationship might hold could relate to mega-cap stocks capturing a higher market share of the liquidity, with growth stocks being dominant amongst mega-caps. It could also be to do with momentum and investment fashion – big liquidity creation finds itself flowing into fashionable large-caps, pushing them higher.
Why would commodity-facing equities be so insensitive to liquidity creation? It might be because commodity prices reflect the fundamentals of today, not tomorrow. They are priced off spot, reflecting the prevailing fundamental supply and demand dynamics each day. Liquidity flows ought not to be able to move underlying commodity prices in a meaningful way, and so the equities themselves should also be less sensitive.
There is also the duration argument that we have discussed before. Lower future interest rate expectations tend to lower the Reverse Repo balance, adding liquidity. But lower interest rate expectations may also lift the valuation of long-duration securities more than short-duration securities, driven by expected lower discount rates.
What about liquidity in 2024?
To come up with a picture of liquidity in 2024, we need to assess the outlook for all four Fed balances discussed above.
The Fed’s securities holdings should continue to decline through next year. QT is expected to continue at $75-$80bn per month. It is expected to end only when bank reserves fall to 8-10% of GDP, and this is not envisaged until 2025 at the earliest.
What about the chances of QE returning? The Fed has stated that QE is a policy only to be used when interest rates are at the effective zero bound. This means rates must first be cut to near-zero before QE would be considered. This suggests QE may never return, or if it does, it is a long way off, likely measured in years. For this reason, we assume QT continues at the same pace for the remainder of 2024.
We do not expect any change in liquidity from the Fed’s emergency loan programme.
The Treasury General Account is intended to be held at c.$750bn. This is deemed an appropriate balance for the US Government to hold for working capital purposes. This balance also acts as a buffer in the event of further disputes relating to the debt ceiling. The current balance is $753bn, so we forecast no change in the TGA next year.
The major source of liquidity that remains is from the Reverse Repo Facility. From its level of $830bn today, we anticipate it moving to zero at a rate of $150bn per month, in line with what has taken place in 2023. This suggests that the RRP balance would be liquidated by early May 2024.
Below is a table of the monthly liquidity change expected over the coming eight months.
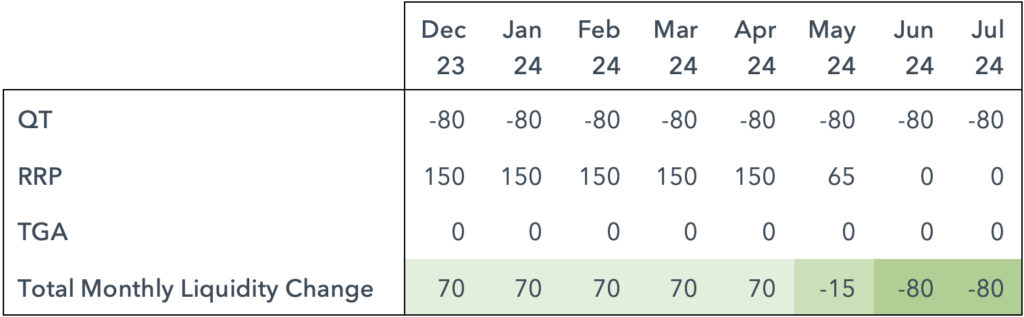
Whilst we can expect an expansion of liquidity for a few more months, the amounts are far smaller than we saw in the boom months of 2023. Here we saw expansions of $150bn to $370bn. It was only in those huge $150bn-plus expansions that value underperformed. A net $70bn that we forecast from December 2023 to April 2024 should not amount to a significant threat to value. As liquidity tightens through the year, we would expect value’s outperformance to accelerate.
What about interest rates in 2024?
Investors are discounting 125bps of rate cuts in the US and Europe over the next year. Could this amount to a significant tailwind for growth-style investing and a headwind for value? We would say no, for two reasons.
First, the major liquidity expansion from these potential rate cuts has already hit markets and is behind us. The decline in the RRP balance has created $1.7tn of liquidity this year. This injection of liquidity took place because of the perception of future rate cuts. As we have discussed above, 2024 sees QT continuing and “only” $830bn left in the RRP. This balance is not big enough to move the needle in 2024.
Second, it is the long end of the yield curve that matters for valuation, not the short end. Whilst the Fed can cut interest rates at the short end, it cannot drive down interest rates at the long end. As we have discussed in previous notes, the supply of bonds in the coming years is so high relative to demand, that it is hard to see long bond yields falling much more, even in recession.
To hold value back in 2024 we need to see ultra-low bond yields and this appears unlikely.
Why does growth investing appear to require such abundant liquidity and what does it mean for value?
There are many possible theories why growth investing needs nearly $150bn of monthly liquidity creation. One could be related to the size of the fiscal deficit. The US Government is borrowing c.$140-160bn per month to fund its deficit. Because it needs to find new buyers to fund this debt issuance, this amounts to a drain on market liquidity that sits outside the Fed’s balance sheet. Perhaps it is not a coincidence that central bank-driven liquidity needs to expand by this much to support expensive growth equities?
But perhaps a more compelling argument is that the fundamentals for value are so strong that only a deluge of liquidity can stop it from outperforming.
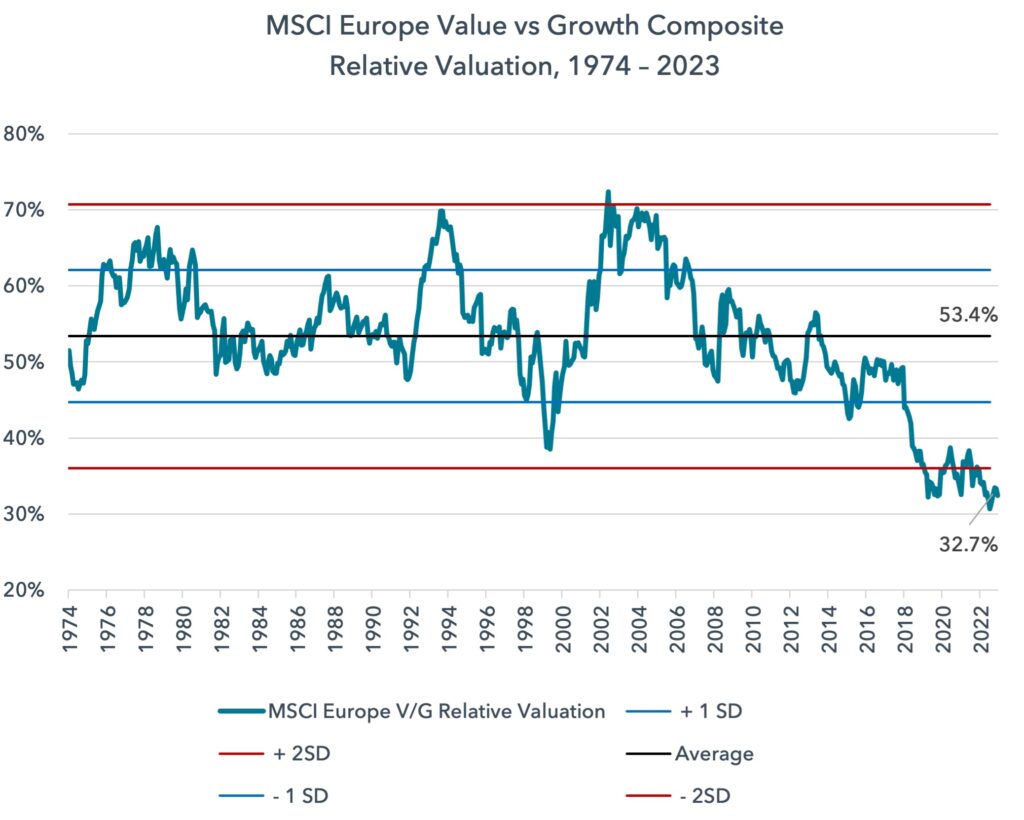
Value equities remain at a 50-year low in relative valuation compared to expensive growth equities. In the last 50 years, they have traded at an average valuation of 53% of the price of growth equities. Today the price is 33%. Returning to the 50-year average would require 60% outperformance in re-rating alone. As we have seen in recent years, many value companies are growing faster than growth companies and so earnings growth can provide more upside. The elastic band is pulled back. It does not take much for value to outperform, as we have seen in recent years.
This exercise has shown that we can put an approximate figure on what it takes to stop value outperforming. That number is $150bn per month. The good news is we are unlikely to see that level of liquidity creation in 2024, leaving us confident that value’s outperformance is set to return more broadly and decisively.
Sources:
Sources: The Federal Reserve; The New York Fed & Liberty Street Economics; Bill Dudley; Strategas; Renmac; Bloomberg; MSCI; Lightman Investment Management
Legal
Disclaimer
This communication and its content are owned by Lightman Investment Management Limited (“Lightman”, “we”, “us”). Lightman Investment Management Limited (FRN: 827120) is authorised and regulated by the Financial Conduct Authority (“FCA”) as a UK MiFID portfolio manager eligible to deal with professional clients and eligible counterparties in the UK. Lightman is registered with Companies House in England and Wales under the registration number 11647387, having its registered office at c/o Buzzacott LLP, 130 Wood Street, London, United Kingdom, EC2V 6DL.
Target audience
This communication is intended for ‘Eligible Counterparties’ and ‘Professional’ clients only, as described under the UK Financial Services and Markets Act 2000 (“FSMA”) (and any amendments to it). It is not intended for ‘Retail’ clients and Lightman does not have permission to provide investment services to retail clients. Generally, marketing communications are only intended for ‘Eligible Counterparties’ and ‘Professional’ clients in the UK, unless they are being used for purposes other than marketing, such as regulations and compliance etc. The Firm may produce marketing or communication documents for selected investor types in non UK jurisdictions. Such documents would clearly state the target audience and target jurisdiction.
Collective Investment Scheme(s)
The collective investment scheme(s) – WS Lightman Investment Funds (PRN: 838695) (“UK OEIC”, “UK umbrella”), and WS Lightman European Fund (PRN: 838696) (“UK sub-fund”, “UK product”) are regulated collective scheme(s), authorised and regulated by the FCA. In accordance with Section 238 of FSMA, such schemes can be marketed to the UK general public. Lightman, however, does not intend to receive subscription or redemption orders from retail clients and accordingly such retail clients should either contact their investment adviser or the Management Company Waystone Management (UK) Limited (“Waystone UK”) in relation to any fund documents.
The collective investment scheme(s) - Elevation Fund SICAV (Code: O00012482) (“Luxembourg SICAV”, “Luxembourg umbrella”), and Lightman European Equities Fund (Code: O00012482_00000002) (“Luxembourg sub-fund”, “Lux product”) are regulated undertakings for collective investments in transferrable securities (UCITS), authorised and regulated by the Commission de Surveillance du Secteur Financier (CSSF) in Luxembourg. In accordance with regulatory approvals obtained under the requirements of the Law of 17 December 2010 relating to undertakings for collective investment, the schemes can be marketed to the public in Luxembourg, Norway, Spain, and Republic of Ireland. Lightman, however, does not intend to receive subscription or redemption orders from any client types for the Lux product and accordingly such client should either contact a domestic distributor, domestic investment advisor or the Management Company Link Fund Solutions (Luxembourg) S.A. (“Link Luxembourg”) in relation to any fund documents.
Luxembourg umbrella and Luxembourg sub-fund are also approved for marketing to professional clients and eligible counterparties in the UK under the UK National Private Placement Regime (NPPR). UK registration numbers for the funds are as follows: Elevation Fund SICAV (PRN: 957838) and Lightman European Equities Fund (PRN: 957839). Please write to us at compliance@lightmanfunds.com for proof of UK registration of the funds.
Luxembourg sub-fund is also approved for marketing to qualified investors in Switzerland, within the meaning of Art. 10 para. 3 and 3ter CISA. In Switzerland, the representative is Acolin Fund Services AG, Leutschenbachstrasse 50, 8050 Zurich, Switzerland, whilst the paying agent is NPB Neue Privat Bank AG, Limmatquai 1 / am Bellevue, 8024 Zurich, Switzerland.
Accuracy and correctness of information
Lightman takes all reasonable steps to ensure the accuracy and completeness of its communications; we however request all recipients to contact us directly for the latest information and documents as issued documents may not be fully updated. We cannot accept any liability arising from loss or damage from the use of this communication.
Wherever our communications refer to a third party such as Waystone, Link, Northern Trust etc., we cannot accept any responsibility for the availability of their services or the accuracy and correctness of their content. We urge users to contact the third party for any query related to their services.
Important information for non-UK persons (Including US persons)
This communication is not intended for any person outside of the UK, Switzerland, or the European Economic Area (EEA). Lightman or any of the funds referenced in this communication are not approved for marketing outside of the UK, Switzerland, or the EEA. All such persons must consult their domestic lawyers in relation to services or products offered by Lightman.
Risk warning to all investors
The value of investments in any financial assets may fall as well as rise. Investors may not get back the amount they originally invested. Past performance is not an indicator of future performance. Potential investors should not use this communication as the basis of an investment decision. Decisions to invest in any fund should be taken only on the basis of information available in the latest fund documents. Potential investors should carefully consider the risks described in those documents and, if required, consult a financial adviser before deciding to invest.
Offer, advice, or recommendation
No information in this communication is intended to act as an offer, investment advice or recommendation to buy or sell a product or to engage in investment services or activities. You must consult your investment adviser or a lawyer before engaging in any investment service or product.
GDPR
Lightman may process personal information of persons using this communication. Please read our privacy policy.
Copyright
This communication cannot be distributed or reproduced without our consent.