
- Problems remain but the global economy may beat deeply pessimistic expectations for the remainder of the year
- There is logic behind the Fed pausing interest rate hikes at a lower peak than is discounted
- Well positioned cyclicals operating in supply constrained industries can beat earnings expectations and are at low valuations
- Index valuations remain constrained over the long term by the oil price and interest rates
- Expensive securities are becoming vulnerable again, which may limit the scope of equity index recovery
A lot has happened in the last six weeks. Value has given back 10% of its performance versus growth and recession fears have become consensus. Whilst we expected a pullback as we noted in late June, the adjustment has been deeper than we thought. The speed and sharpness of the moves at least offer a silver lining. Valuations and expectations now allow for a higher probability of outperformance for value for the remainder of the year. As such we view this pullback as a good opportunity to add to value equities and to rotate out of expensive growth stocks.
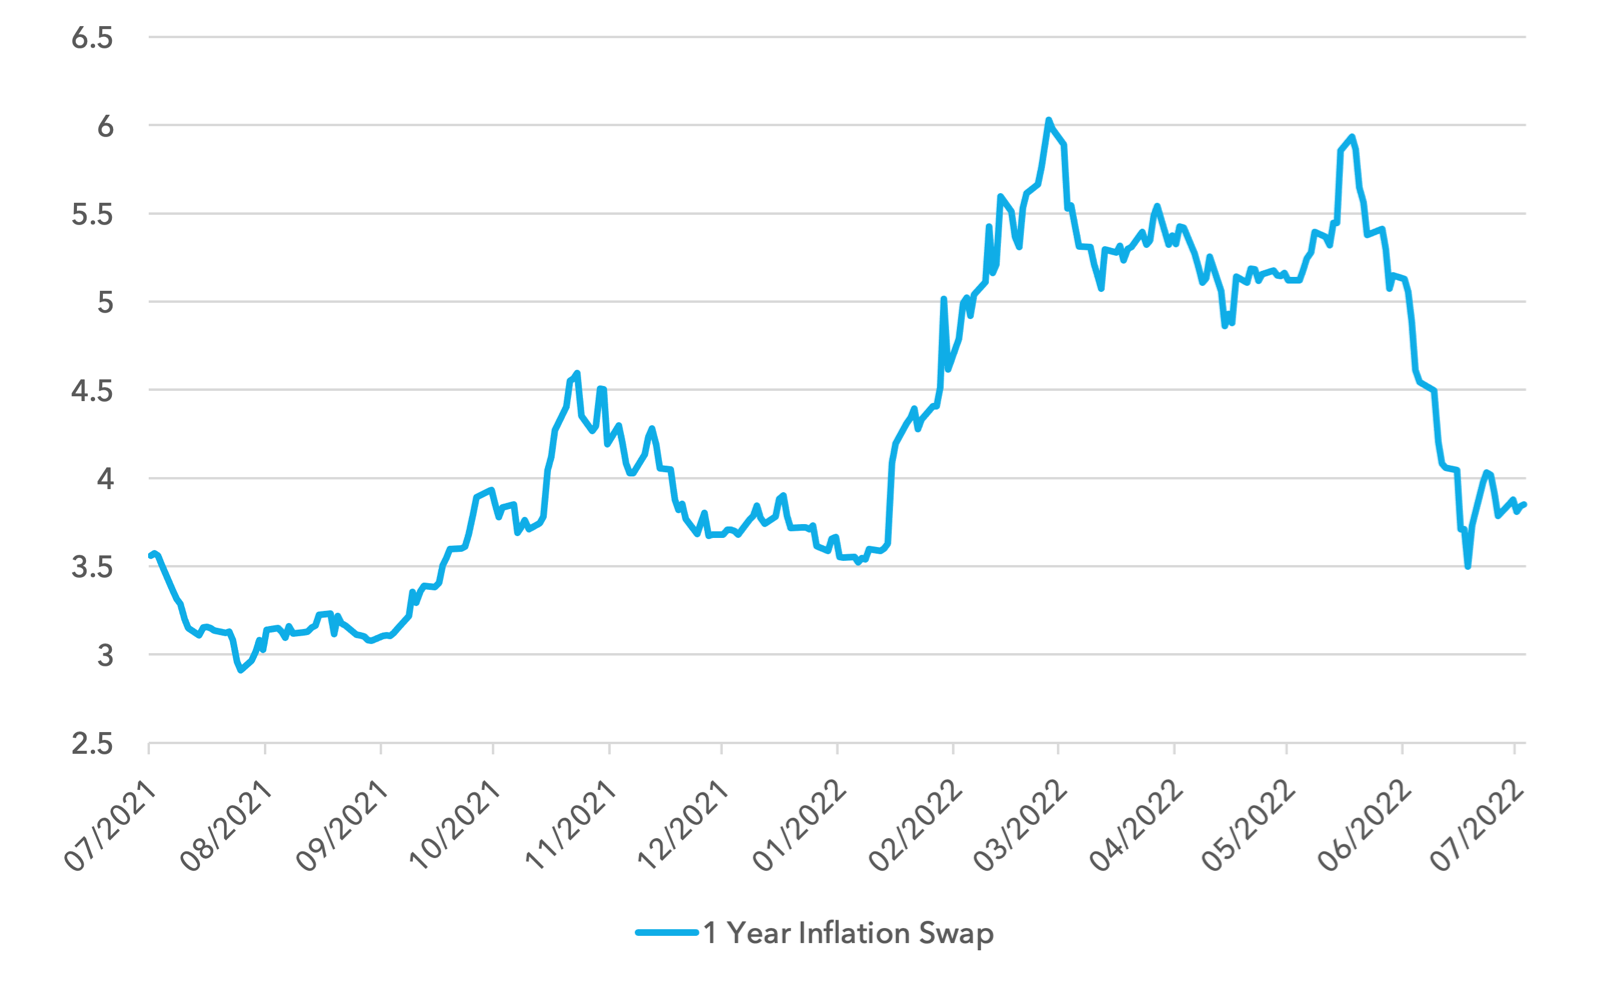
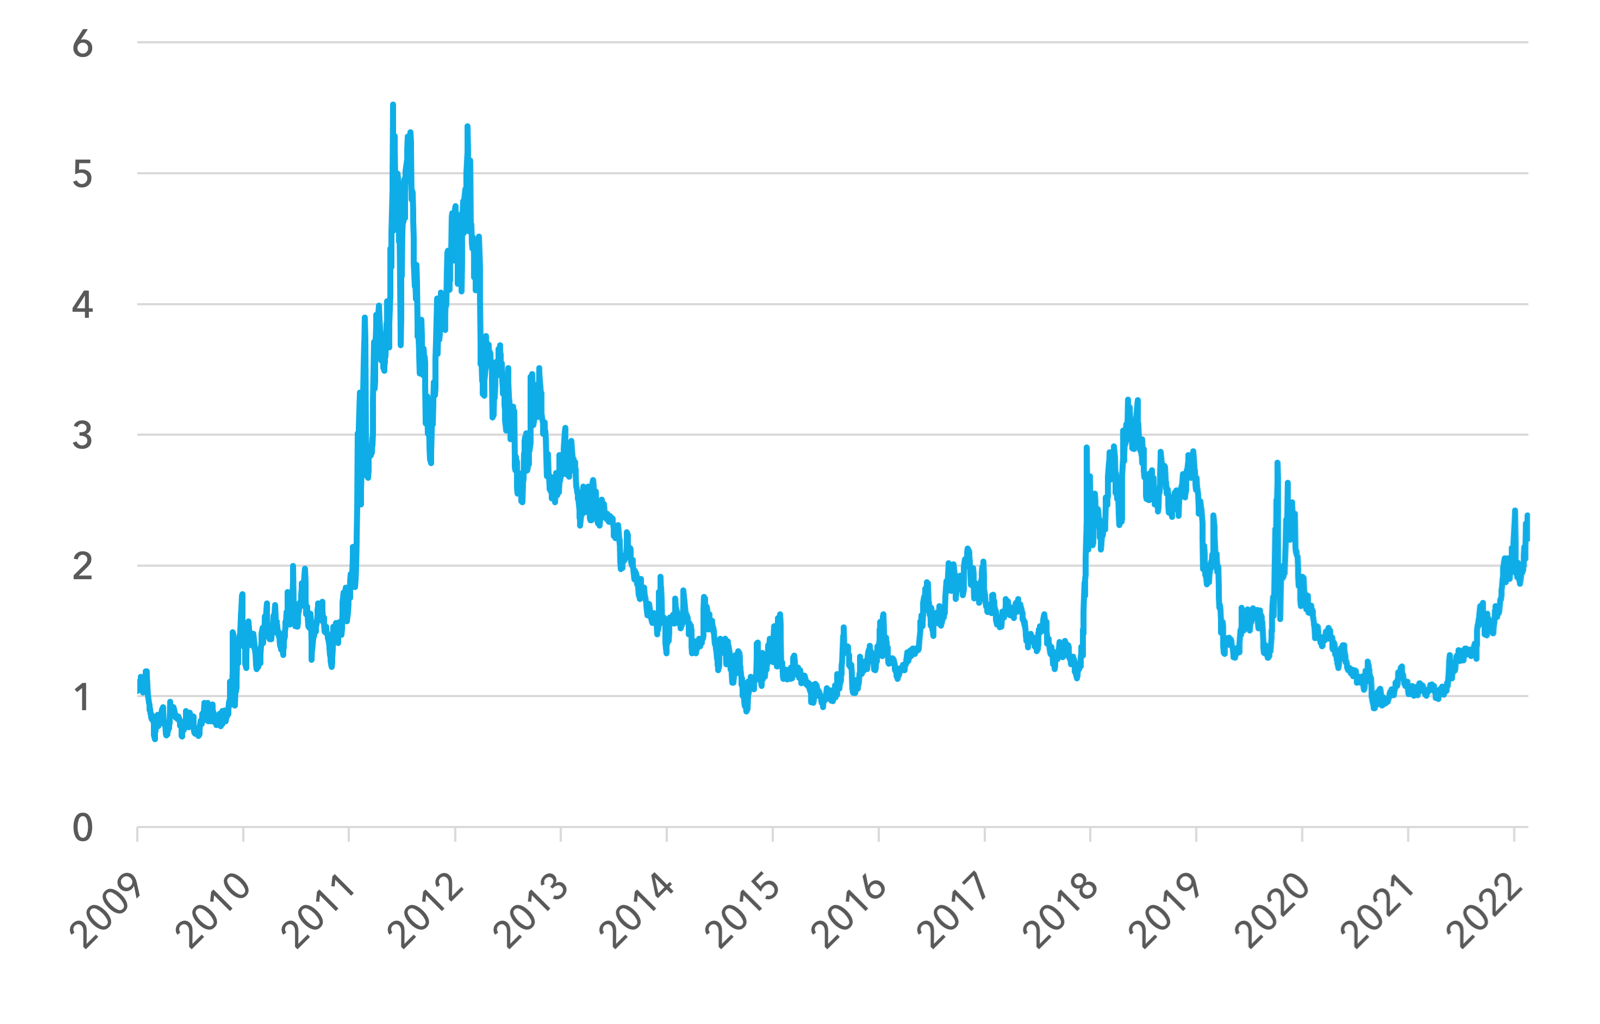
A few big market perception changes stand out. Inflation expectations have fallen sharply in the US, with investors assuming the Fed and cyclical forces will bring inflation down sharply. Below we show the 1 year inflation swap in the US. It has fallen from nearly 6% to 3.8% in less than two months.
1 Year Inflation Swap
This has resulted in an incredible decline in interest rate expectations in 2023. Investors now expect 75bps of rate cuts during 2023, having expected a hike just two months ago. This forecast is being driven by high conviction that the Fed is committed to making a policy mistake, recession is imminent and weakness in demand will drive inflation lower quickly.
Dec 2023 Interest Rates versus Dec 2022 Interest Rates
(Eurodollar Futures)
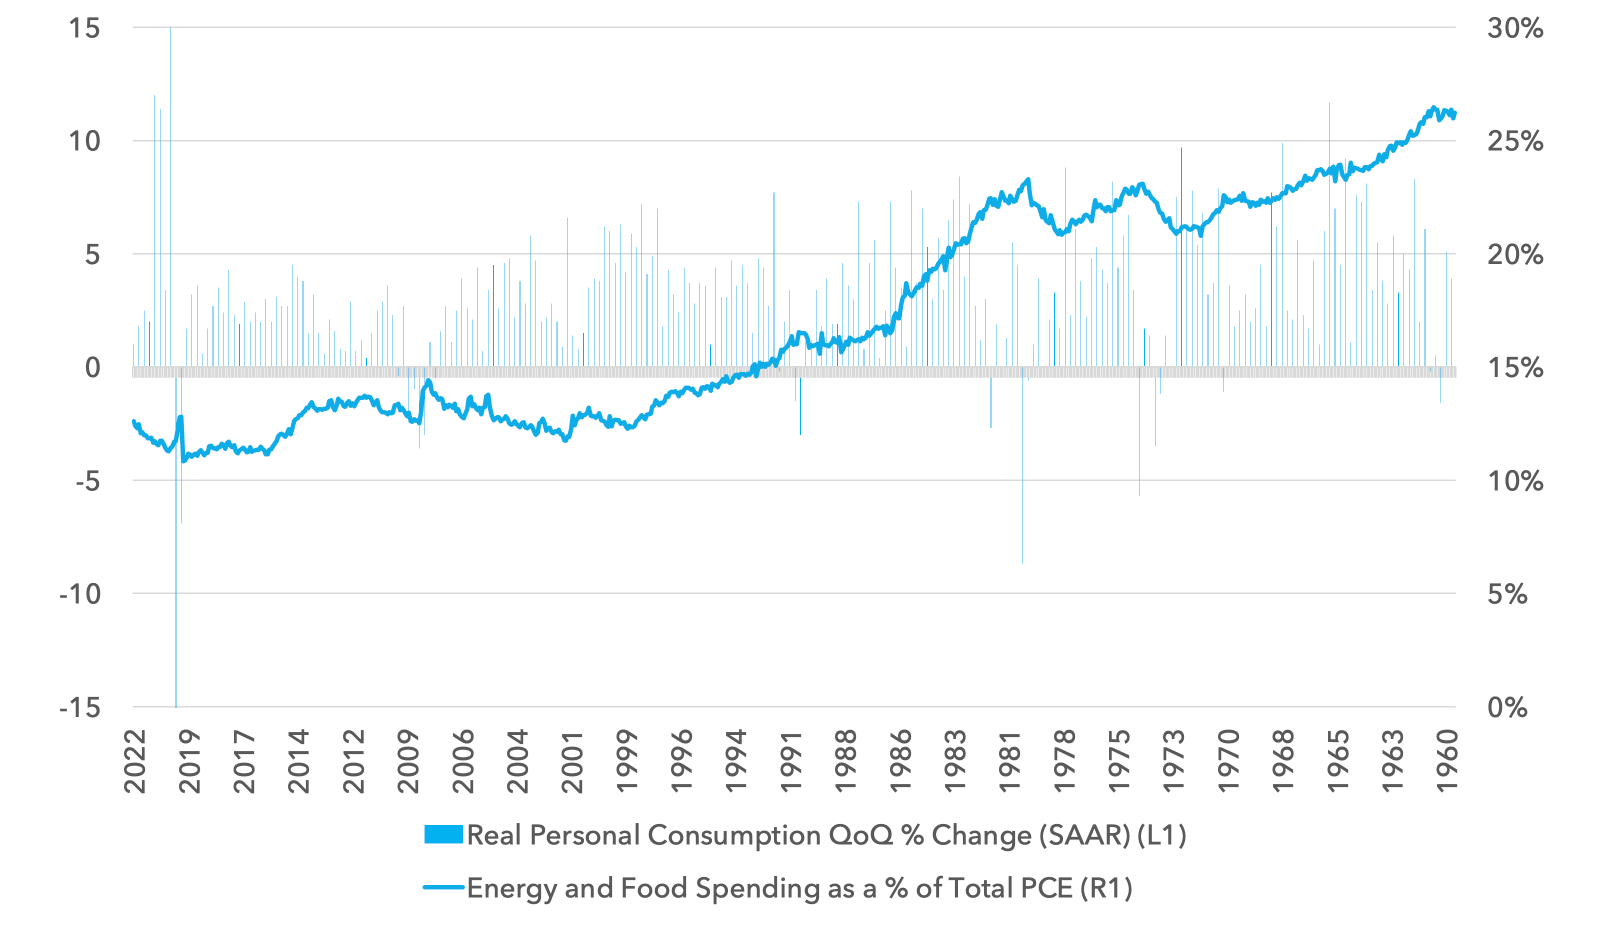
There are certainly supportive arguments for a recession. Food and energy are rising as a proportion of disposable spending and so mechanically, less money is available for consumption. Discretionary spending must slow and potentially meaningfully. Below we show the relationship between food and energy spending and consumption. In the past, rises of 2-2.5% in food and energy as a percentage of consumption have resulted in consumer recessions. The recent rise is 1.8%. Given we do not foresee a sharp drop in oil or food prices this pressure is set to persist.
Food & Energy Spending as % of Consumption & Quarterly Consumption Growth 1960 – 2022
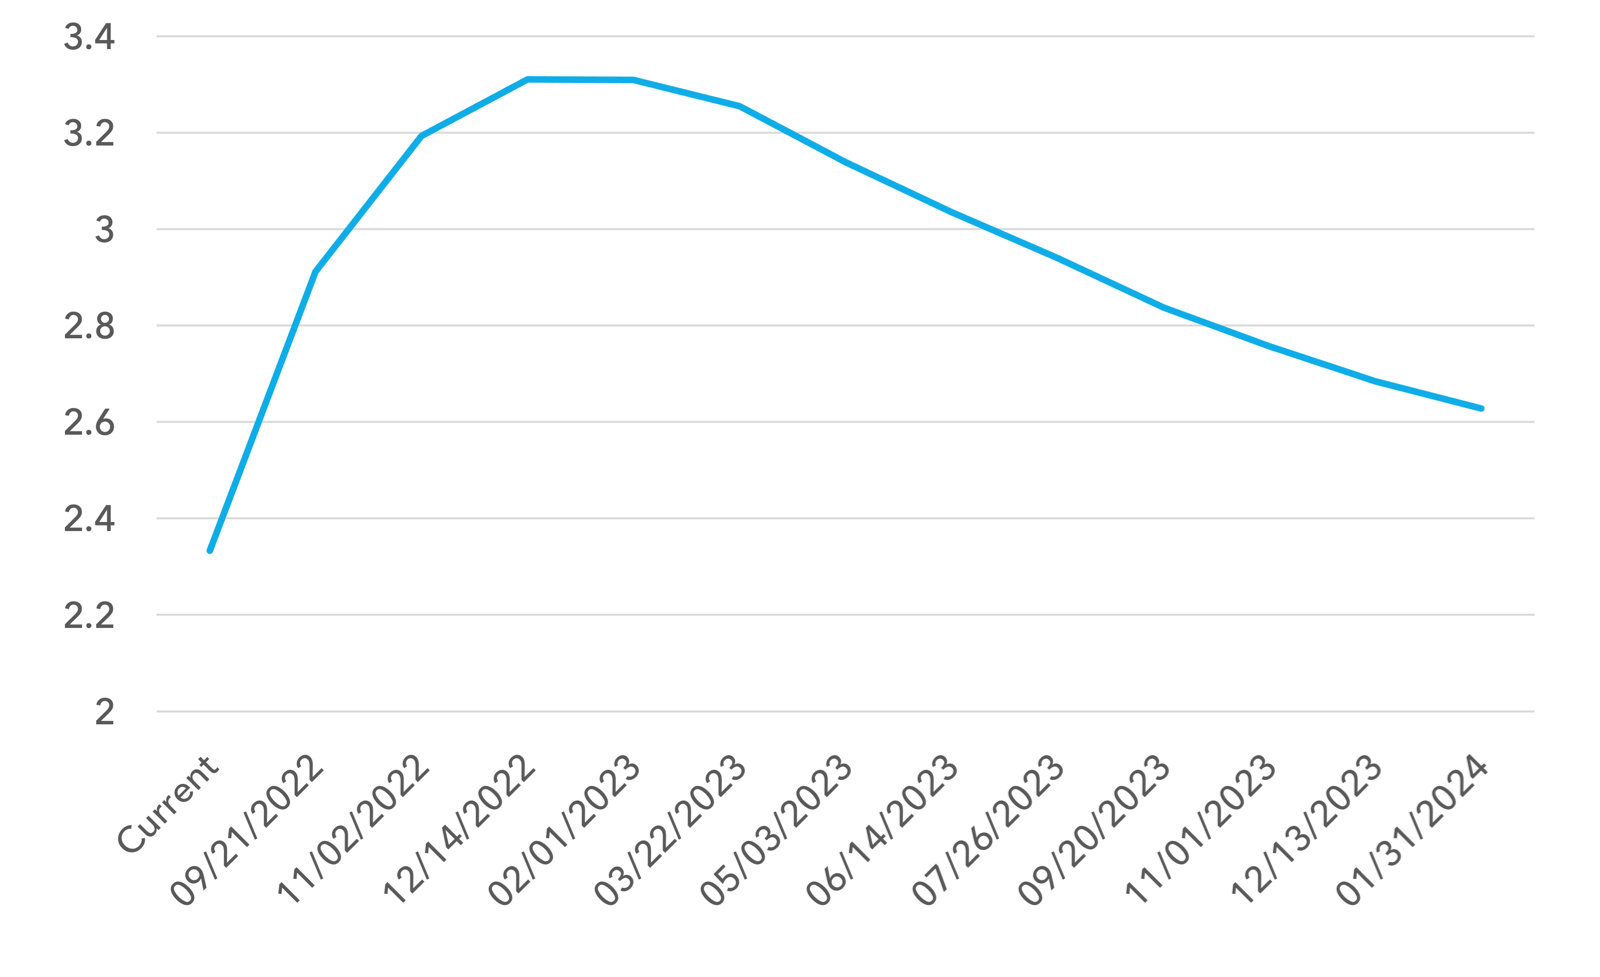
But there may be some temporary optimism in relation to the actions of the Federal Reserve. Why is the market so certain that the Fed will make a policy mistake, especially with inflation moderating for the remainder of the year? Today, the market expects another 100bps of tightening followed by a quick bout of easing, as we see in the Implied Policy Rate curve below. This is odd. More likely the Fed will hike less than expected, eg: a further 50 basis points – and then pause. An earlier pause in rate hikes is a lower risk approach. For base effect reasons, headline inflation will be moderating later this year and so the risk of inflation expectations becoming further unanchored during Q4 will be low. This may give the Fed some cover to pause hikes at a lower level and wait. The Fed can then monitor the effects of their hikes to date. Having hiked less than is currently discounted, deep recession fears can subside, with less likelihood for rate cuts in 2023.
Implied Fed Funds Policy Rate (%)
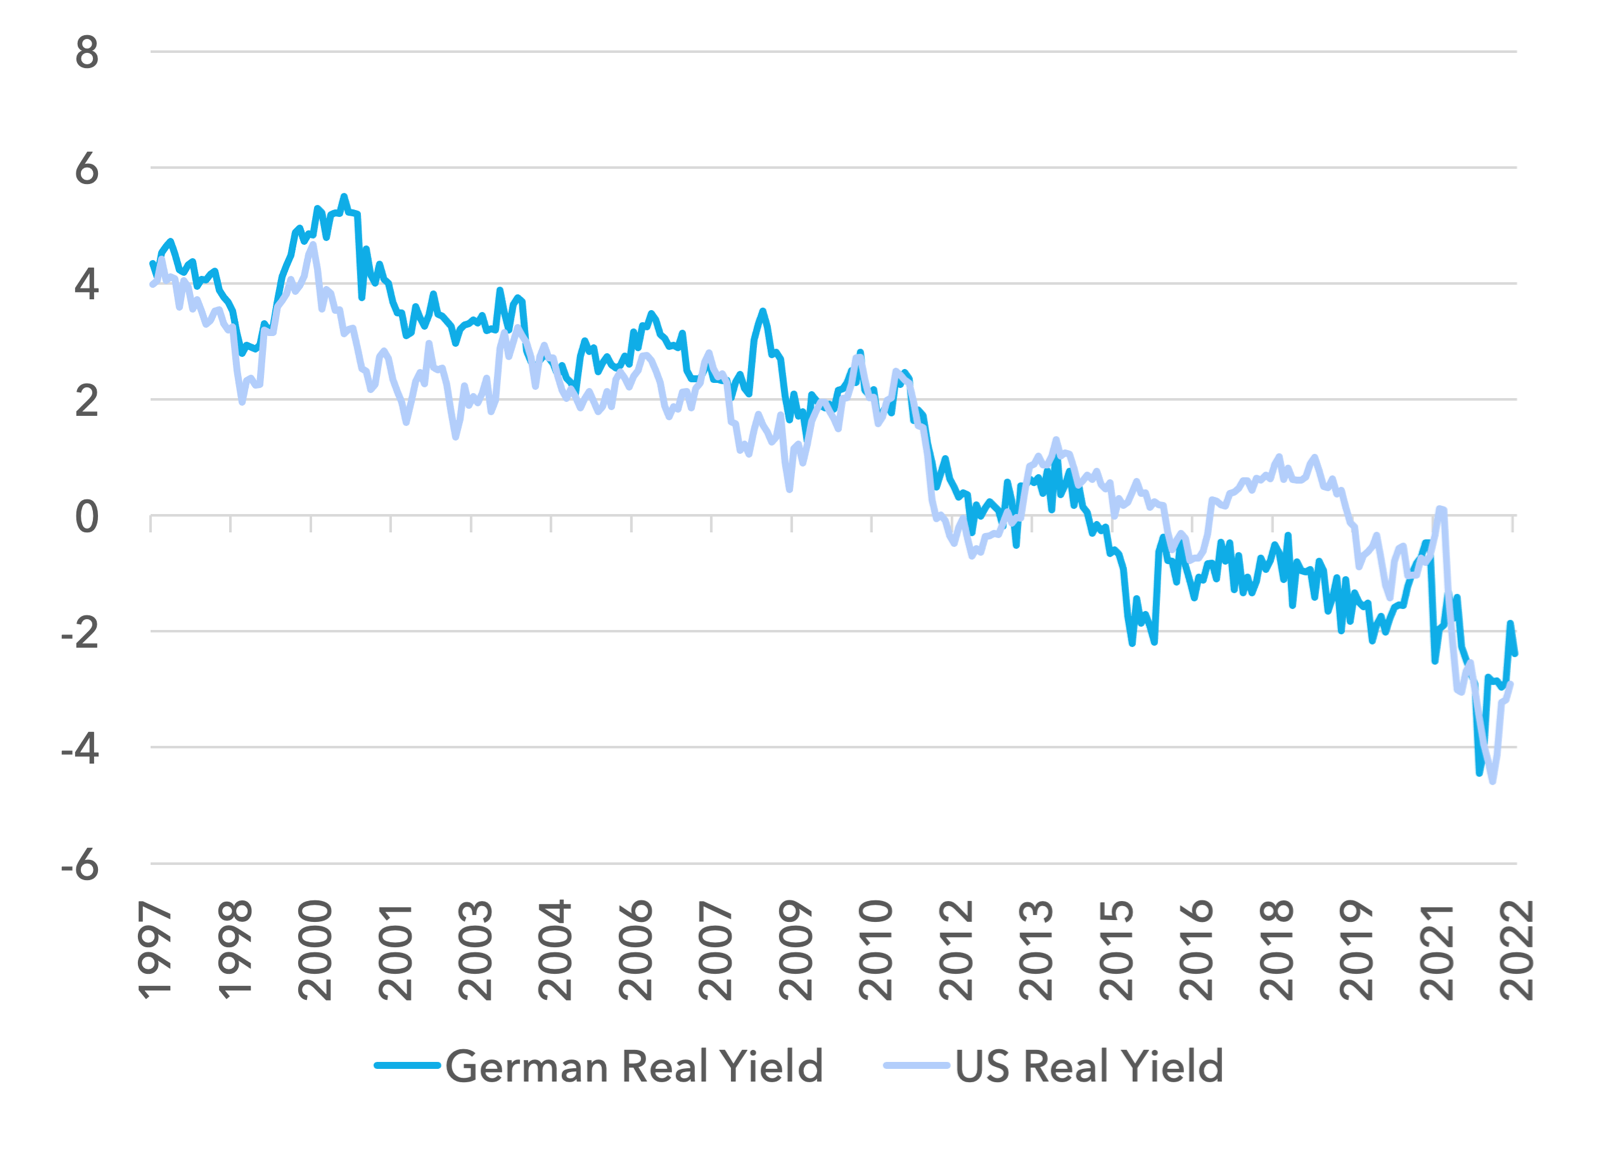
Whilst the cost of living squeeze is a significant drag on the economy, interest rates remain at record low levels relative to core CPI. It is hard to make the case that financial conditions are extremely tight. Allied with slightly less interest rate hikes, this may give the economy the ability to beat low expectations through year end. Below we show German and US real yields using core CPI. Whilst we are off the absolute lows, real yields have never been at this level in 25 years. This argument does not make the case for a recovery in economic momentum, but it may allow for a less severe outlook than is discounted for the time being.
German and US Real Yields
Based on 10 Year Minus Core CPI
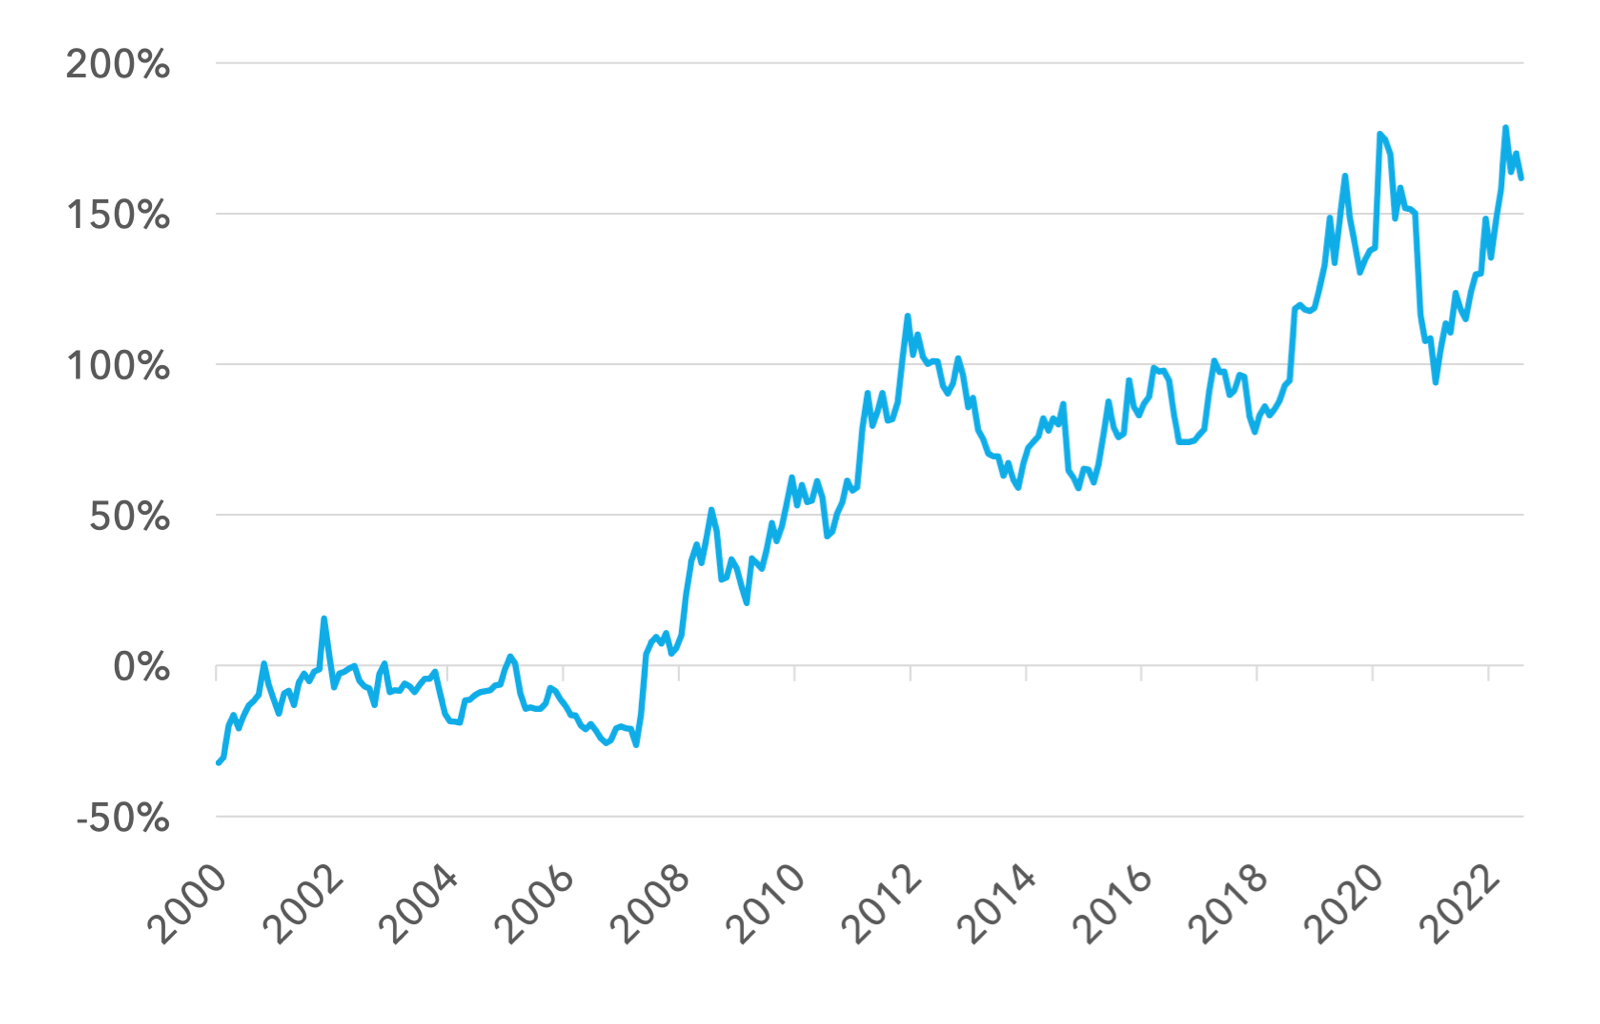
One way of assessing what is discounted and the extent of pessimism about this cycle is to look at the relative valuations of safe havens. Nestlé is Europe’s ultimate safe haven stock. Pre-financial crisis it traded in line with the benchmark. Whilst it has delivered quite well operationally, it’s multiple has been greatly increased by quantitative easing and ultra-low interest rates over the last decade. Today, the stock is approaching the same 170% record valuation premium to the benchmark as during the peak of pandemic anxiety in March 2020. This is a clear expression of how much fear about the economic cycle is embedded in European equities. Recession is priced in, in relative terms. We would expect Nestlé to underperform for the remainder of the year by a wide margin.
Nestlé Price to Sales Premium vs Benchmark
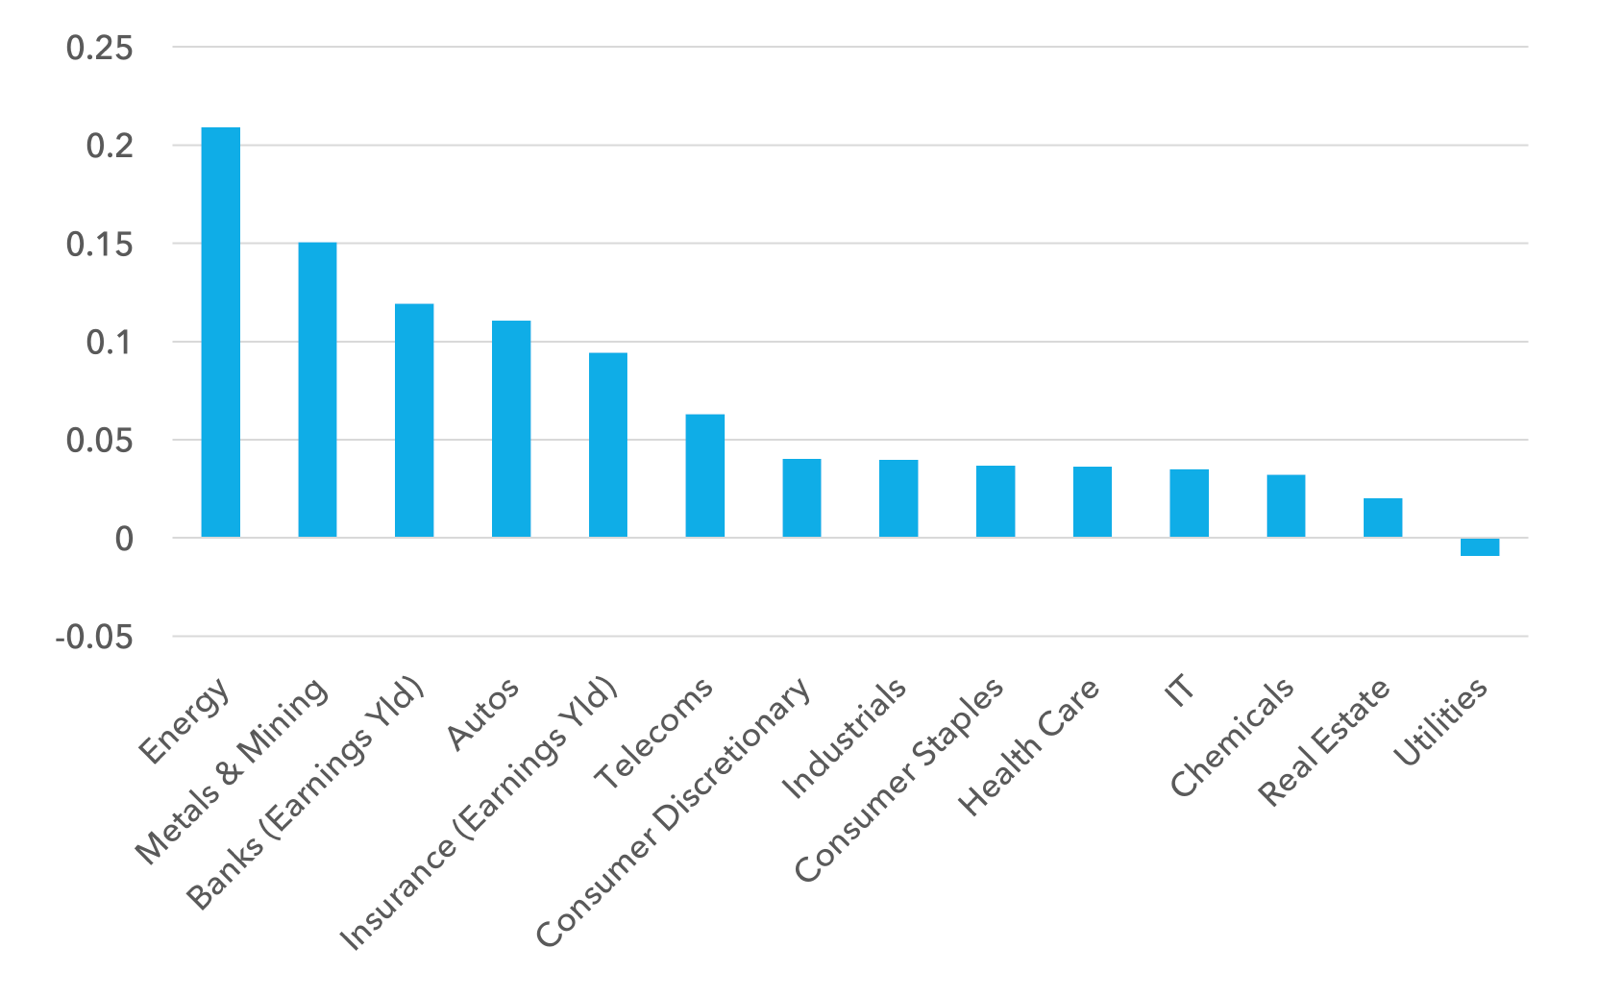
The other side of the coin to Nestlé’s premium is the cheapness of certain cyclicals today. Below we show 2022 median free cashflow yields by sector. For Financials we show the 2022 earnings yield. Energy is simply stunningly cheap as is the Metals and Mining sector. Banks also stand out. Autos are cheap but face a consumer squeeze. Telecoms also have pockets of great value. What is also clear is the absence of value in conventional defensives and IT. There is a significant premium in defensiveness that may not be warranted in the coming months.
European Sector 2022 Median Free CashFlow Yields
(Financials Show Earnings Yield)
What positions have changed in the Fund?
We have added to Energy on weakness, maintaining our full overweight. We had trimmed Energy back in May but expected only a shallow dip, and started to add back in June. This was one month too early. Our Energy positions cost the fund performance from mid-June to mid-July but are starting to add alpha over the last week.
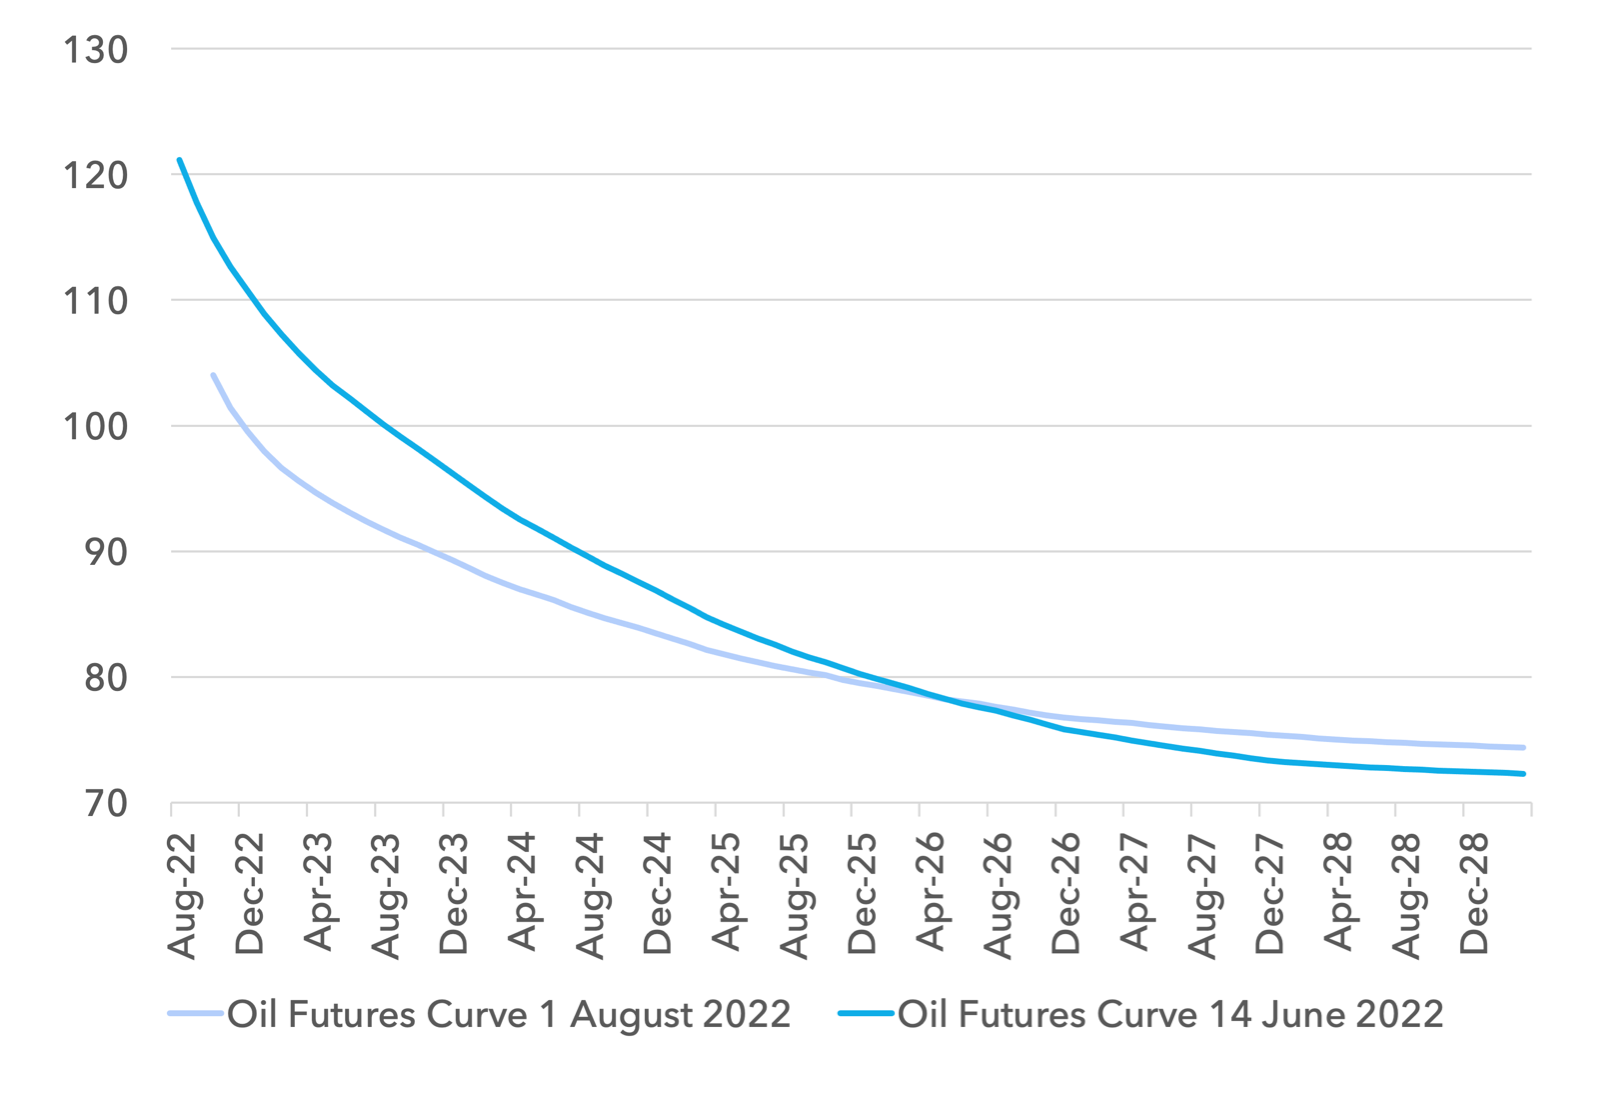
Below we show the oil futures curve, including one curve that is up to date and one dated from mid-June. What is particularly striking is that whilst spot oil prices fell on recession fears, the long end of the curve actually went up over the same period. Oil equities should be valued by prices at the long end of the curve, and here the fundamentals have improved. Share prices have fallen 15% but valuation targets have risen. Energy has been a great performer over the last twelve months and we see this continuing.
Oil Futures Curve August 1st 2022 vs mid June 2022
Banks have also sold off on recession fears and we have added to our positions on recent weakness. Owning banks into a very possible European consumer recession sounds extremely contrarian, but we see significant fundamental upside for the best positioned banks. We see higher rates supporting net interest margins and contained loan loss provisions for our holdings.
We believe the ECB will hike interest rates somewhat faster than expected to the 1% level. The ECB needs to attempt to stop the Euro falling since it is exacerbating both the energy squeeze and inflation. A quicker series of rate hikes can facilitate this. This will drive an expansion in bank net interest margins that can drive earnings upgrades for the sector. The key will be to avoid the downside of loan loss provisions in a recession. We are confident that the lending standards and geographic exposure of our banks will diminish this downside risk, whilst capturing the upside of higher rates. We also expect European governments to partially subsidise the energy squeeze.
There are certainly pockets of vulnerability in European banking. We are cautious of geographies with high exposure to Russian gas. We are also cautious of large consumer unsecured lending and commercial real estate lending that is not well collateralised. We also do not see significant earnings upgrades within Investment Banking. We prefer Spanish, Irish, Swedish, Danish and Dutch retail banks with strong lending standards. Valuations are back to near record lows with the sector at 0.5x book, PE ratios of 5-6x and dividends at 7-8%.
Inflationary recessions and deflationary recessions create very different outcomes for banks. An inflationary recession is considerably more benign than deflation. Inflation reduces the value of today’s debt burden in tomorrow’s money, making it easier to manage that debt and pay it down. This reduces the risk of loan loss experience for banks. In deflation it is the reverse. In today’s inflationary crisis, shortages also extend to labour, reducing the scope of widespread unemployment, helping creditworthiness. Inflation also reduces the potential for large declines in collateral values.
The banks index has underperformed the benchmark by 15% since June. In absolute terms prices are back to their July 2012 lows, at the exact level when Draghi made his “whatever it takes speech” at the peak of the Sovereign debt crisis. This is extraordinary. That 2012 moment was an existential crisis for a sector that was short of capital, had a large bad debt burden and further interest rate declines to come. Today there is significant excess capital, low bad debts, with interest rates rising for the first time in 15 years. Lending standards have now been strong for over a decade, arguing for much higher resilience throughout the loan book even in the face of recession. Higher interest rates mechanically lift earnings. So a future recession must cause significant unemployment to drive loan losses to offset these gains. We do not see this recession driving the kinds of unemployment needed to justify today’s valuations.
Like Energy, Banks is another sector where pessimism is excessive and expectations can be beaten. The 7-8% dividend yield can be sustained and grown, even in a weak economic environment. A less negative environment for global economic growth than discounted ought to drive multiple expansion for the banks sector on top of earnings growth.
Another cause for the banks discount is the perception of a return of the Sovereign debt crisis. Whilst the formation of a new Italian government in September can cause some volatility, a lot of risk is priced in. Today Italian 10 year spreads are at c.225bps vs 500bps in 2012 and 300bps in 2018.
Italian 10 Year Yield Spread Over Bunds
Our more optimistic take on Italian solvency rests on the following points:
- Excluding the impacts of the Ukraine war, Italy runs a current account surplus compared to a deficit of 3% in 2011-12. This means Italy is a creditor to the rest of the world – the country sells more than it buys in aggregate and is accumulating wealth. It is extremely rare for a Sovereign debt crisis to occur with a country running a current account surplus.
- Italy’s high Sovereign debt is partly a function of lower household debt. Only Slovakia, Slovenia and the Baltics have lower household debt to GDP in the Euro area. Italy’s total debt to GDP ratio does not stand out vs the rest of the EU.
- Europe has started fiscal transfers. Post Covid, German taxpayers have, in effect, made grant payments to other EU countries amounting to a form of fiscal union. Italian solvency is now firmly intertwined with the solvency of the EU as a whole.
- The ECB now has mechanisms to buy Sovereign debt that did not exist in 2012, and has just added more flexibility with their newly announced TPI (Transmission Protocol Instrument).
- Deflation exacerbates the problems of indebted countries, whilst inflation reduces those risks. Higher inflation means higher nominal GDP growth, making it easier to reduce Italy’s debt burden over time.
The combination of recession and Sovereign debt anxieties have pushed bank valuations to near record discounts. For this reason we have added to the sector throughout this month. As of late July the fund is back to a full weight of 30%. We see low valuations and earnings being delivered better than consensus for the remainder of 2022 and through 2023, irrespective of the economic growth rate.
LF Lightman European Fund Sector Alpha Contribution
YTD to end May & YTD to end July
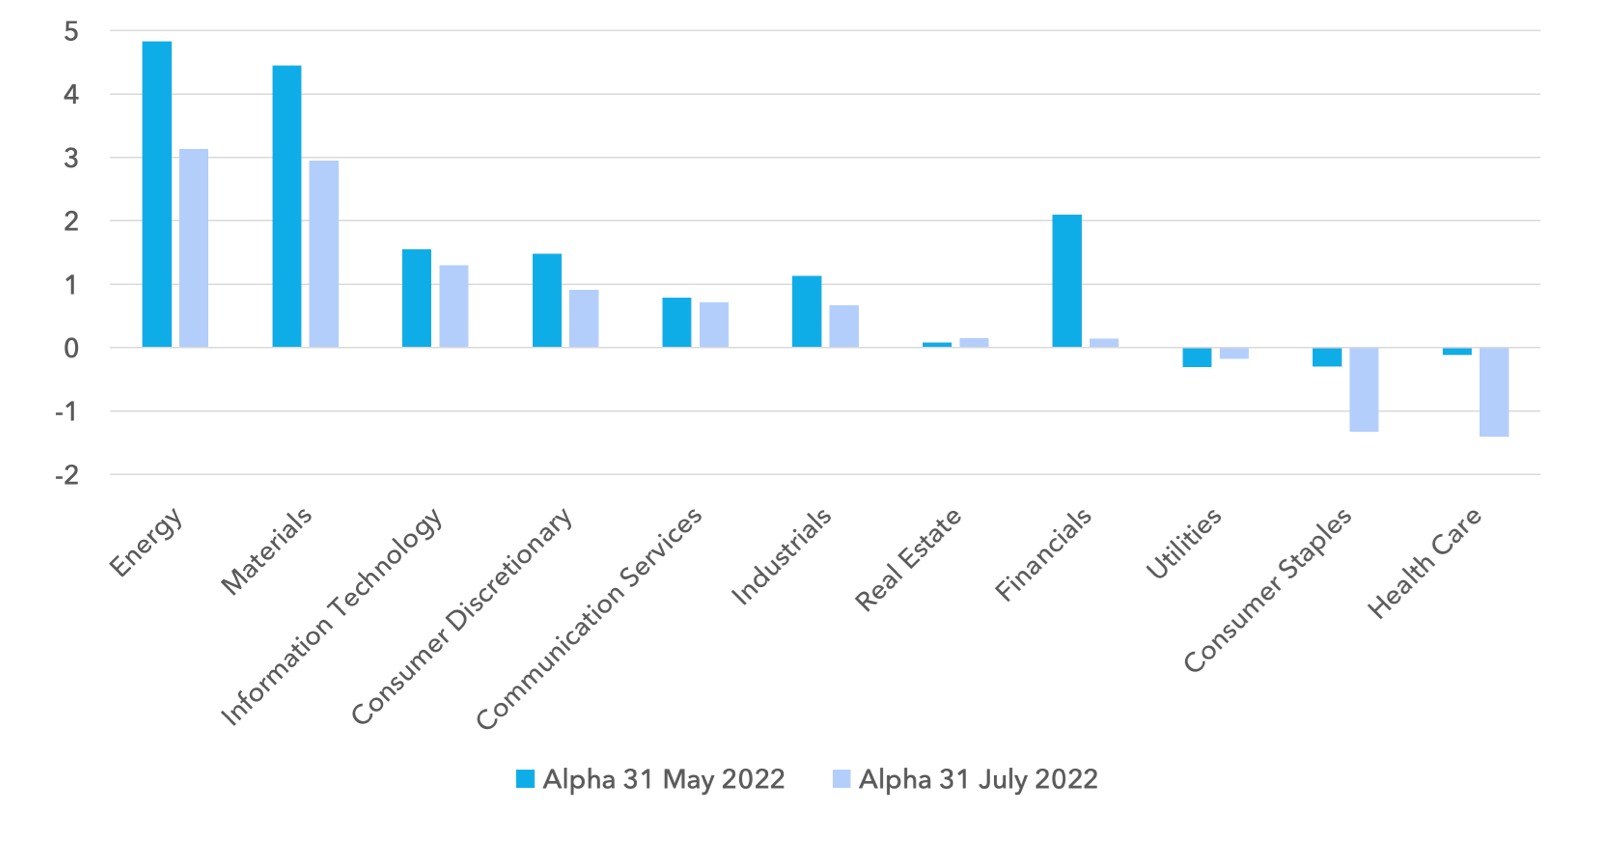
A look into attribution year to date shows the fund giving back some performance in its best performing areas during the last two months. Below we show alpha by sector at the end of May (in blue) and at the end of July (in green). Today the fund is c.7% ahead of the benchmark, but it was considerably further ahead in May. Energy, Materials and Banks have each given back c.1.5% of performance. Our underweight to Consumer Staples and Healthcare have also each cost the fund c.1% since May. As discussed above, we see a strong argument that this pullback will be reversed in all of these sectors between now and the end of the year.
We have added to Energy, Banks, Materials and some Industrials in recent weeks. A number of our favourite holdings have reached very attractive valuations creating good asymmetric risk profiles, with significant upside and limited downside. We have funded these increases in the last two weeks largely by a reduction in our Telecoms weights. We have kept all of our individual Telecom holdings, but reduced position sizes. Telecoms have re-rated vs the index by nearly 40% year to date, and whilst we believe the sector remains cheap and fundamentally interesting, we anticipate a pause in relative performance.
We expect a turning point for the fund and value imminently. The primary catalysts are the following:
- Earnings expectations for supply constrained cyclicals will likely beat expectations, and valuations are low
- Economic growth expectations globally are probably now too low for the coming 6 months. A Fed pause can take some of the severe recession forecasts off the table
- Italian Sovereign risk is nearing a peak. Long term, spreads may already be too wide given Italy’s fundamentals
- Whilst Europe’s energy crisis is severe, governments are preparing well and sourcing alternatives
- Consumers are set to be reimbursed by governments for the energy squeeze to varying degrees, limiting the scale of financial pressure
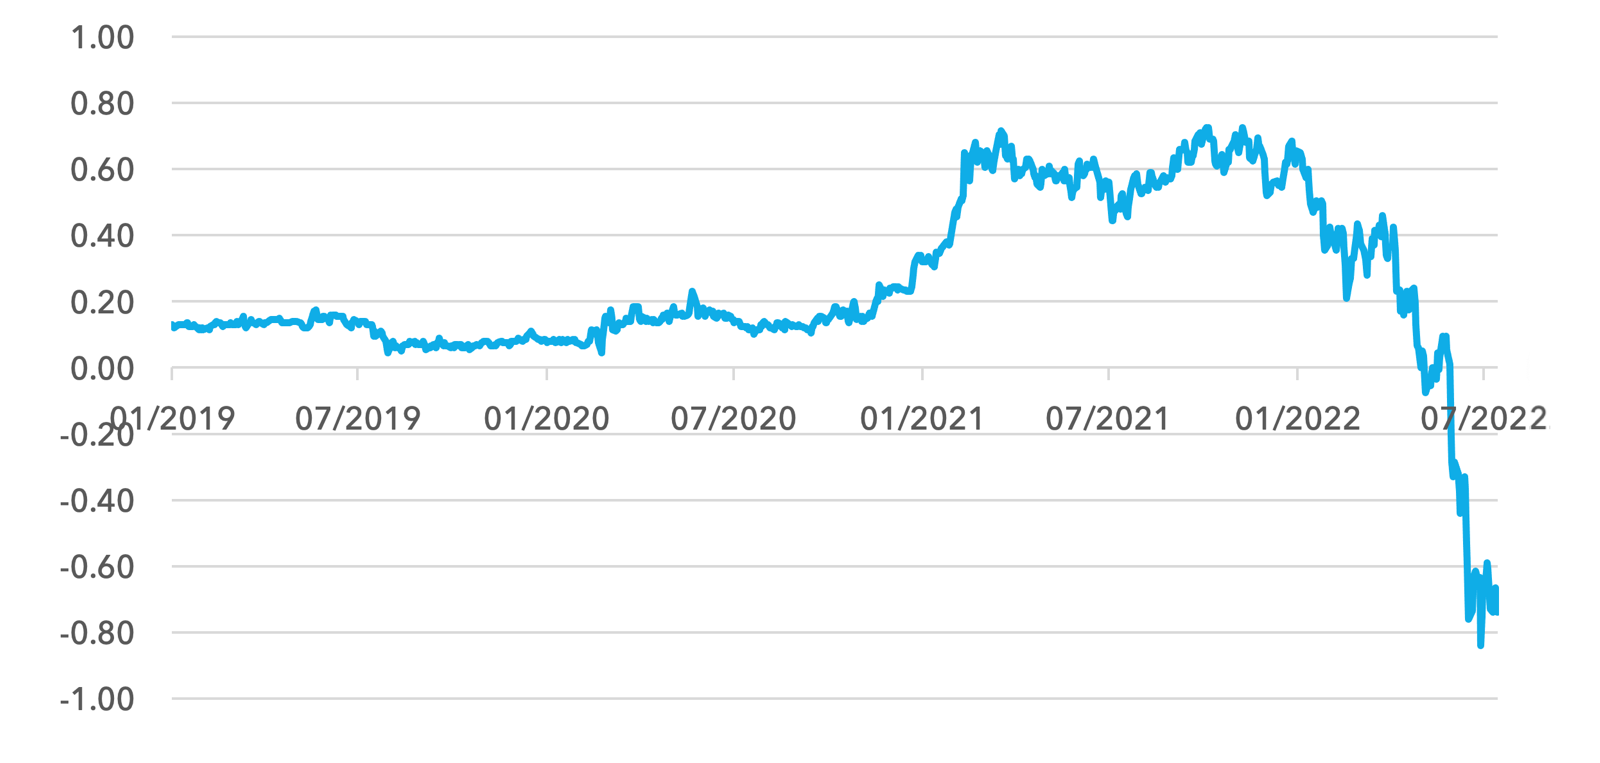
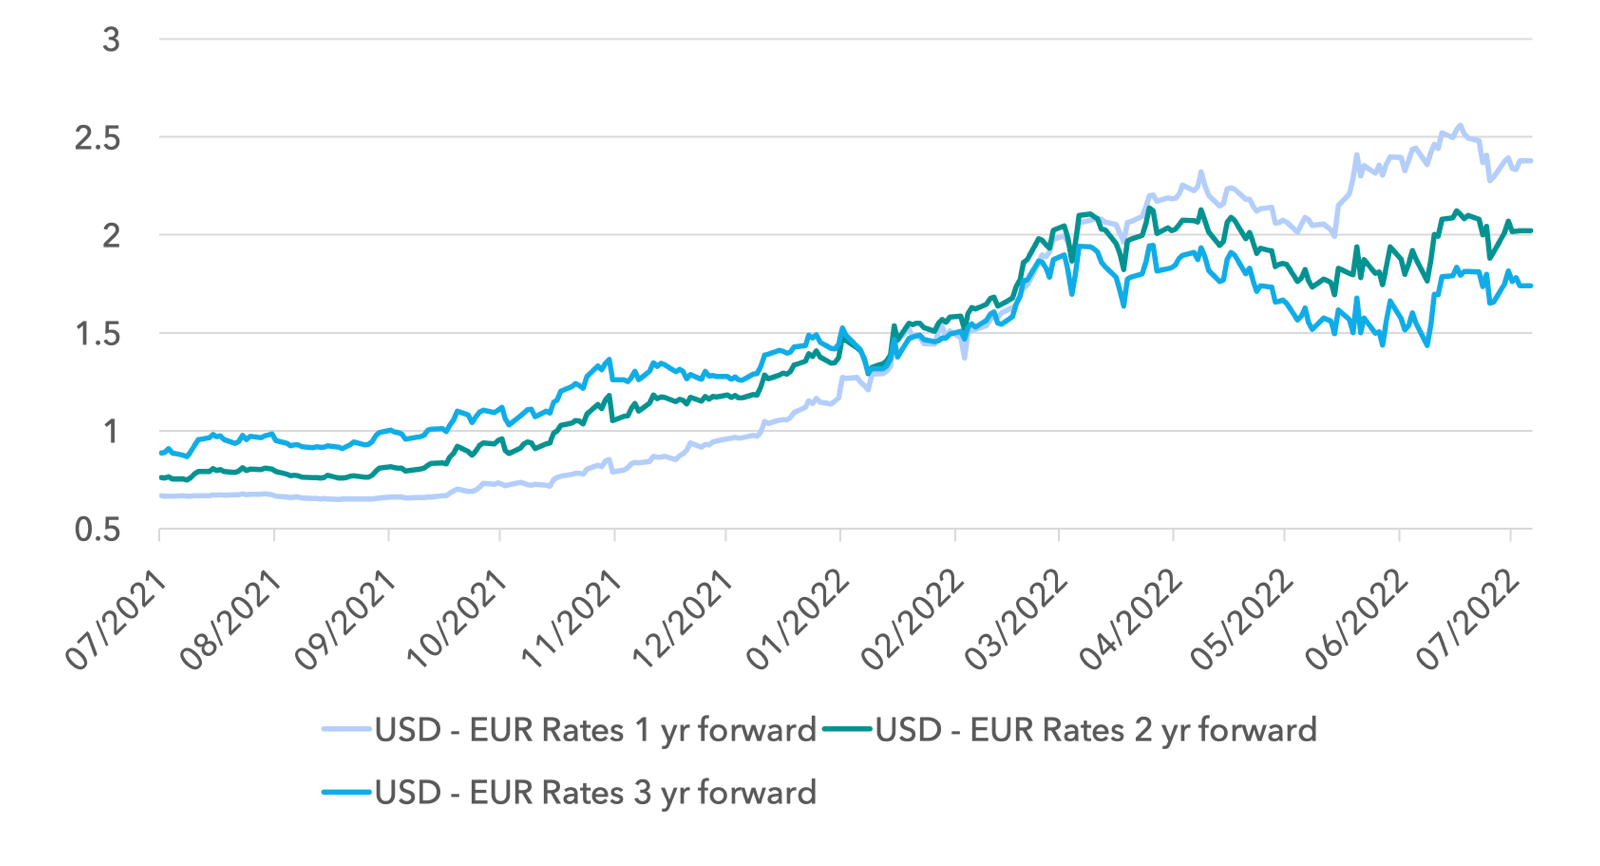
In addition to the above, the dollar may also provide some relief. Below we show USD – Euro interest rate differentials 1 year, 2 year and 3 years forward. Whilst over the 1 year time period, rate differentials continue to move marginally in favour of the dollar, this is not the case over 2 and 3 years. Given we see the Fed hiking less this year than discounted, this could cause a sharper dollar decline between now and year end.
A strong dollar is a headwind to global growth. It amplifies inflation in the rest of the world, driving higher rates and exacerbating the consumer squeeze. A weak dollar does the reverse, easing financial conditions globally.
USD – EUR Interest Rate Differentials
1 year, 2 years and 3 years forward
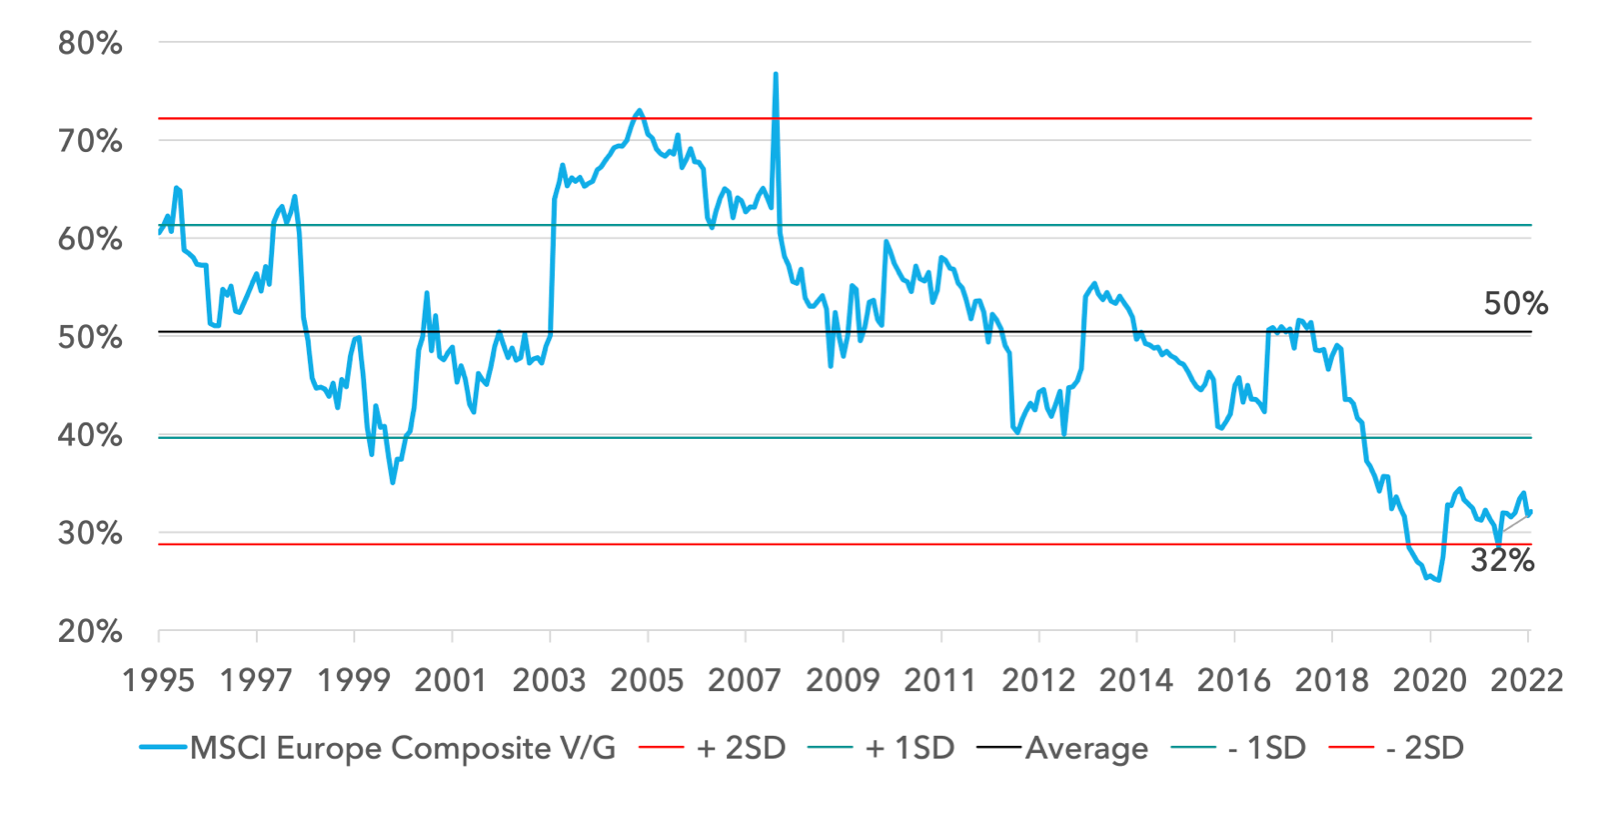
Strategically, we see this as another entry point for European value equities, similar to a year ago, and an opportunity to reduce exposure to expensive securities of all kinds. European value equities are now at 31% of the price of European growth, near the record low. There is no reason why value cannot return to its relative valuation in 2017, which was the post 1995 average of 50%. This would require over 60% outperformance in re-rating alone.
MSCI Europe Composite Value / Growth 1995 – 2022
Looking further out
Wage inflation is likely a key variable for equity valuation and relative performance. Higher wages will mean higher nominal GDP growth but also higher interest rates. Whilst lower recession risk will be a positive, higher interest rates will supress valuations, and strike hardest at the most expensive securities.
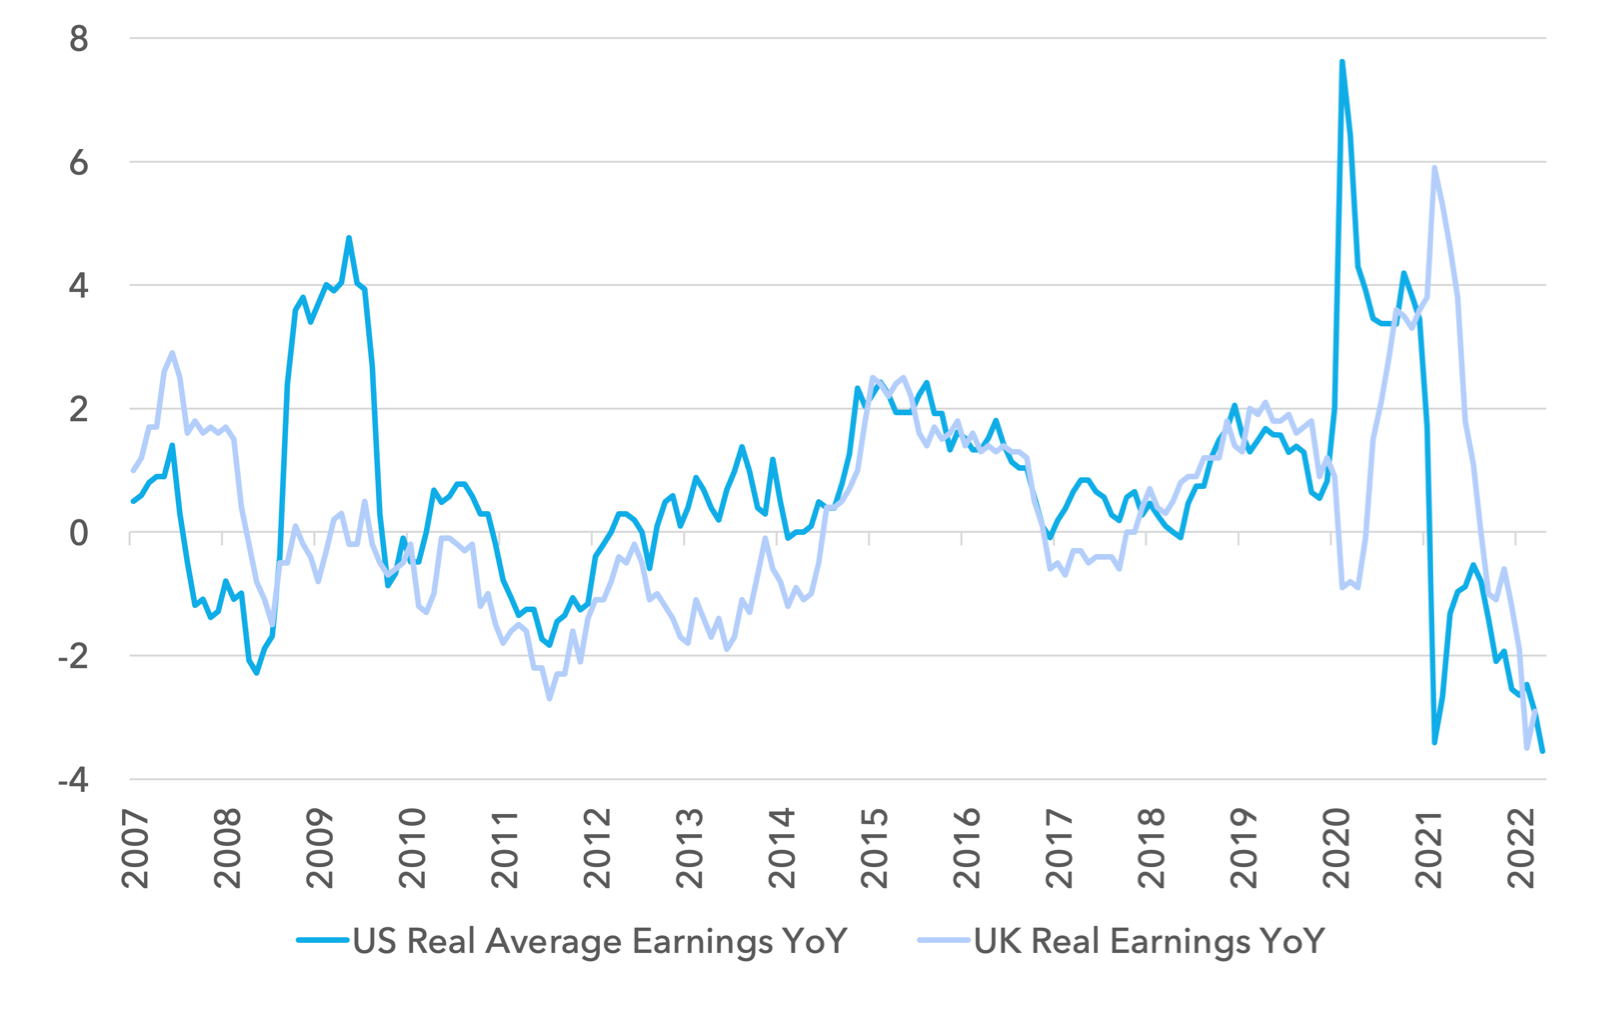
Below we show real wages in the UK and the US since 2007. Pre financial crisis, it was common to see real wage growth of +2% per year. But since the crisis, real wages have been zero to negative for most of the last decade. Today’s even deeper squeeze is adding further salt into the wound. Given this reality, it is politically untenable to ask for wage restraint today. Western electorates have endured too many years of declining real incomes. Union strikes for pay are on the rise and it is completely understandable.
The UK Conservative Party’s ongoing leadership contest may be instructive in terms of the political outlook for inflation. The small electorate of party members responsible for this leadership vote are supposed to represent a cohort that is most focussed on financial stability. Yet inflation is not a concern. The winning formula appears to be: cut taxes, spend more and don’t worry about the inflationary consequences. This may be the reality for much of the western world over the coming year. Wage restraint is unlikely, public sector salaries are moving higher and given record corporate profit margins, political pressure may build for companies to lift salaries.
UK and US Real Wage Growth YoY
2007 – 2022
If wage inflation moves consistently to match core inflation of 4%, the Fed and other Central Banks may want to hike a little more in 2023. This suggests the broad downward pressure on asset prices may not be over. But as we have argued above, there are large pockets of value that should perform well in this environment.
The market has given investors a second opportunity to sell growth and buy value. Whilst we believe markets are still in for a choppy period, we see the LF Lightman European Fund being able to deliver positive absolute and relative performance for the remainder of the year and into 2023.
Sources:
MSCI, Bloomberg, Lightman – August 2022
Legal
Disclaimer
This communication and its content are owned by Lightman Investment Management Limited (“Lightman”, “we”, “us”). Lightman Investment Management Limited (FRN: 827120) is authorised and regulated by the Financial Conduct Authority (“FCA”) as a UK MiFID portfolio manager eligible to deal with professional clients and eligible counterparties in the UK. Lightman is registered with Companies House in England and Wales under the registration number 11647387, having its registered office at c/o Buzzacott LLP, 130 Wood Street, London, United Kingdom, EC2V 6DL.
Target audience
This communication is intended for ‘Eligible Counterparties’ and ‘Professional’ clients only, as described under the UK Financial Services and Markets Act 2000 (“FSMA”) (and any amendments to it). It is not intended for ‘Retail’ clients and Lightman does not have permission to provide investment services to retail clients. Generally, marketing communications are only intended for ‘Eligible Counterparties’ and ‘Professional’ clients in the UK, unless they are being used for purposes other than marketing, such as regulations and compliance etc. The Firm may produce marketing or communication documents for selected investor types in non UK jurisdictions. Such documents would clearly state the target audience and target jurisdiction.
Collective Investment Scheme(s)
The collective investment scheme(s) – WS Lightman Investment Funds (PRN: 838695) (“UK OEIC”, “UK umbrella”), and WS Lightman European Fund (PRN: 838696) (“UK sub-fund”, “UK product”) are regulated collective scheme(s), authorised and regulated by the FCA. In accordance with Section 238 of FSMA, such schemes can be marketed to the UK general public. Lightman, however, does not intend to receive subscription or redemption orders from retail clients and accordingly such retail clients should either contact their investment adviser or the Management Company Waystone Management (UK) Limited (“Waystone UK”) in relation to any fund documents.
The collective investment scheme(s) - Elevation Fund SICAV (Code: O00012482) (“Luxembourg SICAV”, “Luxembourg umbrella”), and Lightman European Equities Fund (Code: O00012482_00000002) (“Luxembourg sub-fund”, “Lux product”) are regulated undertakings for collective investments in transferrable securities (UCITS), authorised and regulated by the Commission de Surveillance du Secteur Financier (CSSF) in Luxembourg. In accordance with regulatory approvals obtained under the requirements of the Law of 17 December 2010 relating to undertakings for collective investment, the schemes can be marketed to the public in Luxembourg, Norway, Spain, and Republic of Ireland. Lightman, however, does not intend to receive subscription or redemption orders from any client types for the Lux product and accordingly such client should either contact a domestic distributor, domestic investment advisor or the Management Company Link Fund Solutions (Luxembourg) S.A. (“Link Luxembourg”) in relation to any fund documents.
Luxembourg umbrella and Luxembourg sub-fund are also approved for marketing to professional clients and eligible counterparties in the UK under the UK National Private Placement Regime (NPPR). UK registration numbers for the funds are as follows: Elevation Fund SICAV (PRN: 957838) and Lightman European Equities Fund (PRN: 957839). Please write to us at compliance@lightmanfunds.com for proof of UK registration of the funds.
Luxembourg sub-fund is also approved for marketing to qualified investors in Switzerland, within the meaning of Art. 10 para. 3 and 3ter CISA. In Switzerland, the representative is Acolin Fund Services AG, Leutschenbachstrasse 50, 8050 Zurich, Switzerland, whilst the paying agent is NPB Neue Privat Bank AG, Limmatquai 1 / am Bellevue, 8024 Zurich, Switzerland.
Accuracy and correctness of information
Lightman takes all reasonable steps to ensure the accuracy and completeness of its communications; we however request all recipients to contact us directly for the latest information and documents as issued documents may not be fully updated. We cannot accept any liability arising from loss or damage from the use of this communication.
Wherever our communications refer to a third party such as Waystone, Link, Northern Trust etc., we cannot accept any responsibility for the availability of their services or the accuracy and correctness of their content. We urge users to contact the third party for any query related to their services.
Important information for non-UK persons (Including US persons)
This communication is not intended for any person outside of the UK, Switzerland, or the European Economic Area (EEA). Lightman or any of the funds referenced in this communication are not approved for marketing outside of the UK, Switzerland, or the EEA. All such persons must consult their domestic lawyers in relation to services or products offered by Lightman.
Risk warning to all investors
The value of investments in any financial assets may fall as well as rise. Investors may not get back the amount they originally invested. Past performance is not an indicator of future performance. Potential investors should not use this communication as the basis of an investment decision. Decisions to invest in any fund should be taken only on the basis of information available in the latest fund documents. Potential investors should carefully consider the risks described in those documents and, if required, consult a financial adviser before deciding to invest.
Offer, advice, or recommendation
No information in this communication is intended to act as an offer, investment advice or recommendation to buy or sell a product or to engage in investment services or activities. You must consult your investment adviser or a lawyer before engaging in any investment service or product.
GDPR
Lightman may process personal information of persons using this communication. Please read our privacy policy.
Copyright
This communication cannot be distributed or reproduced without our consent.