
- Europe outperformed the US by 18% in the first half of the year. We expect this outperformance to continue over a multi-year period
- The fall in the dollar is masking weakness in US equity indices
- Liquidity is likely to become more negative for US asset prices soon
- The combination of record valuations, record allocations and weakening liquidity is usually bearish for US forward returns; Europe ought to continue to be more resilient
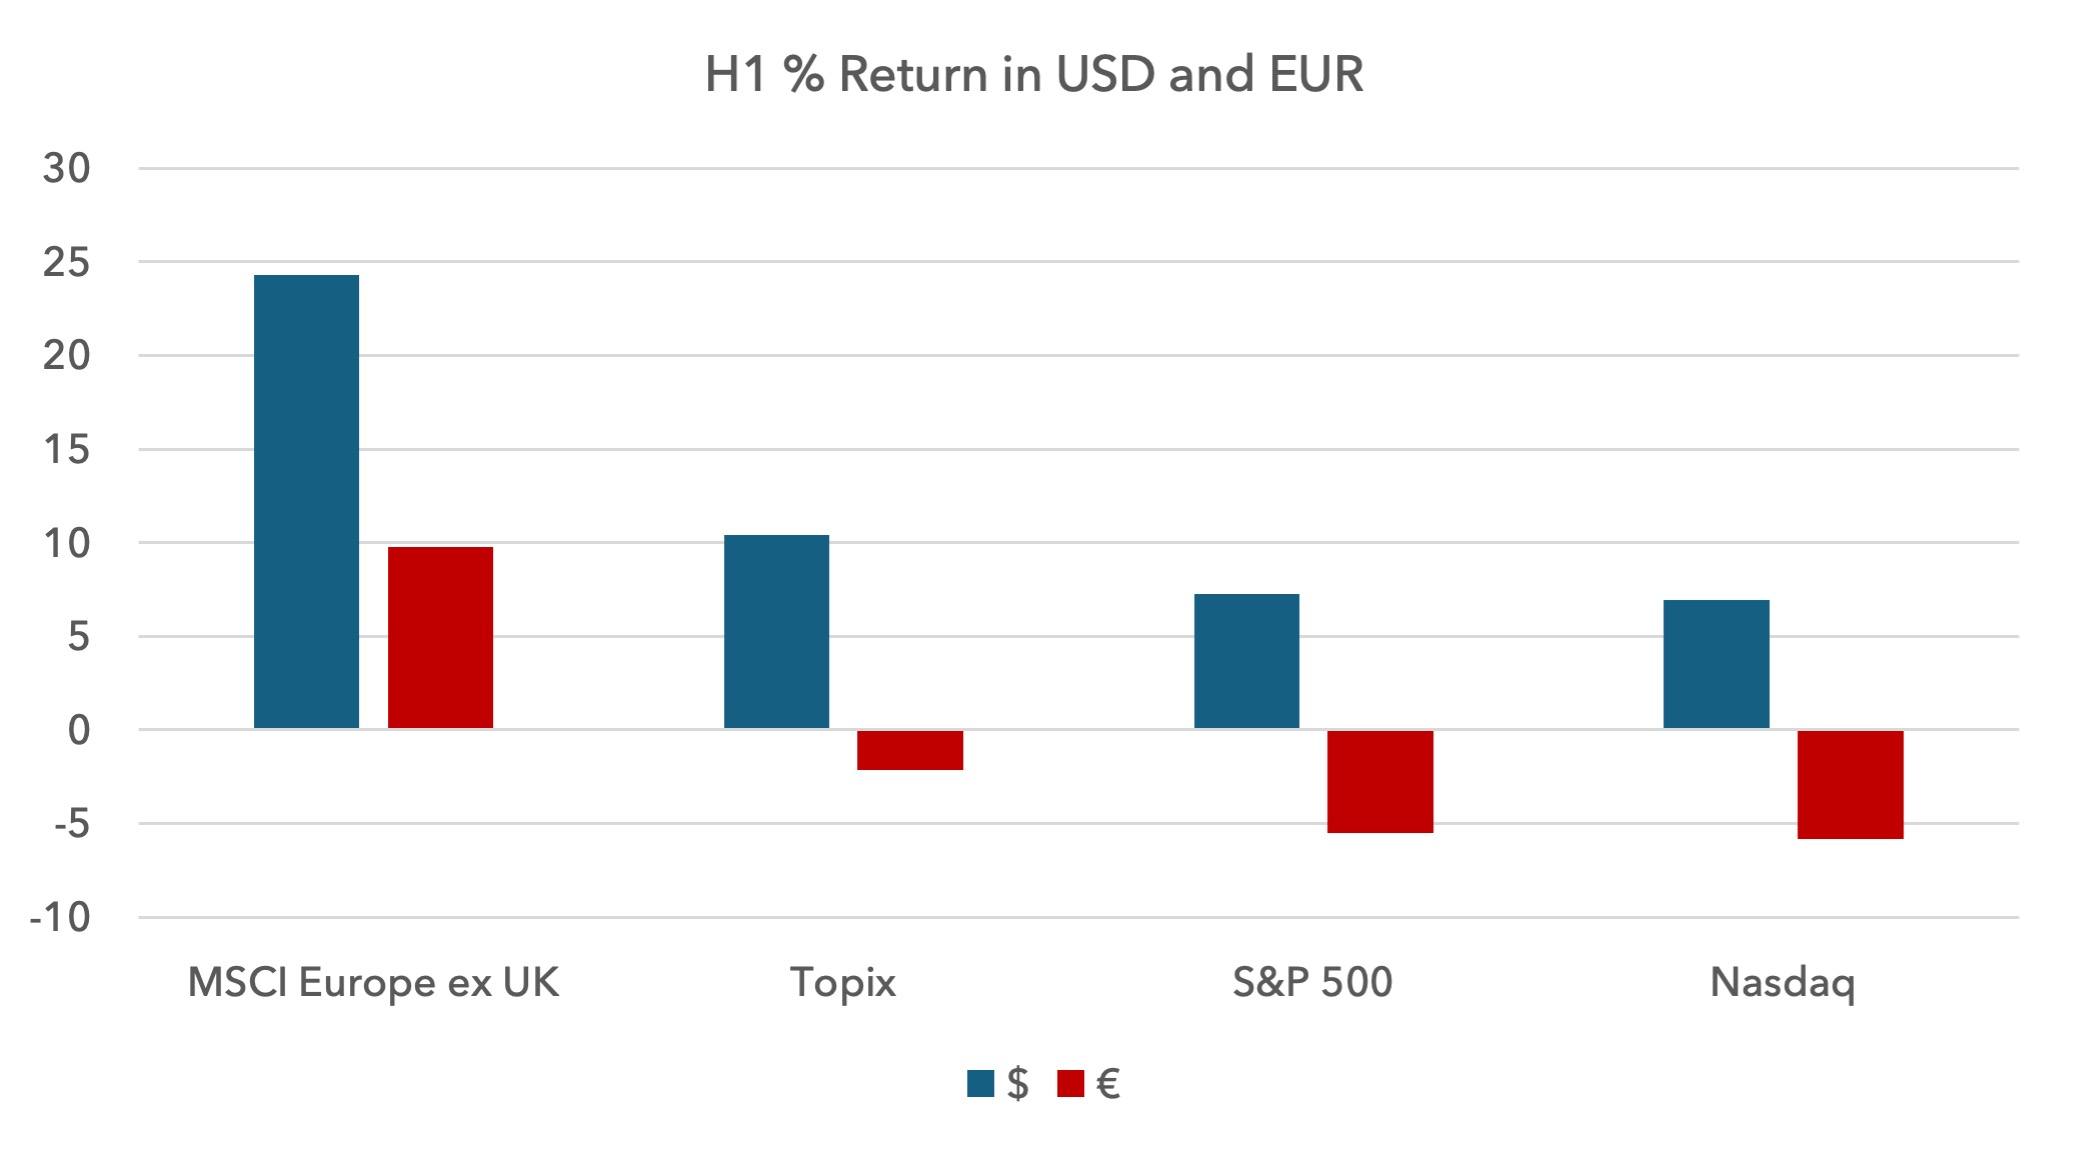 At first glance, it appears that markets have brushed off the volatility earlier in the year. But the massive moves in currencies obscure a more profound shift: Europe’s outperformance versus the US is the largest first-half relative return since 1973.
We believe conditions are in place for this outperformance to continue, albeit more steadily, over the coming years.
Long-term return forecasts
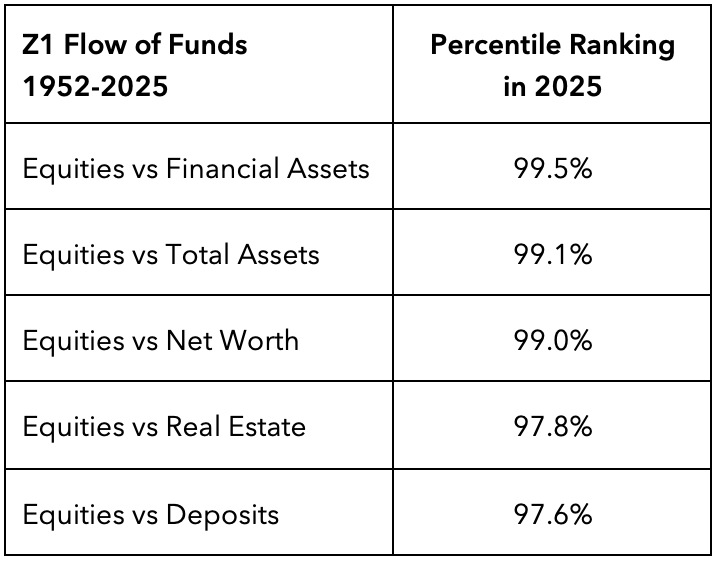
In past notes such as our update in April we have shown the recent all-time record allocations by US households to equities as a proportion of other assets, be they bank deposits, real estate holdings, total assets or net worth.
Since 1952, when the US Household data began being recorded by the Federal Reserve, there has been quite a strong relationship between allocations and forward returns. The higher the allocation, the lower the forward returns and vice versa.
We measure the ratio of equities as a percentage of other assets and how it has changed over time.
For some perspective, equities as a percentage of bank deposits have averaged 154% since 1952. The all-time low reading was June 1982 at 40%, the all-time high was March 2000 at 298%. Today we are at 277%.
The all-time low reading for equity allocations in June 1982 is now seen as the greatest entry point for equities in the last century. The all-time high reading of March 2000 is seen as the greatest selling opportunity. The logic here is if equity allocations are historically low, there is fuel for more buying, supporting a bull market. If readings are historically high, there is fuel for more selling, lifting the odds of a bear market.
We rank all of the readings since 1952 in percentiles. A reading of 99.5% means that this data point has only been higher 0.5% of the time since 1952.
The table of these ratios with today’s percentile reading is included below.
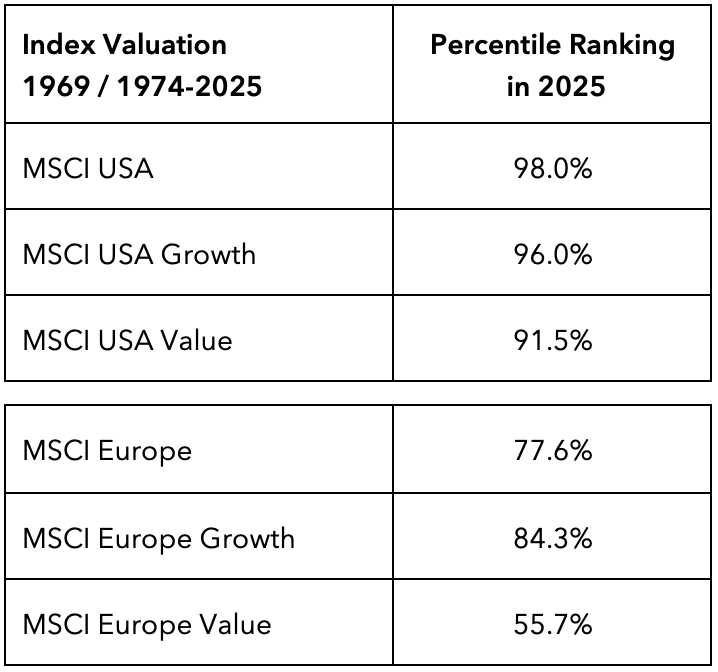
Valuations are also extremely high relative to history in the US. We compare the US with Europe and also break out value versus growth. We use an average of price to cash earnings, dividend yield and price to book for this analysis. This data is also shown in percentiles. MSCI USA and MSCI Europe valuations start in 1969. The value and growth series start in 1974.
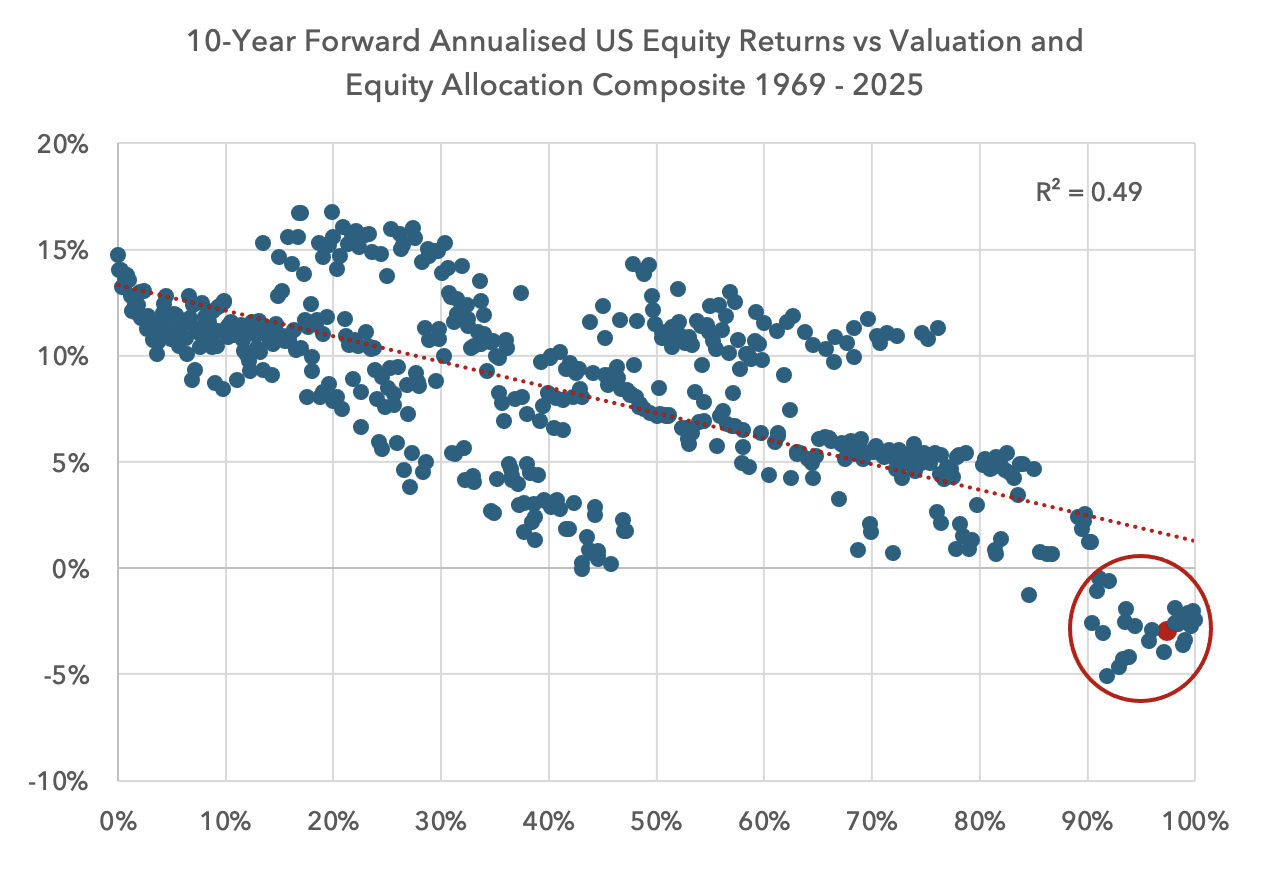
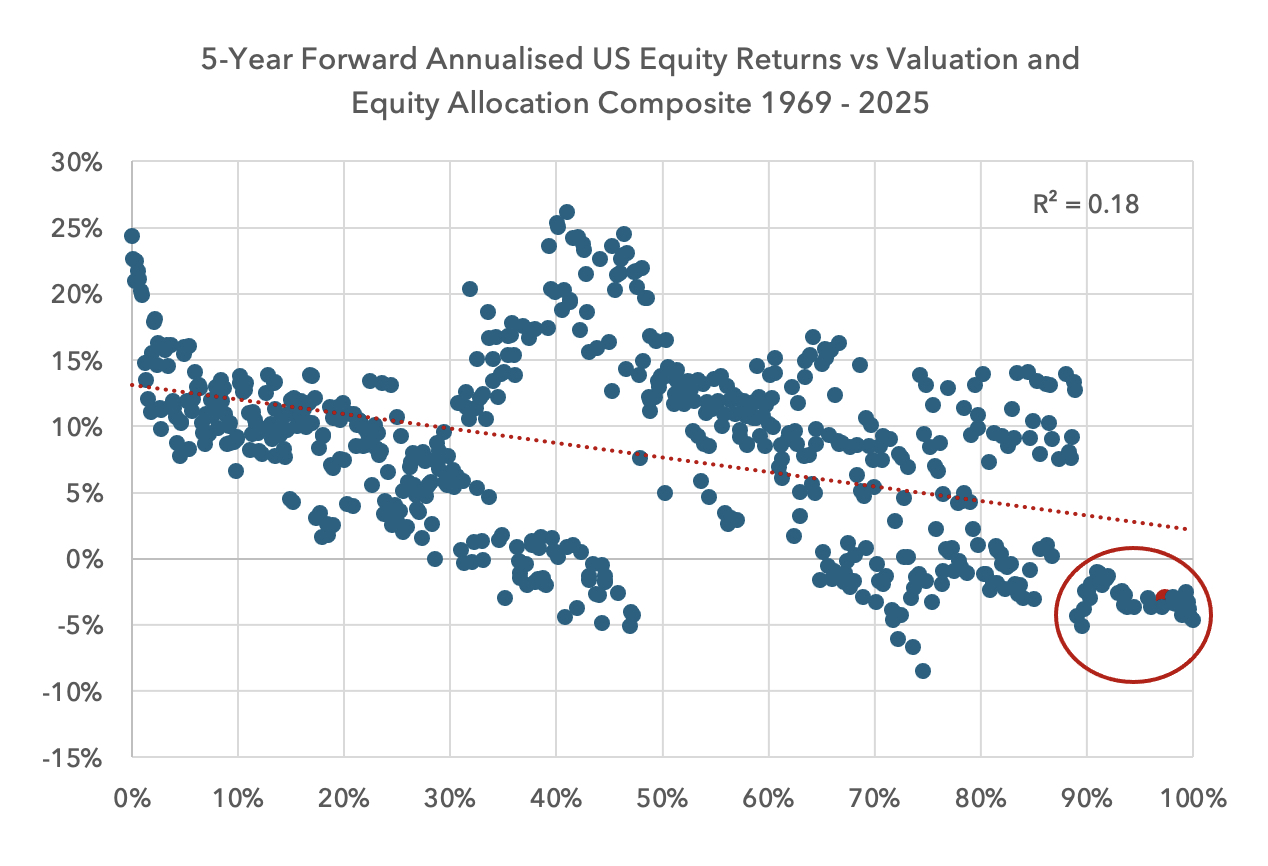
Below we combine allocations and valuations into a single series. We rank the series in percentiles and assess the forward return outcomes based on data from 1969.
It is worth noting that there is a relationship between valuation and allocations. This allocation series measures the value of equity holdings relative to the valuation of other assets. As equity valuations rise, the size of equity allocations tends to rise relative to other assets, and so there is some positive correlation between the two series.
Today when we combine US valuation and US household allocations, the reading is in the 98th percentile relative to history. As shown in the chart below, there are no instances since 1969 of positive returns over a 10-year period when the combined metrics are above the 90th percentile.
What about returns over five years? Although the correlation weakens, once more there is a strong message at the extremes. North of the 90th percentile, investors in US equities have also not made money over five years.
Over three years, above the 90th percentile, there are examples of investors generating positive returns, but all of these were during late 2020-2021. In 2022 there was a steep sell-off, right on cue, with the Nasdaq down 32% and the S&P down 19%; but as we know, the market recovered in 2023 and 2024, rescuing the 3-year return profile.
For the 3-year forward return chart below, we zoom in to show just the 90th to 100th percentile readings.
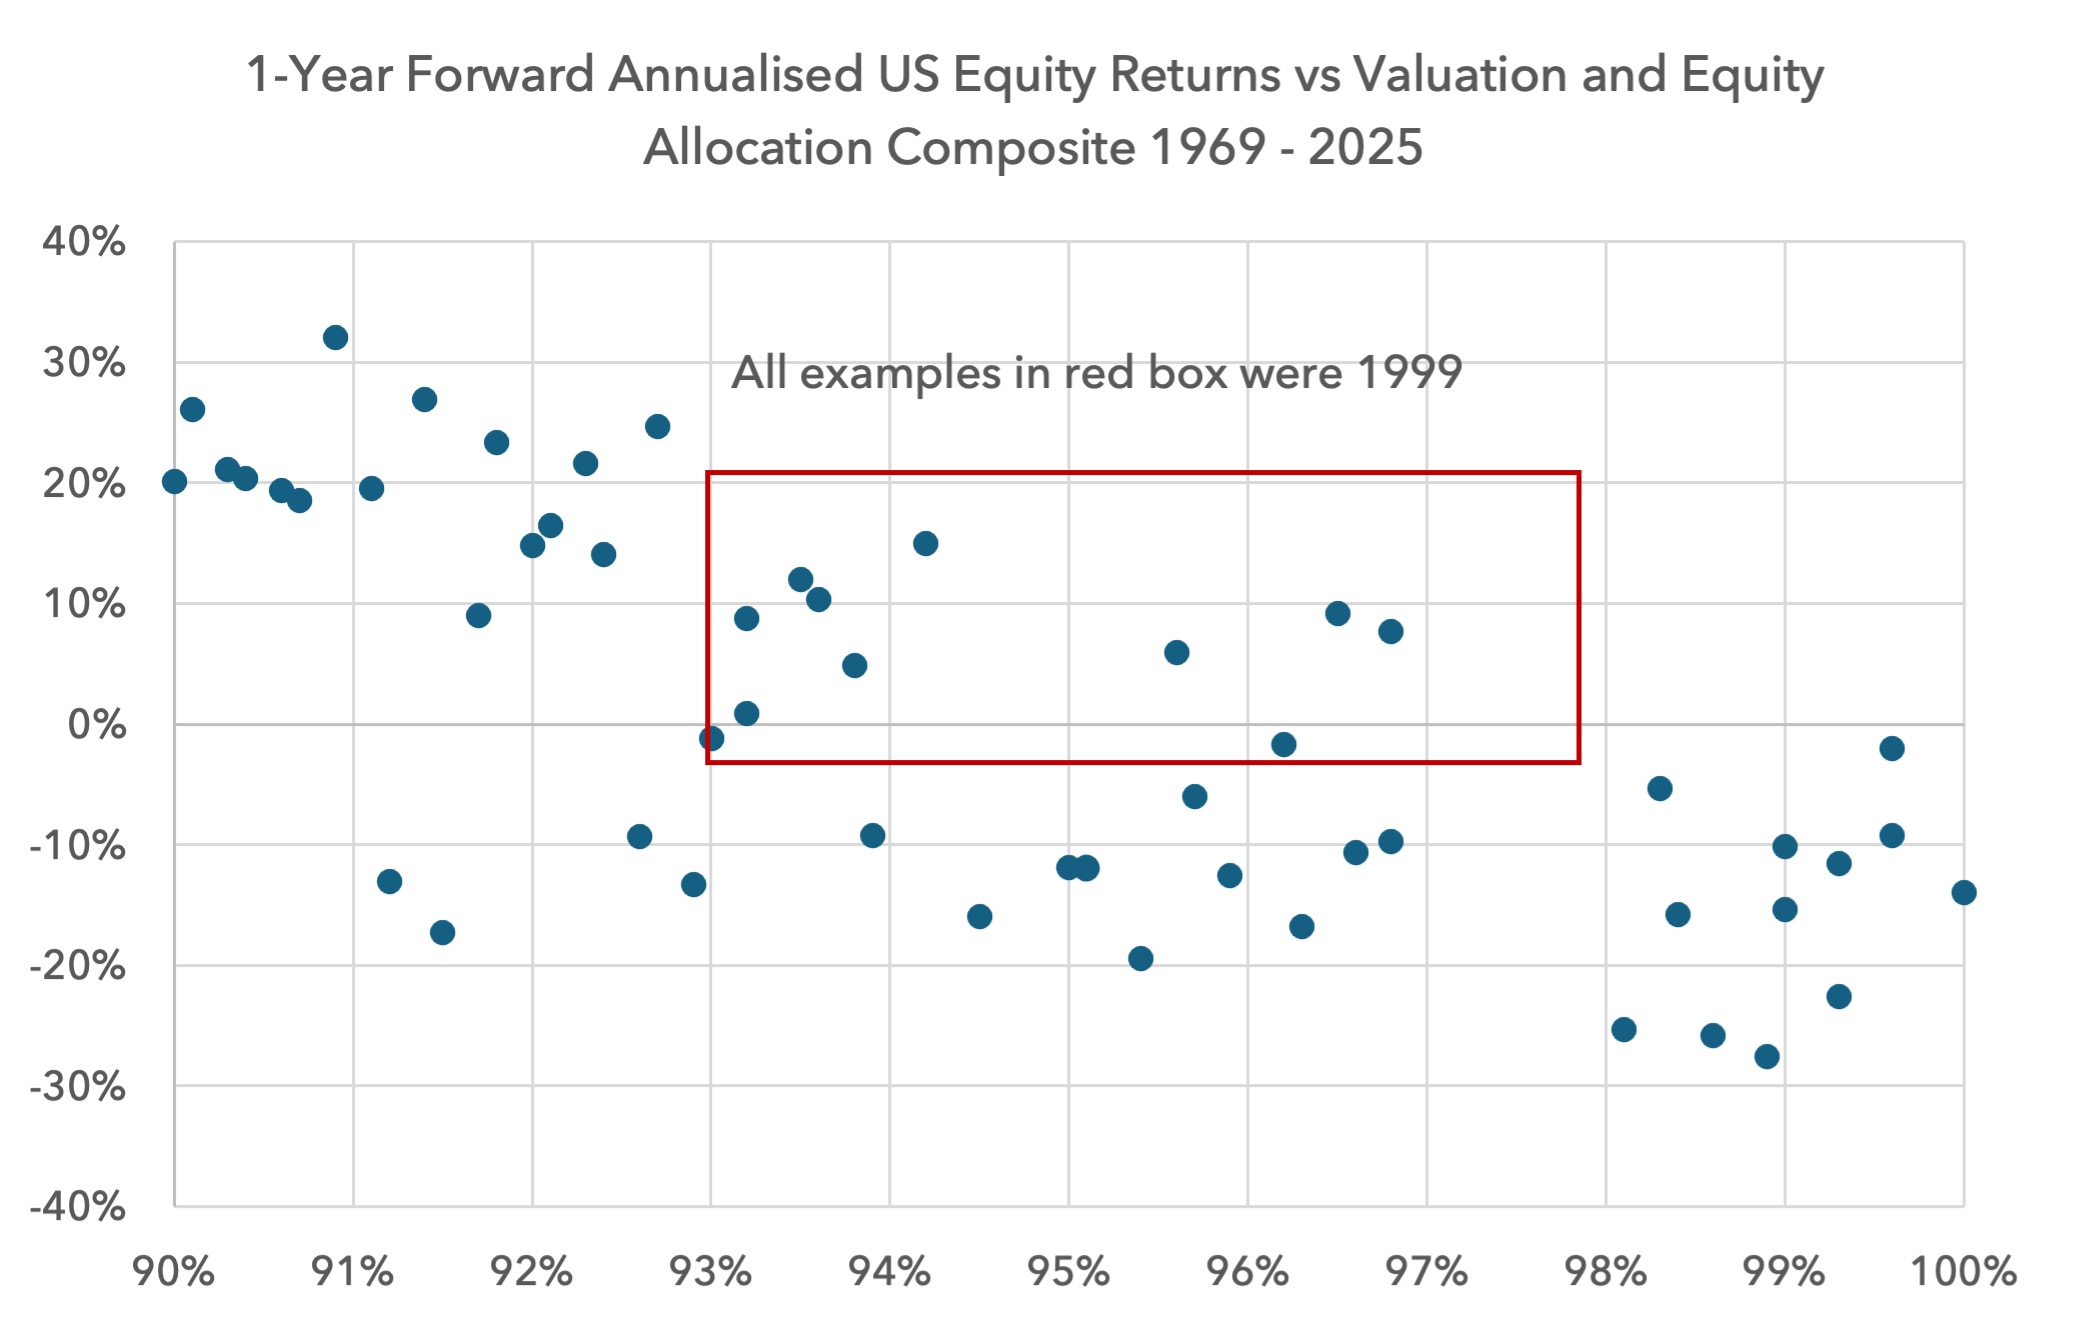
The R2 for the 3-year chart (and the 1-year chart below) is low and we have removed the regression line.
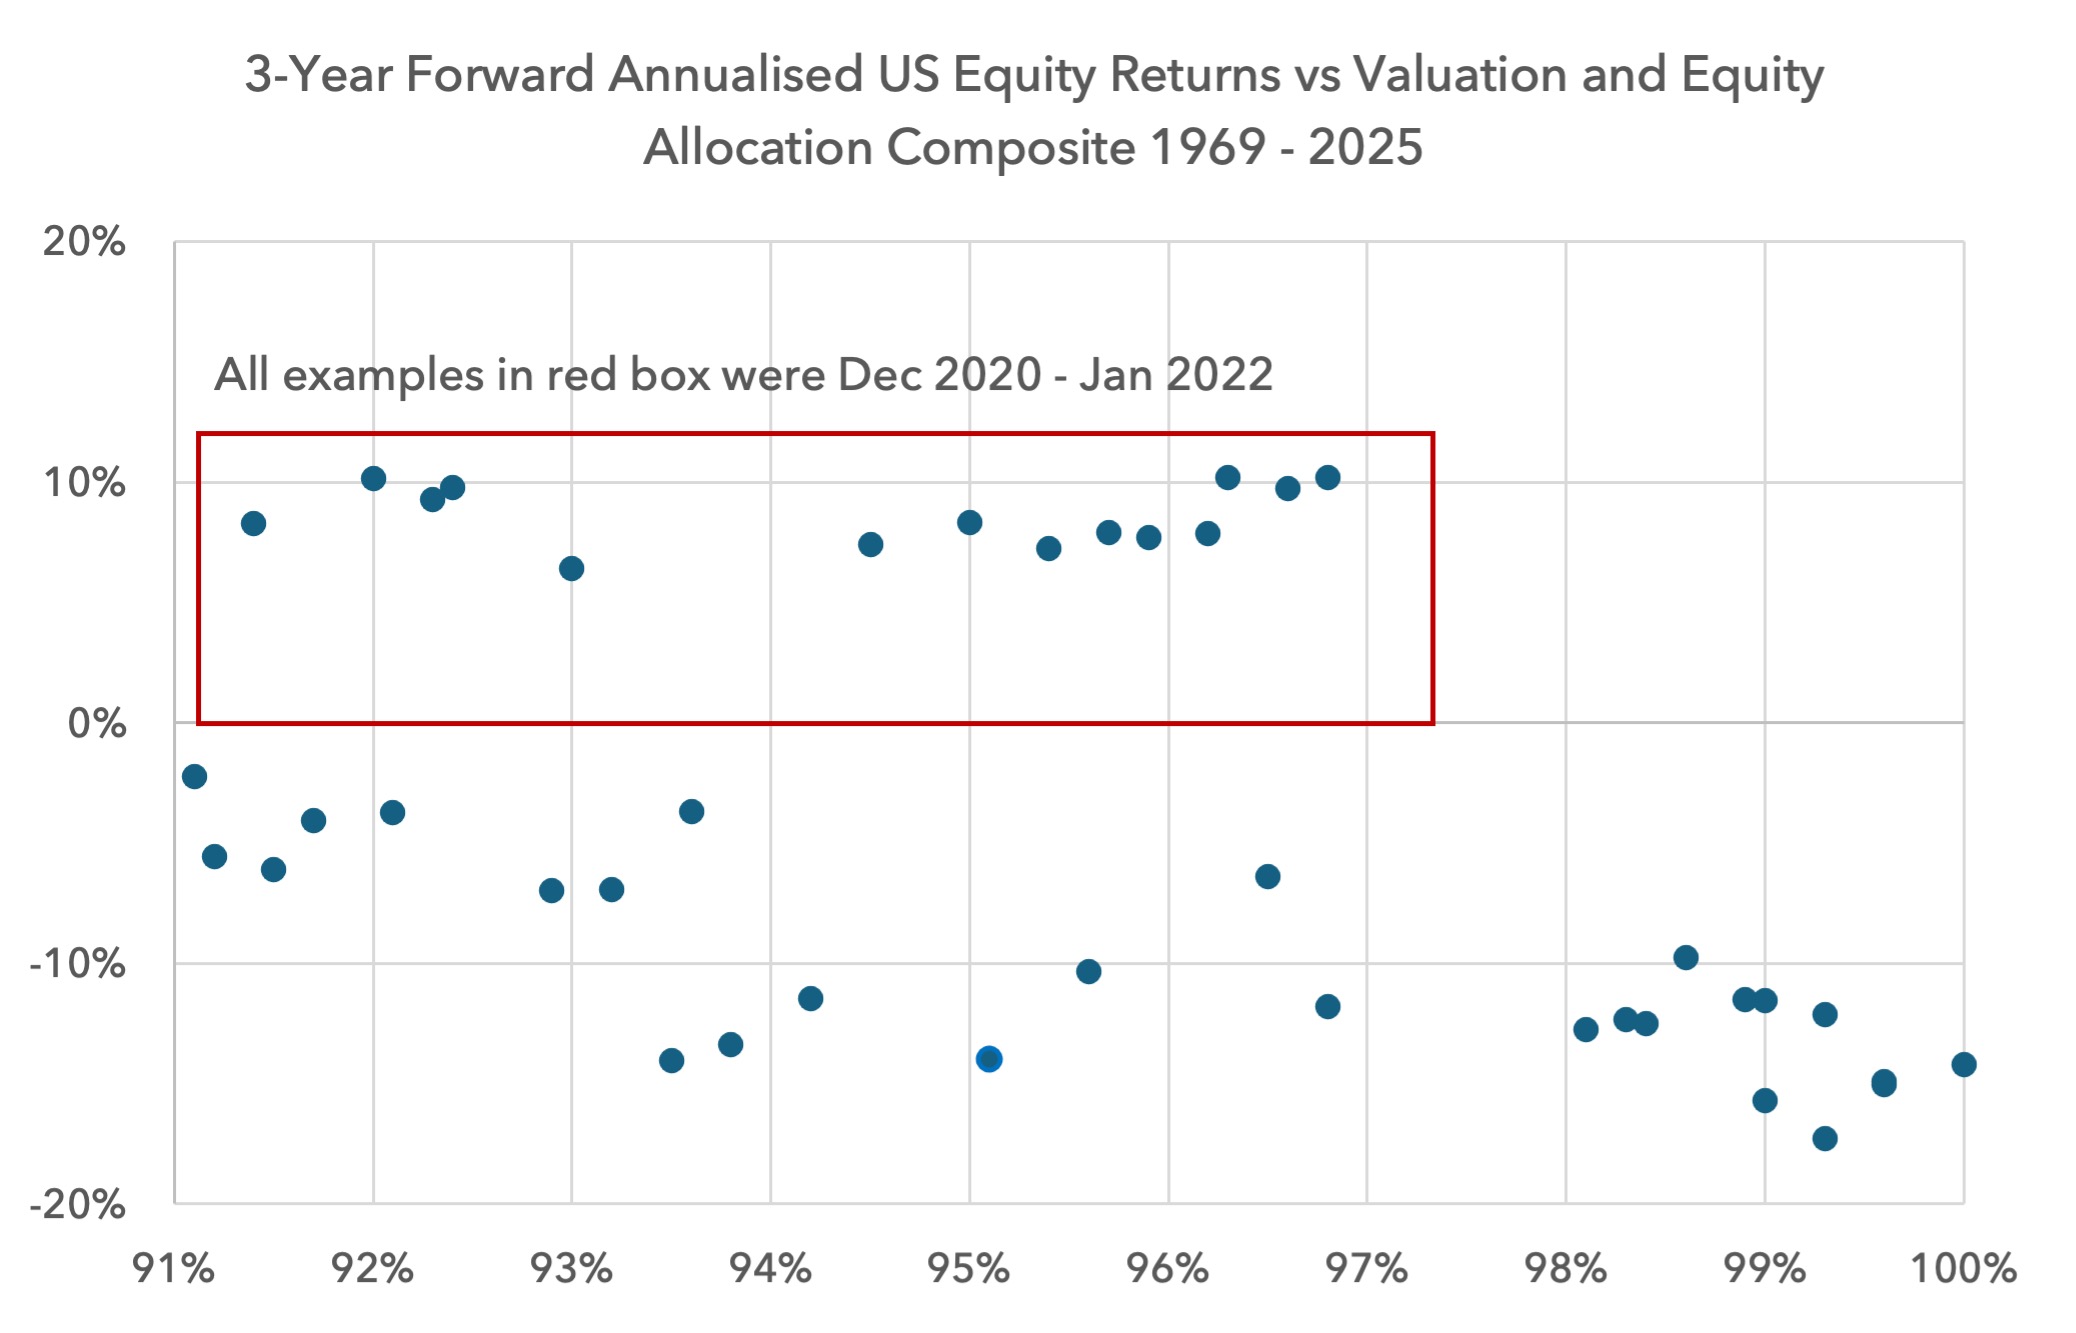
We have argued previously that the extraordinary liquidity injection of $2tn from the Reverse Repo Facility in 2023 and 2024 played a large role in supporting markets over that period. This injection of liquidity coincided with the AI euphoria that has captured investor imagination. As we will argue below, there is limited scope for liquidity to be as abundant in the coming months, and so we would view 2023-2024 as a potential outlier.
What about 1-year forward returns? Above the 93rd percentile, the only example of positive returns was from 1999.
None of the above can predict a US bear market. As we have seen in 2025 so far, a US equity bear market may have already started in euros and sterling – time will tell. But it has certainly not begun in US dollars. If the dollar continues to weaken, the downside in dollar terms is reduced.
Extraordinary measures can also be found to support markets. Scott Bessent will do everything he can to support equities. The Fed is about to cut interest rates. But it is worth investors knowing that the probabilities are skewed against positive outcomes in US equities today over 1, 3, 5 and 10 years. This suggests to us that investors should consider allocating more of their holdings outside the US, where valuations and allocations are lower.
Shadow liquidity is about to become relevant again
As noted above, we believe there was a large impact on markets by liquidity in 2023 and 2024, from the Reverse Repo Facility (RRP) and the Treasury General Account (TGA). The RRP injected $2tn into markets during 2023 and part of 2024 but was largely exhausted a year ago. Whilst the RRP balance is volatile at quarter end, it has stayed at $100-200bn for over a year now.
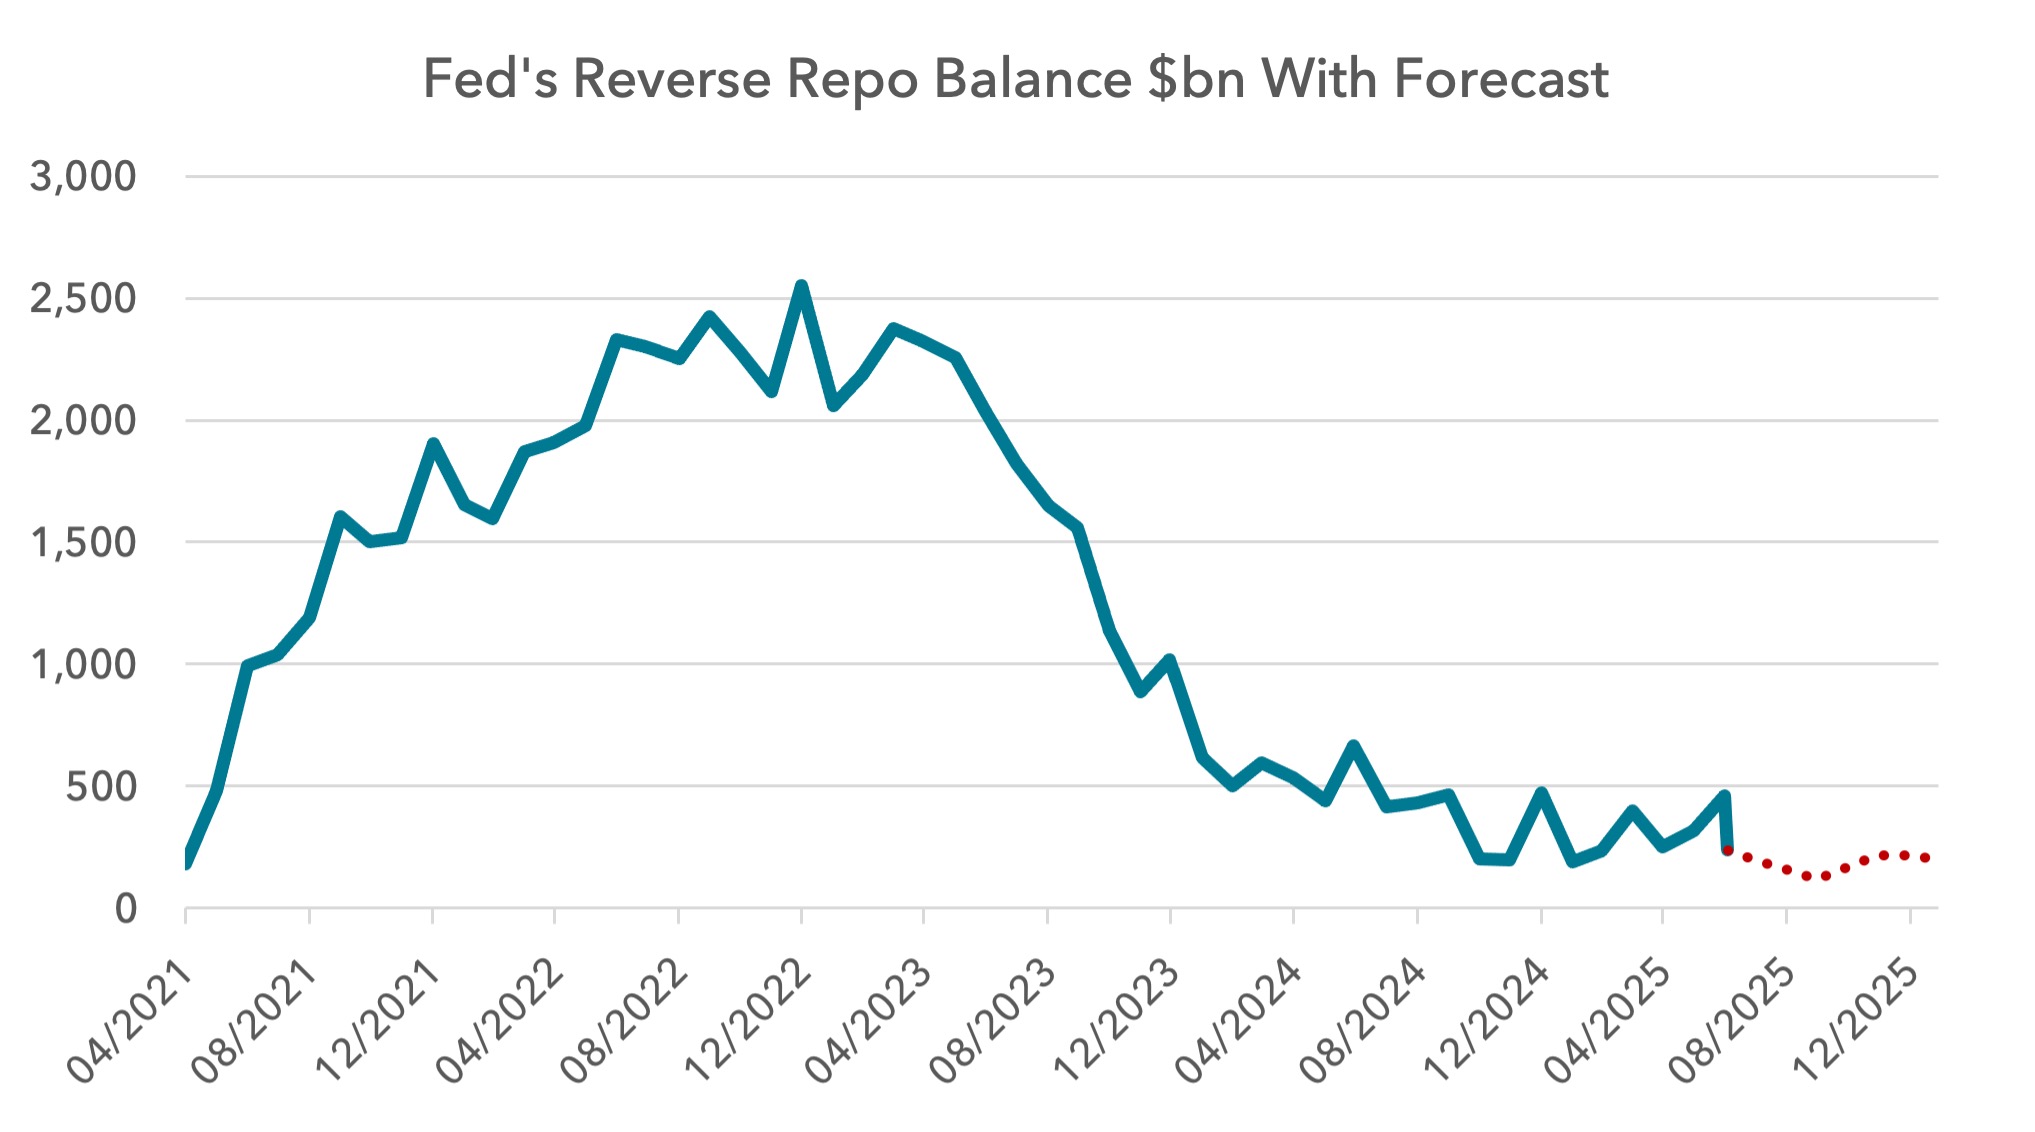
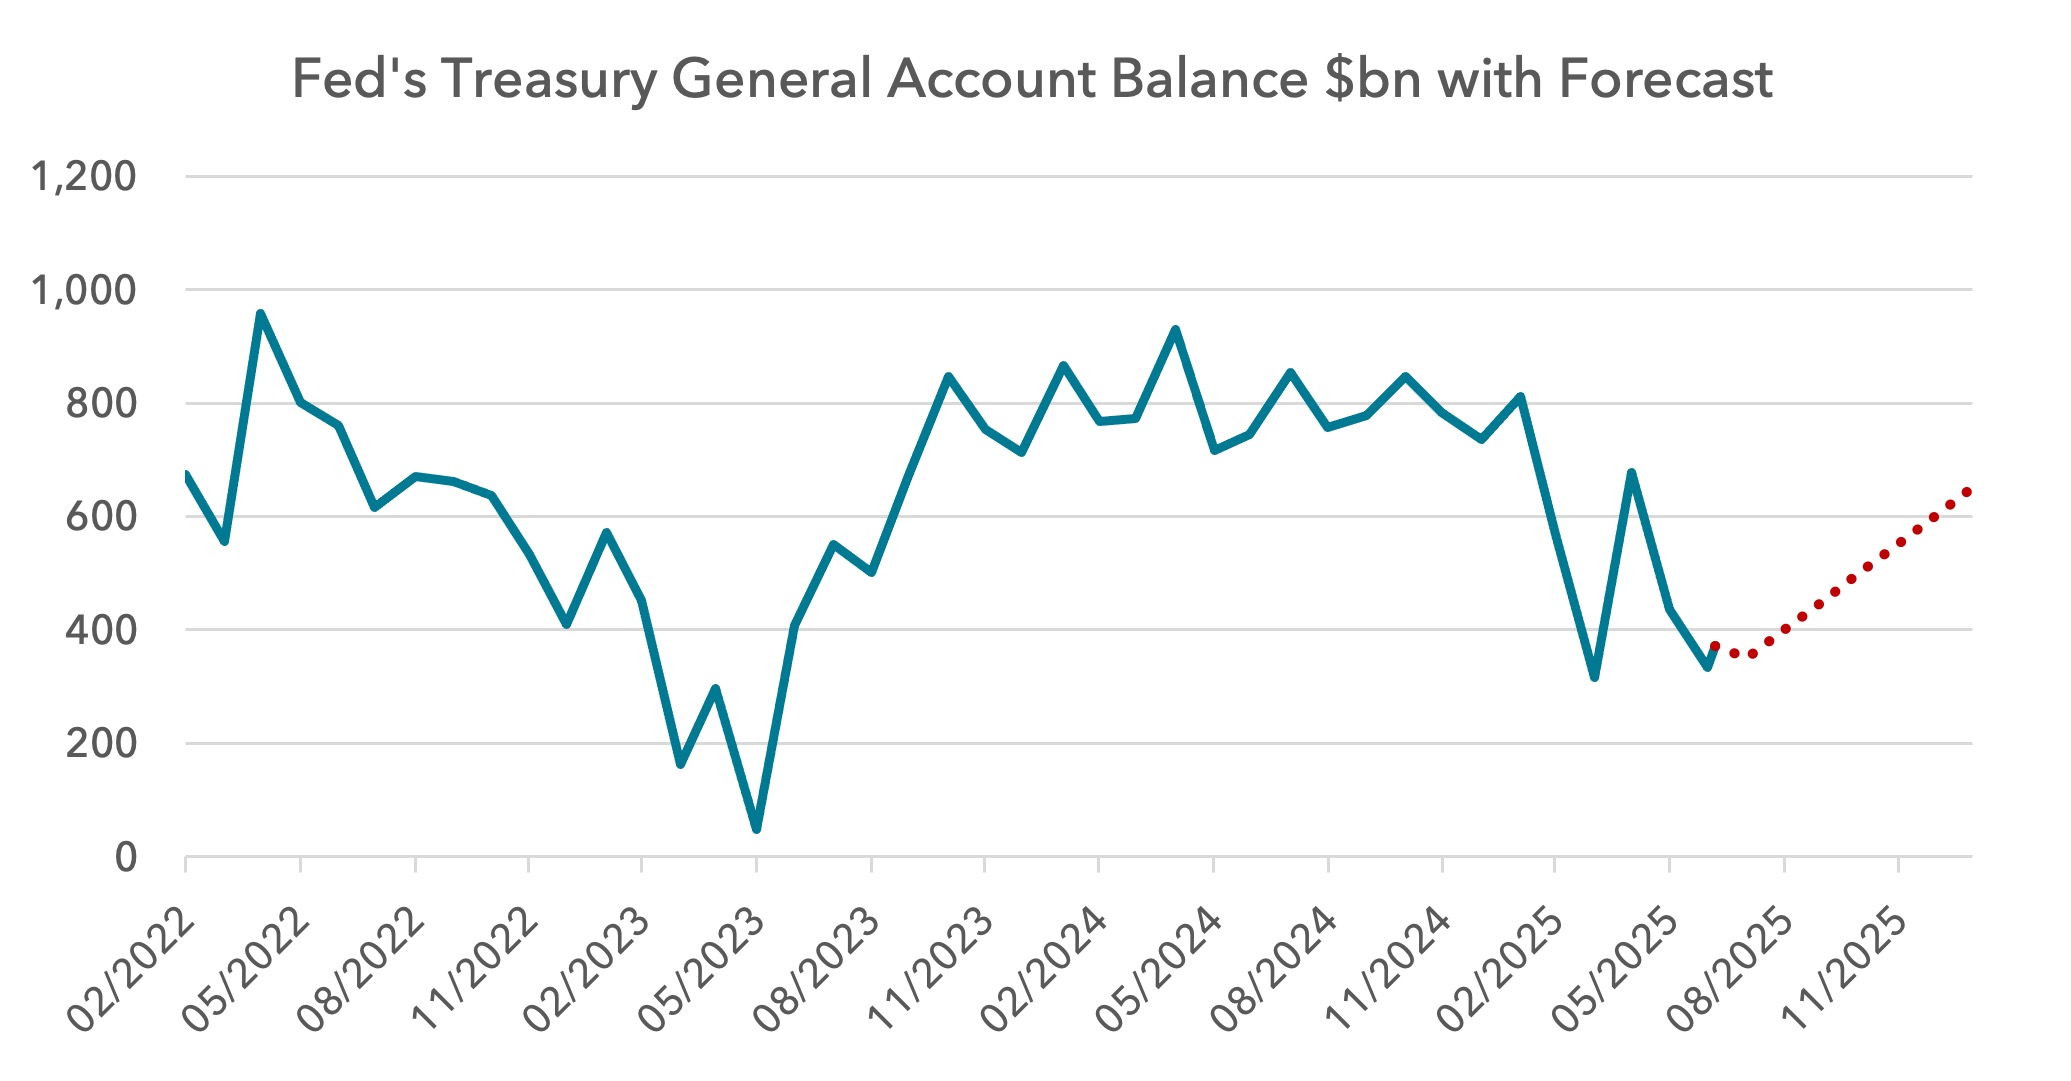
For most of 2025, because of the US Government hitting the now old $36.1tn debt ceiling, the Treasury was not able to issue net new debt. The government only issued debt in line with what was maturing. In order to fund the deficit, the Treasury used special accounting measures, including running down the TGA. As the TGA balance was run down, this amounted to a positive liquidity impulse. In this case the TGA balance is spent, but there is no issuance of debt on the other side that could drain money from the financial system.
This year the TGA has been run down significantly. This was particularly the case during the Trump tariff announcements. During the US equity, bond and currency sell-off from mid-February to mid-April, the TGA was run down by $400bn. Whilst it was hard to notice at the time, this liquidity would have helped diminish the downside for equities and the upward shift in bond yields. Yes there was volatility, but it would likely have been worse without this action.
The Big, Beautiful Bill Is Likely to Drain Liquidity from Markets
As part of Trump’s Budget Reconciliation Bill, the debt ceiling has been raised by $5tn, enabling the Treasury to start issuing net new debt again. At a minimum, we will likely see $100bn-$150bn of new issuance a month. This is a significant capital call on the global financial system, and all things being equal ought to drain money from other assets.
In previous years this would not be particularly noteworthy, but given the volume of issuance, record high valuations and allocations in US equities, this cash call could be more impactful on markets for the remainder of 2025 and 2026.
Much of the issuance is expected to be in T-bills and not in notes or bonds. Some argue that this will be stimulative since T-bills can be used as collateral for other financial instruments, enabling more leverage and more derivative positions, thereby easing financial conditions, but this remains unclear.
Yellen adjusted issuance to the short end and it lifted markets, but this occurred with the boost from the RRP. It is not clear that T-bill issuance will be bullish if there is no unused pool of liquidity ready to supply it.
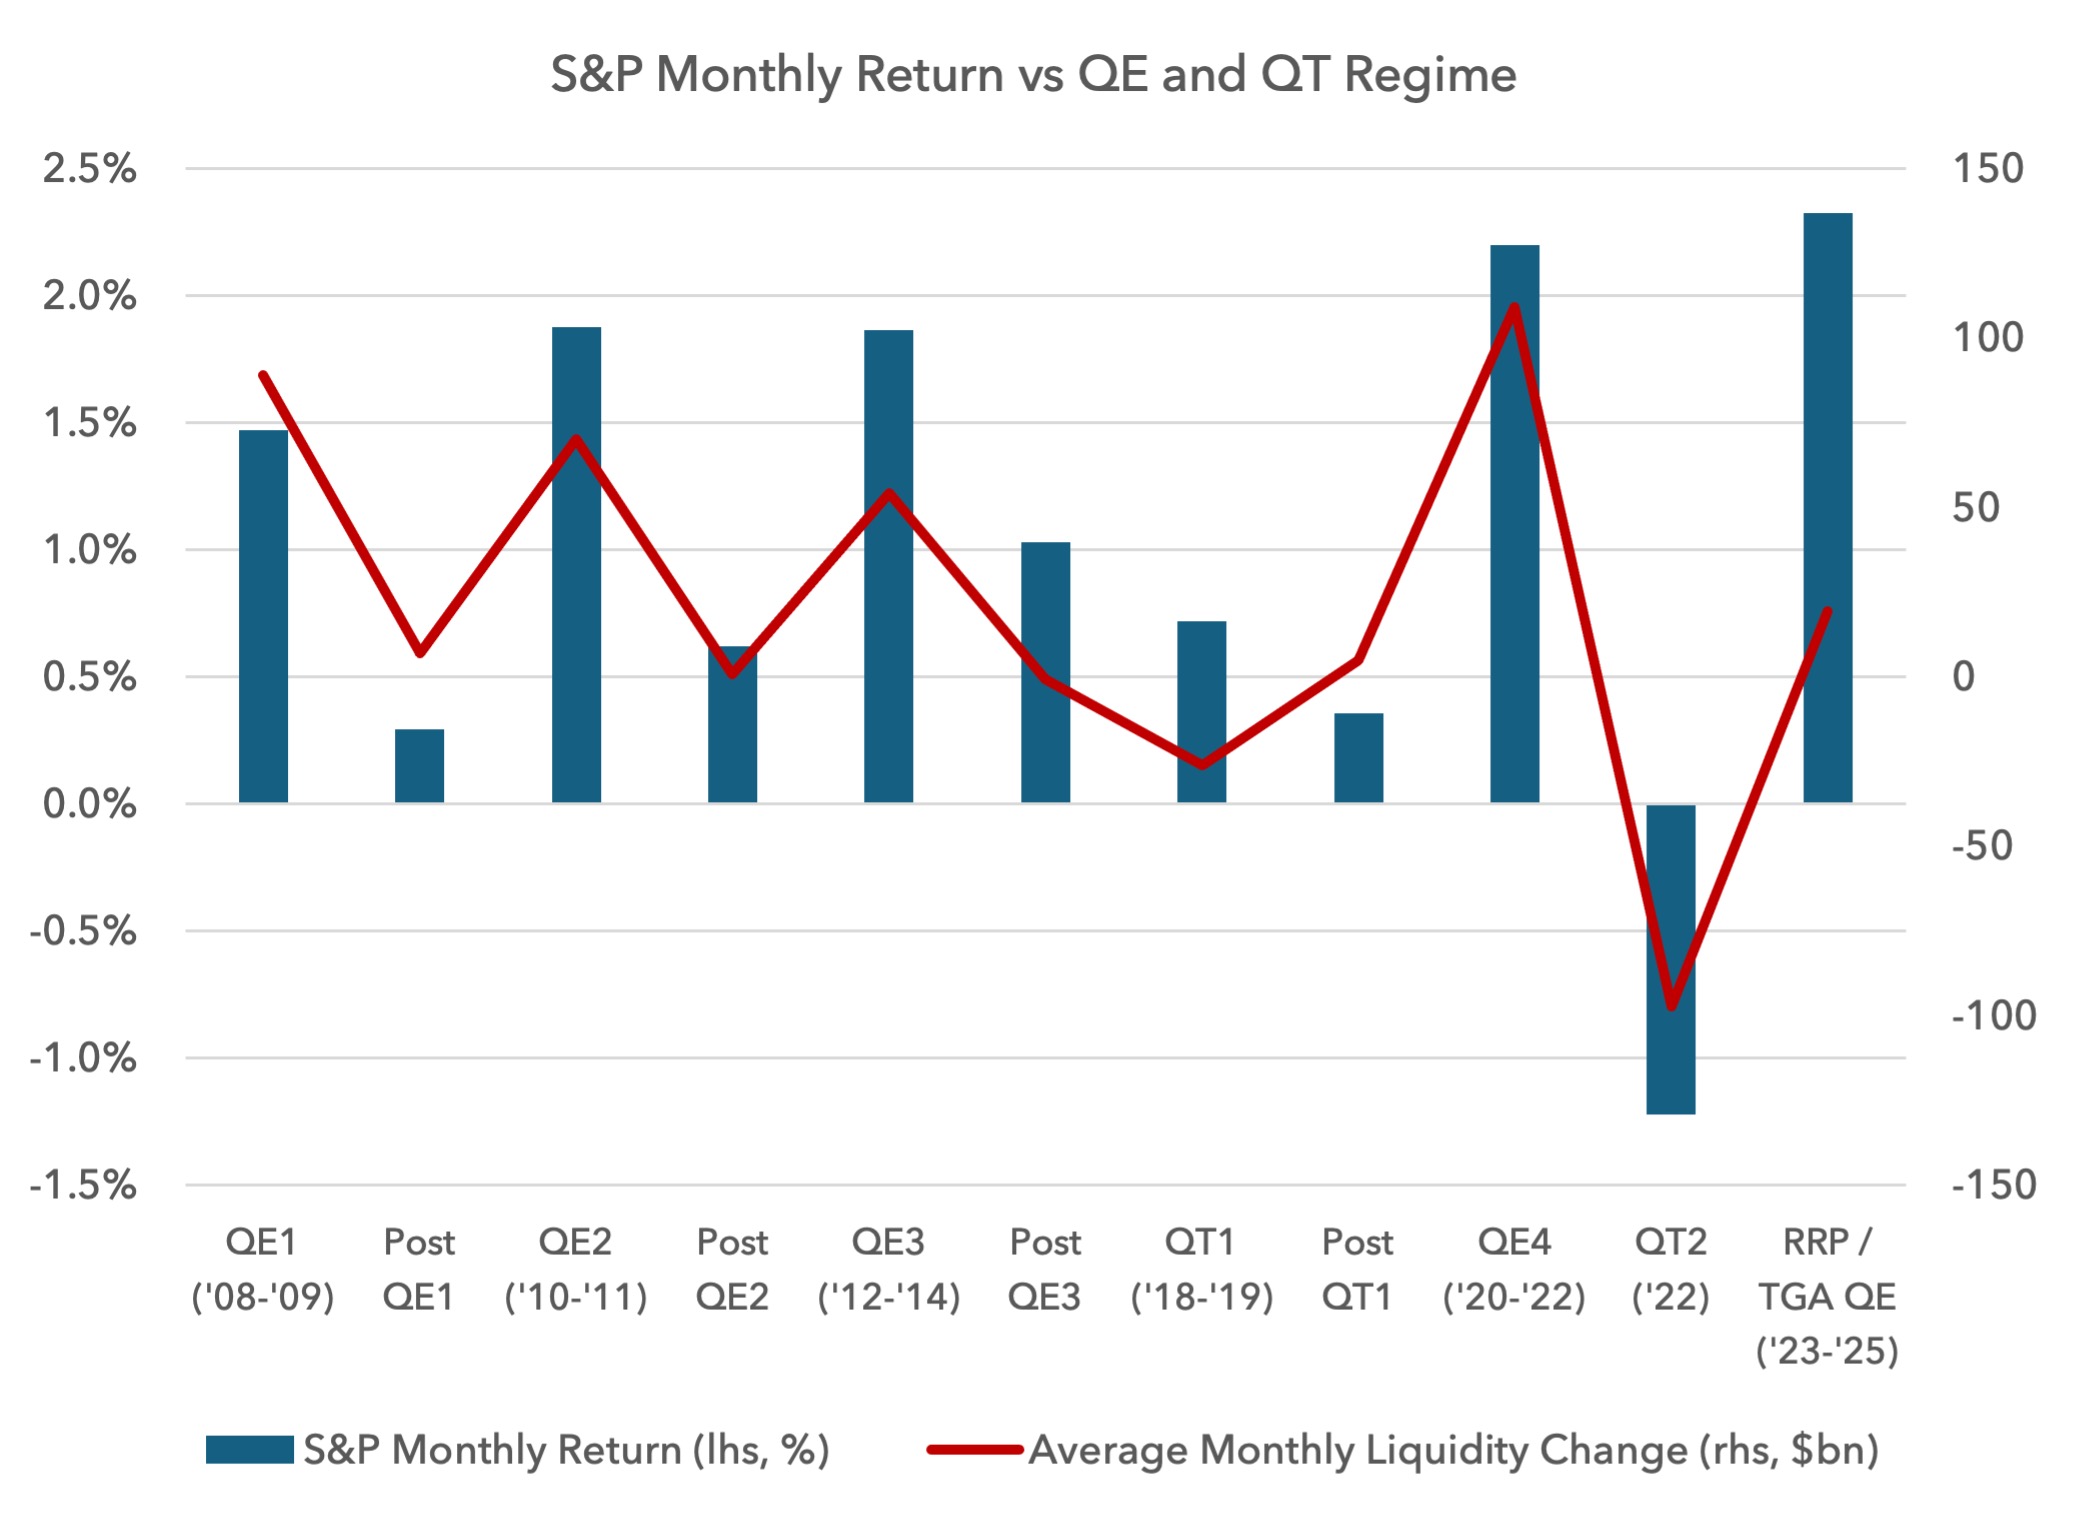
Below we show the S&P’s monthly return versus the respective quantitative easing (QE) or quantitative tightening (QT) regime since 2008. It is not very precise, but directionally there is a clear relationship. As we move into the second half of 2025, debt issuance is ramped up and the TGA is slowly refilled, we are likely to see a weaker liquidity backdrop. This suggests a more cautious outlook for US monthly returns for the remainder of the year.
What new sources of funding could be found?
The US administration has consistently found new ways of supporting markets. Today it is pinning its hopes on two areas of new funding: changing bank capital rules and stablecoins.
On 25 June the Supplementary Leverage Ratio (SLR) was reduced from 5% to a 3.5%-4% range. This lowers the amount of capital that banks need to hold relative to their total assets. Recent stress tests have also been relaxed.
Whilst this does free up capital, we are not sure how impactful these reforms will be for Treasuries. A lot of this excess capital is due to be returned by banks to shareholders in the form of special dividends or buybacks. The SLR reform has already been implemented and has had a muted impact on the Treasury market so far.
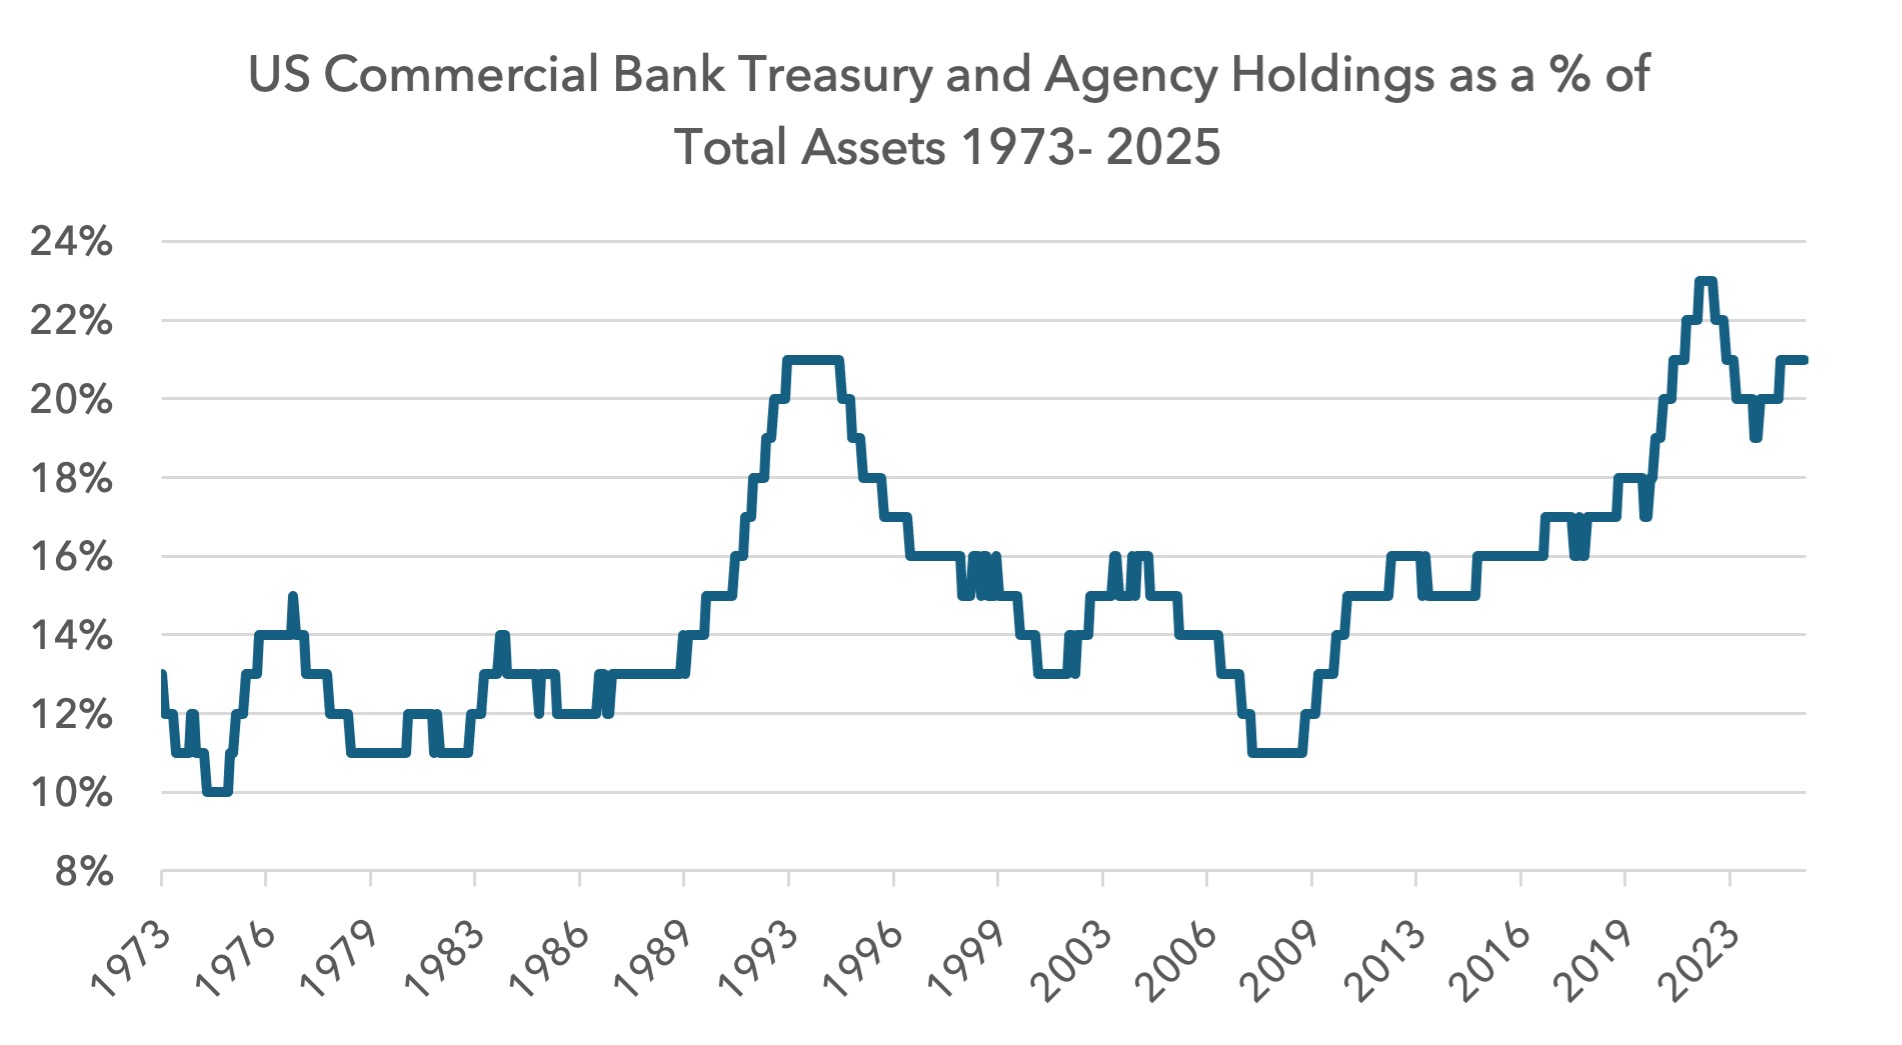
Banks have also suggested that this reform will not meaningfully change their attitude toward owning US debt. This might be because they already have a large exposure to Treasuries relative to history. US banks’ government debt holdings have doubled as a percentage of total assets since 2008-09 and are near the highest levels for 50 years.
What about stablecoins? The Trump administration is hugely committed to bitcoin and also stablecoins. The Genius Act, passed in June, regulates stablecoins and is designed to make them safer and more attractive. Typically stablecoins are pegged to the dollar and need to own high quality liquid dollar assets, namely short dated T-Bills. It is anticipated that stablecoins could grow significantly in the coming years with some forecasts estimating a $1-2 trillion market size by 2030.
Stablecoins sourcing money from within the US may not have much of an impact on Treasury demand since this funding would likely have come from the banking system or money markets. Much of this would have been parked in Treasuries beforehand. But dollar-backed stablecoins that raise money from abroad would be more powerful. This amounts to net new money for the US financial system.
Today most stablecoins offer no yield and so the logic of parking money in something like USDT (Tether) or USDC (Circle) for a long time is not strong, but this might change. We believe it is too early for stablecoins to have an impact on Treasury yields in 2025 or 2026, but if this market grows, it could add up to a new source of demand, potentially offsetting some of the loss of demand from other sovereigns.
Neither bank capital reform nor stablecoins appear to be a liquidity gamechanger for now, so we would hold to our view that investors should be prepared for tighter liquidity for the remainder of the year, even with Fed rate cuts. This leads us to believe US asset prices, and in particular US equities, will continue to underperform.
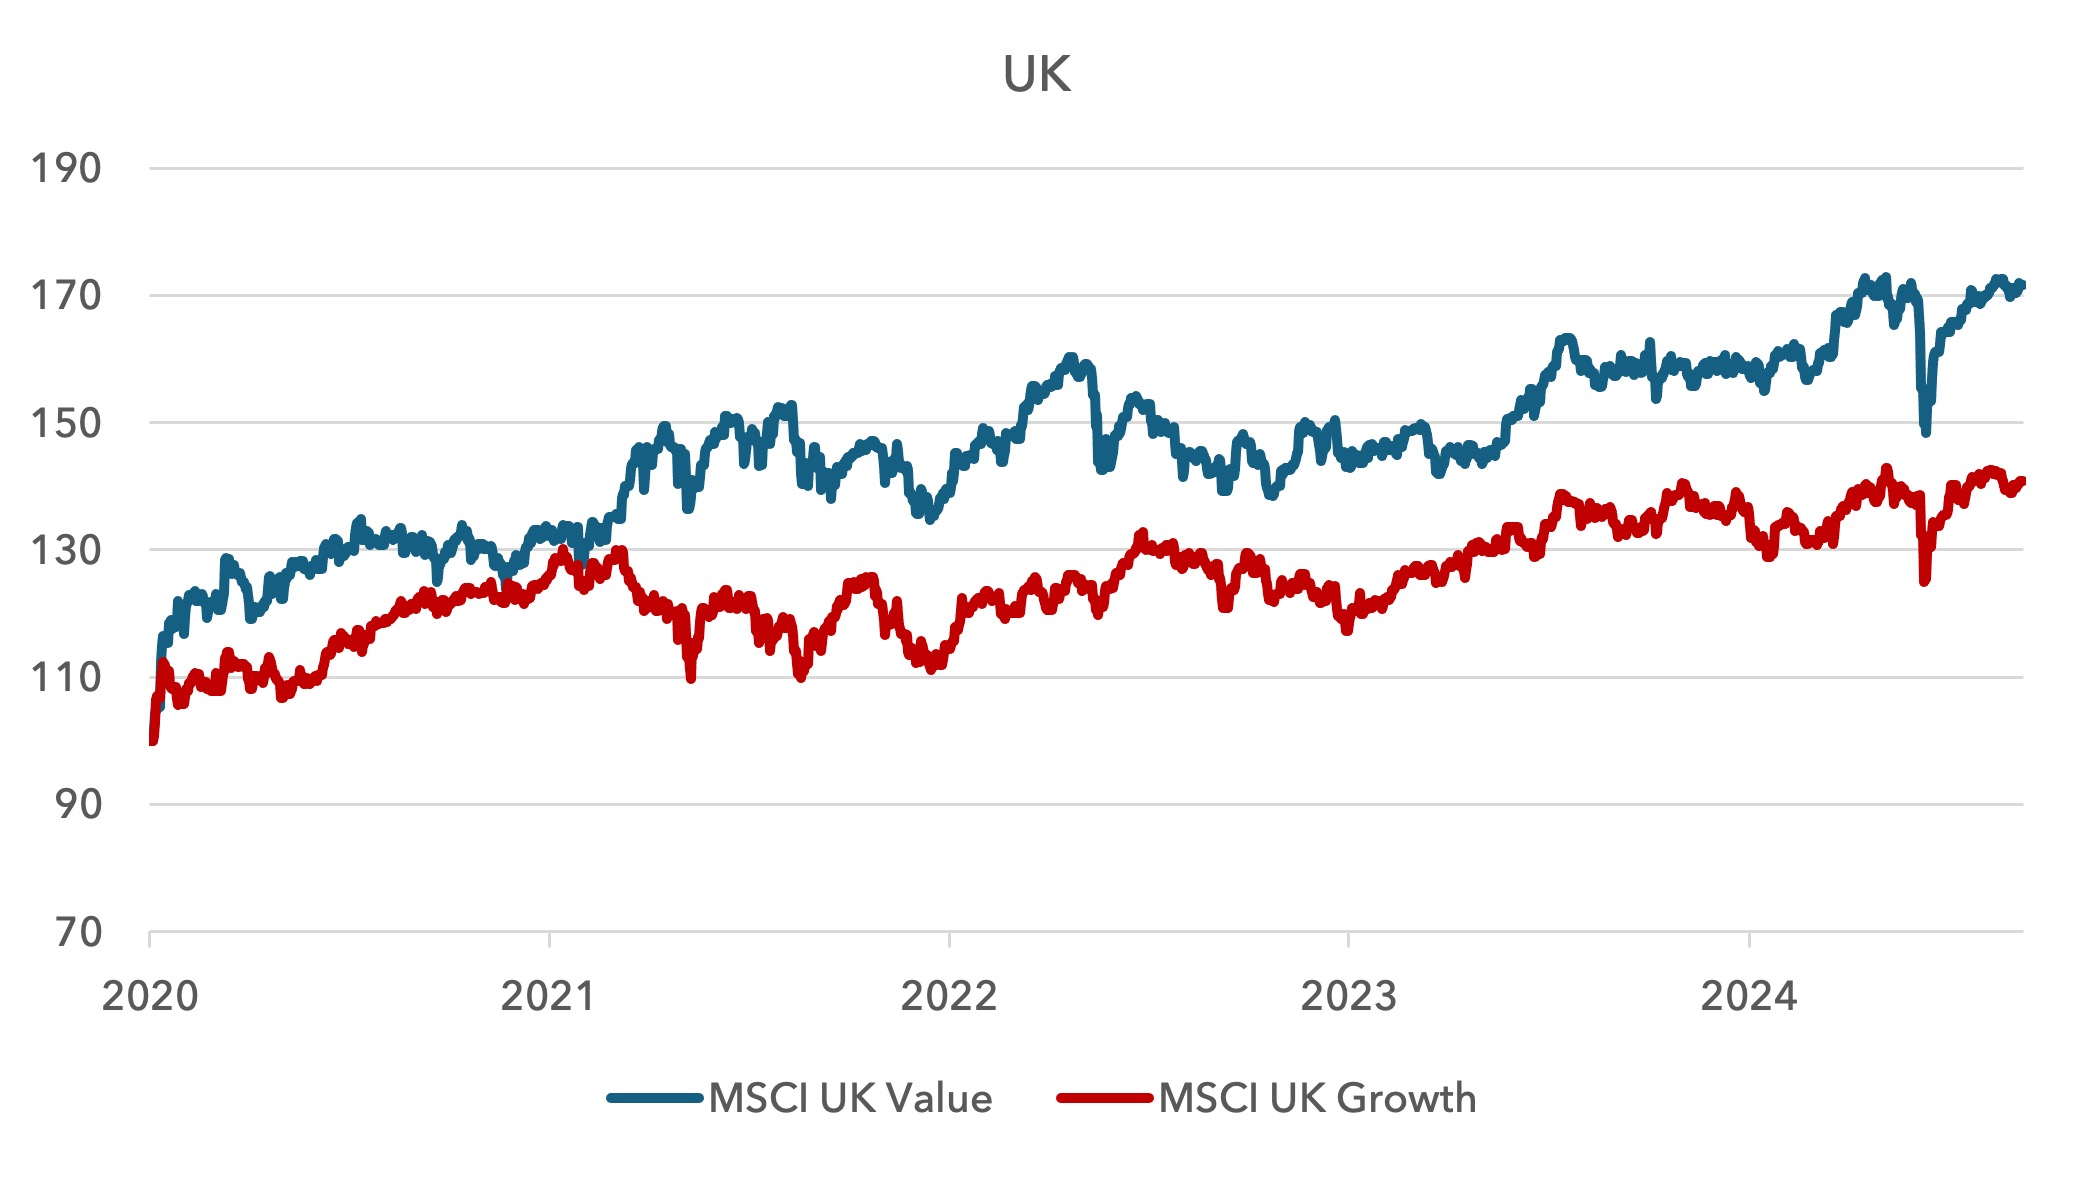
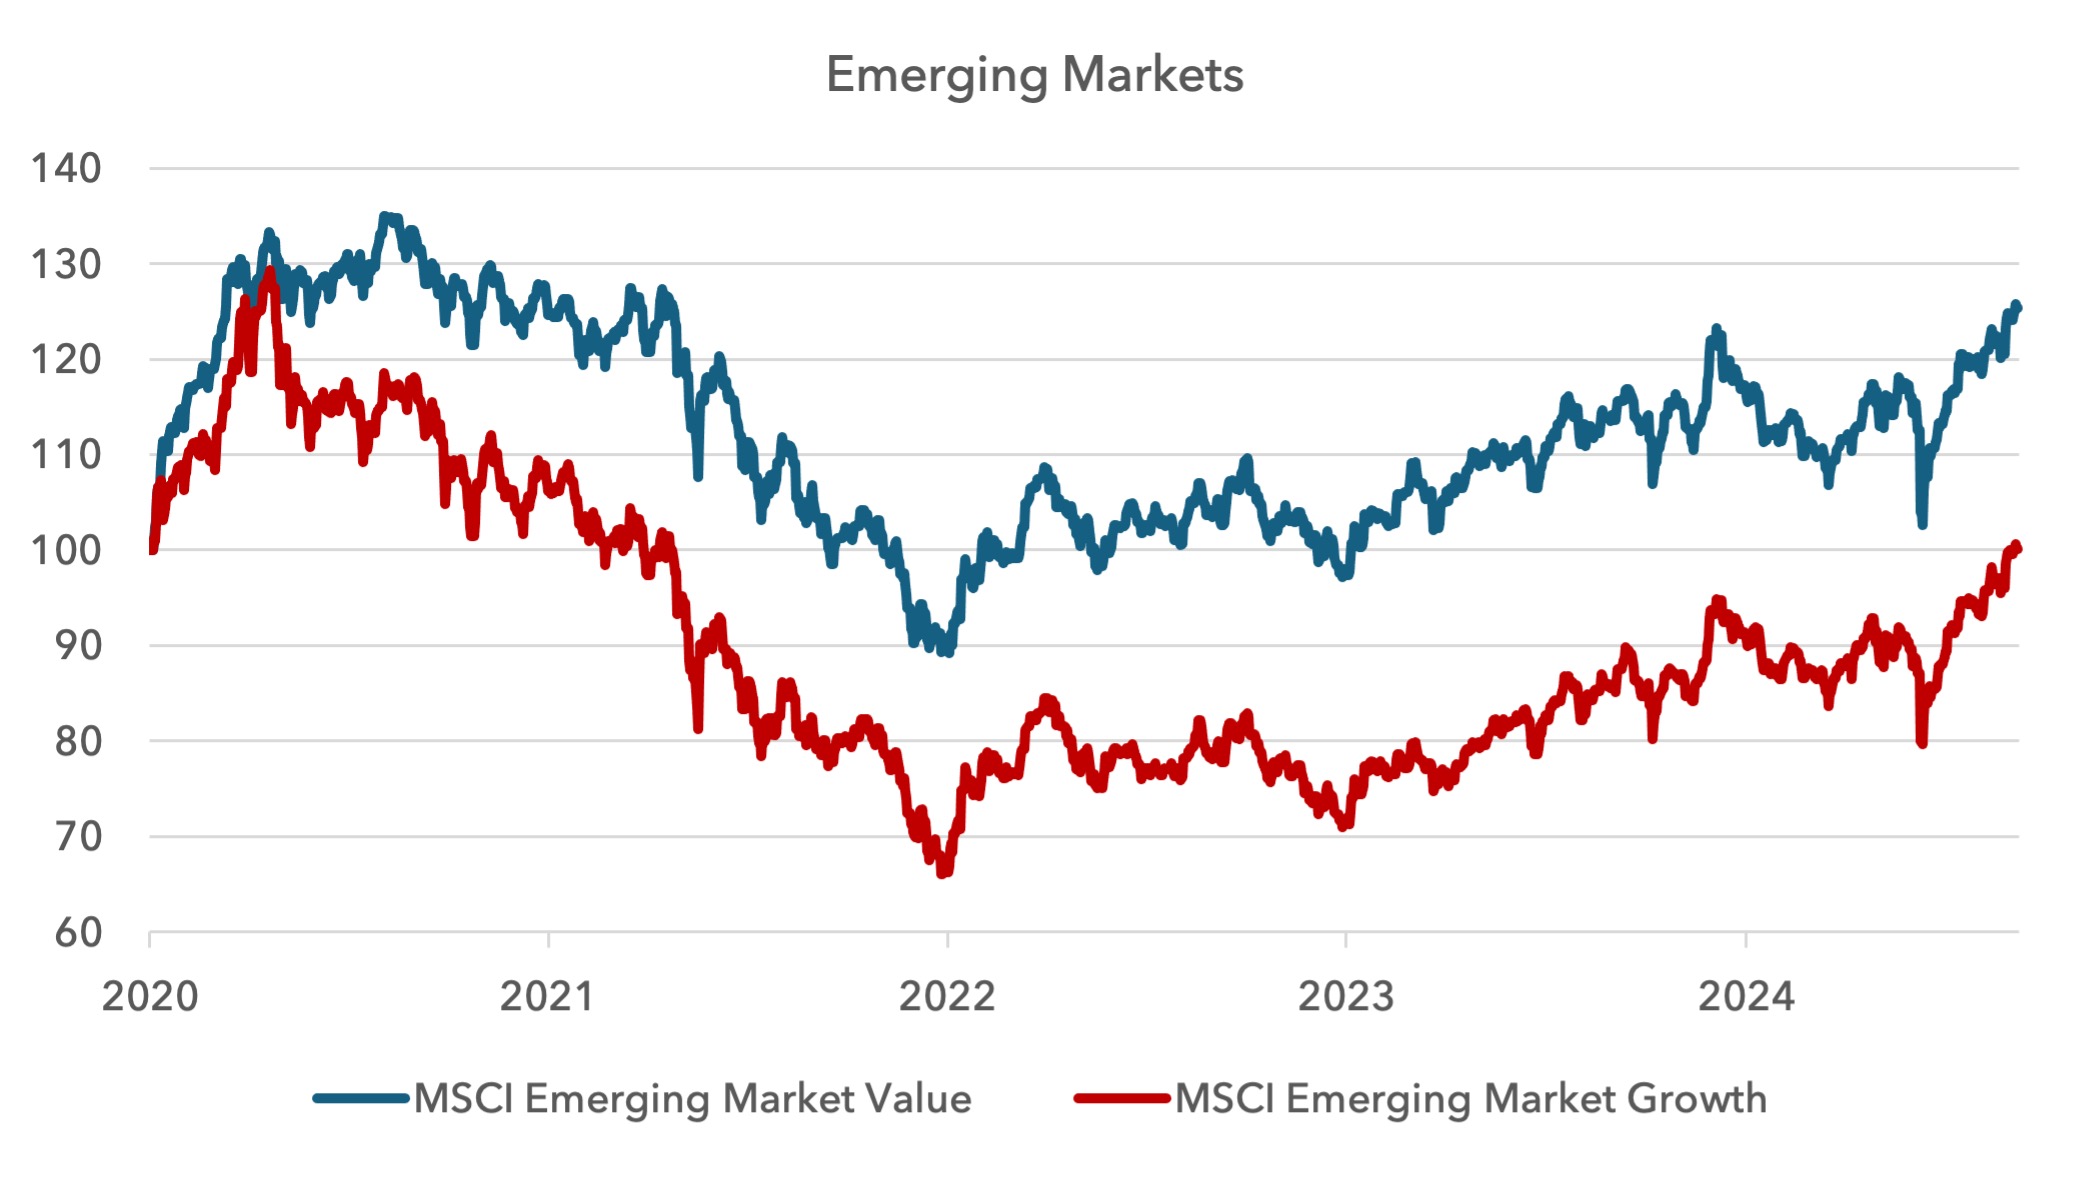
Value continues to gather momentum versus growth around the world
Value continues to dominate around the world, but because it is not outperforming in US large caps, few investors realise it. This under-the-radar outperformance is good news.
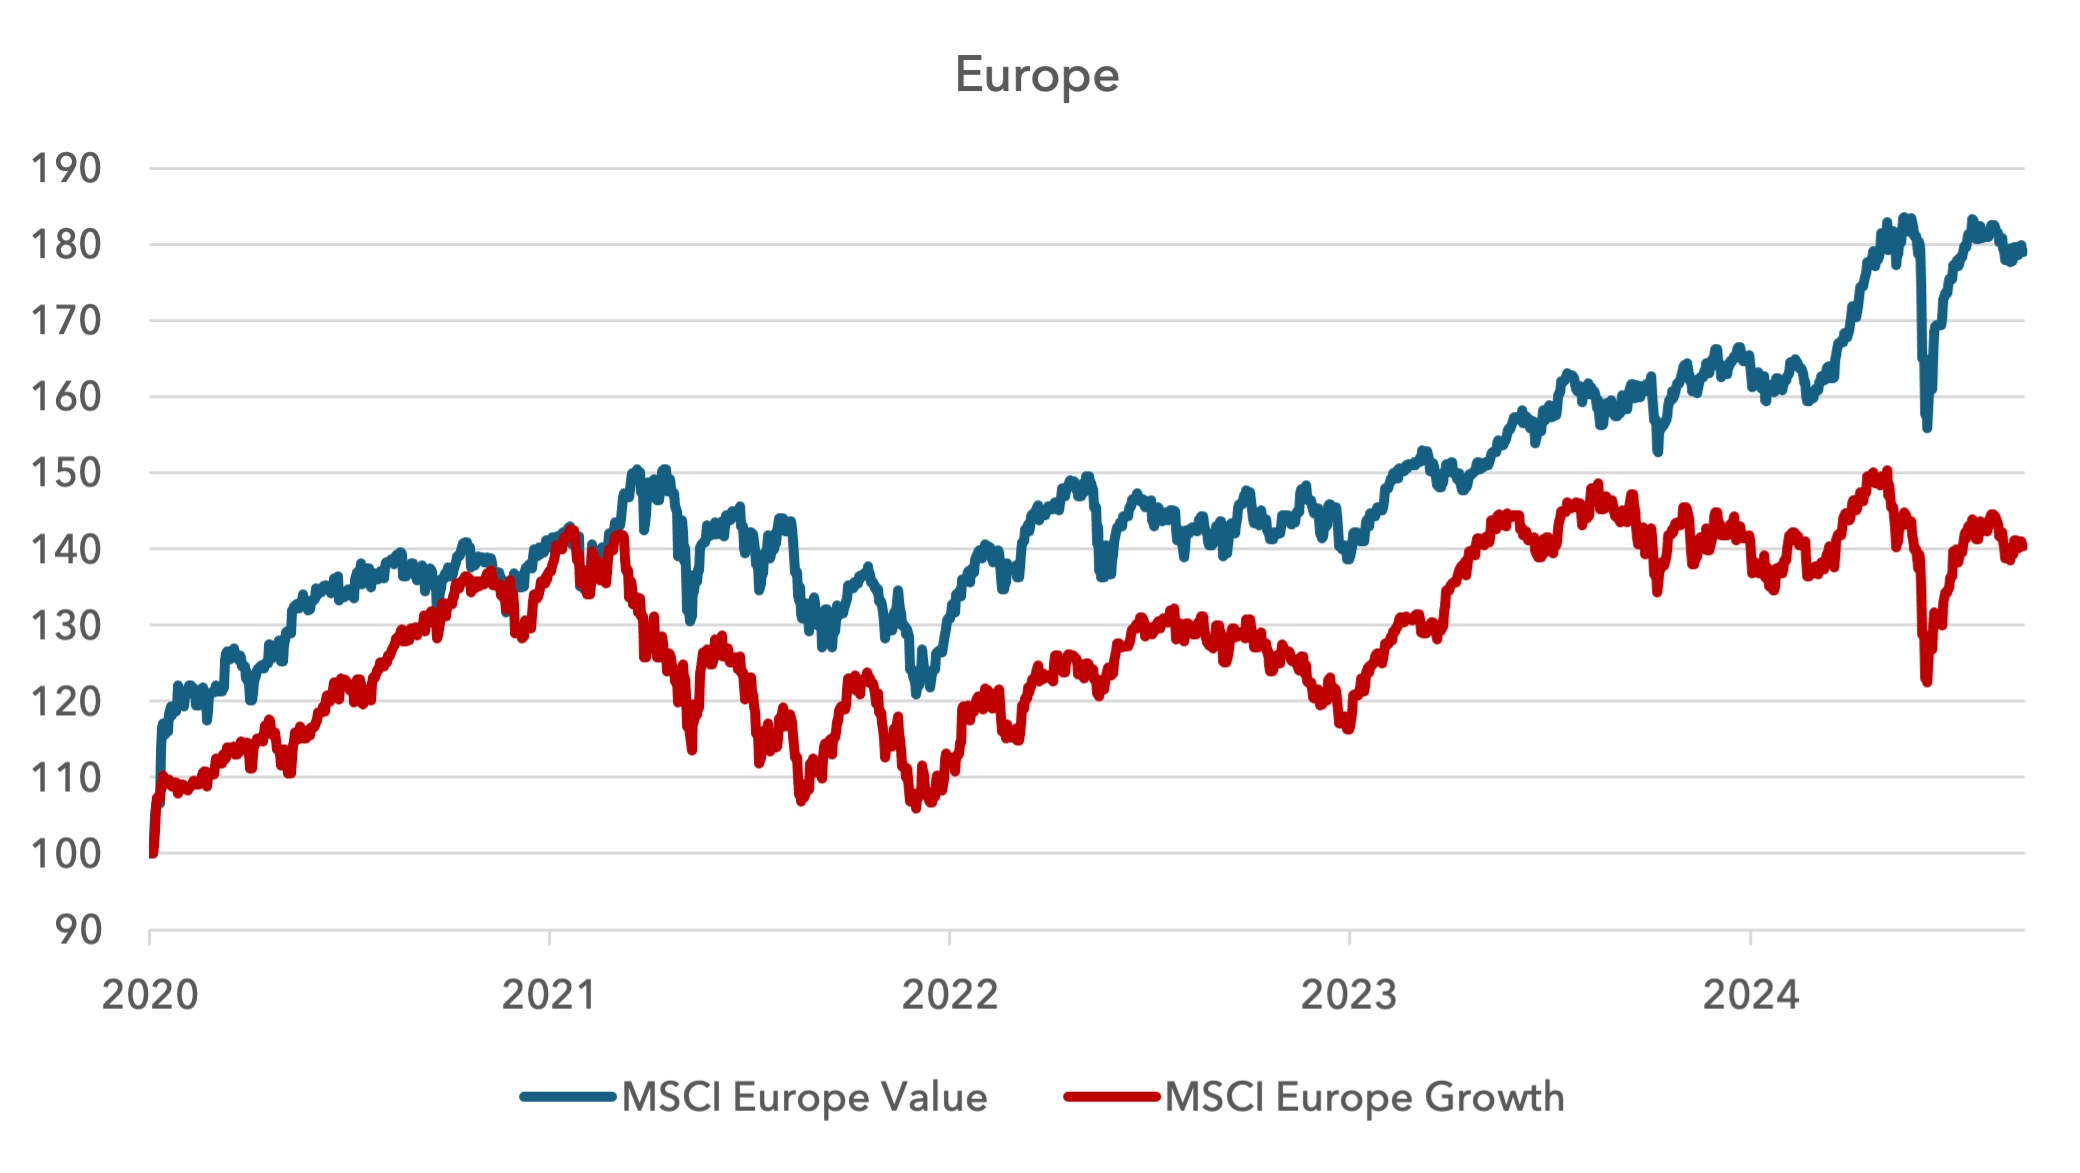
Below we update some charts illustrating this outperformance. The charts are for Europe, the UK, Japan and Emerging Markets and start on 31 October 2020, which was the turning point for value globally. All charts are normalised at 100 from the start date.

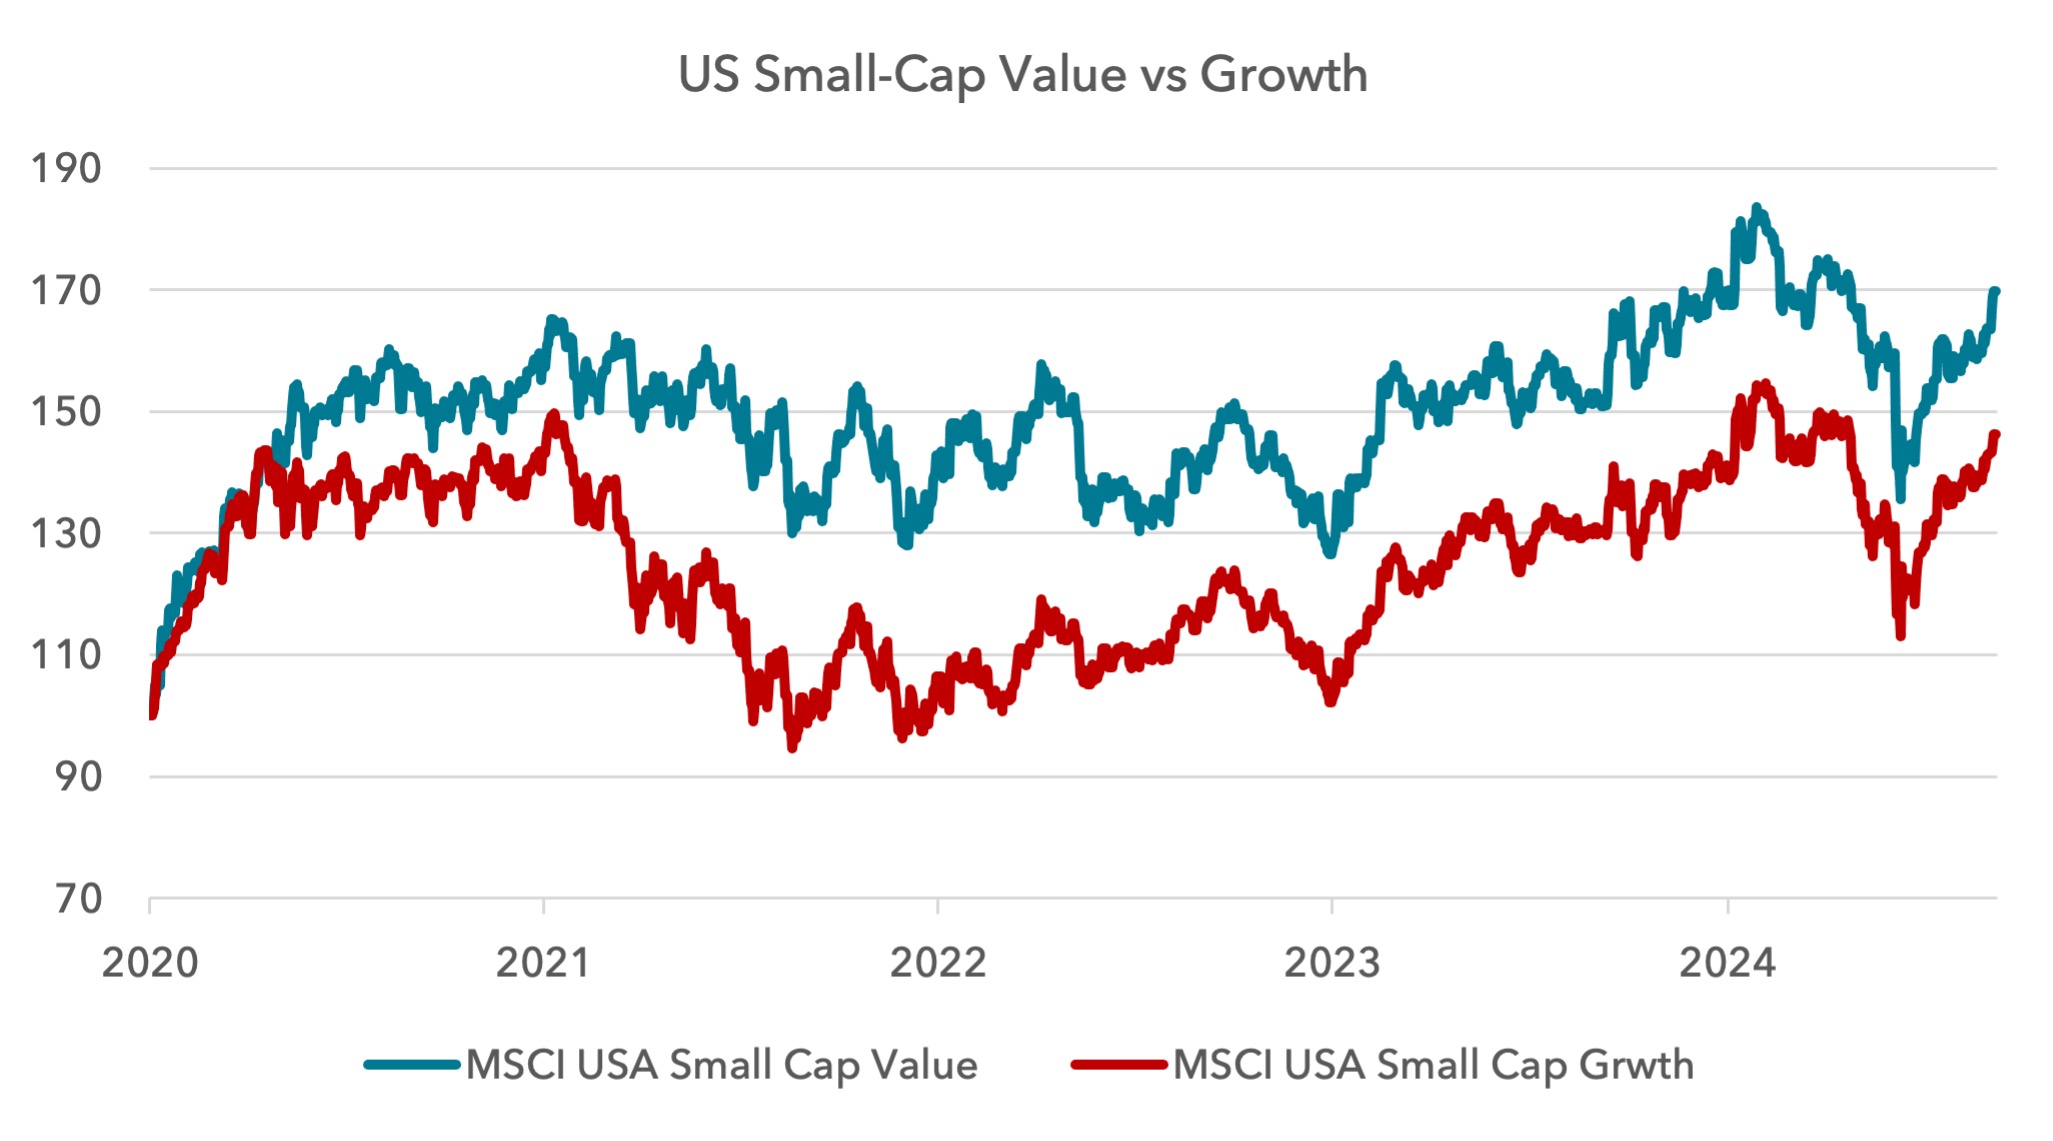
 The peculiarity of the US
In the US, small-cap value is behaving as in the rest of the world, with value in the ascendency from October 2020.
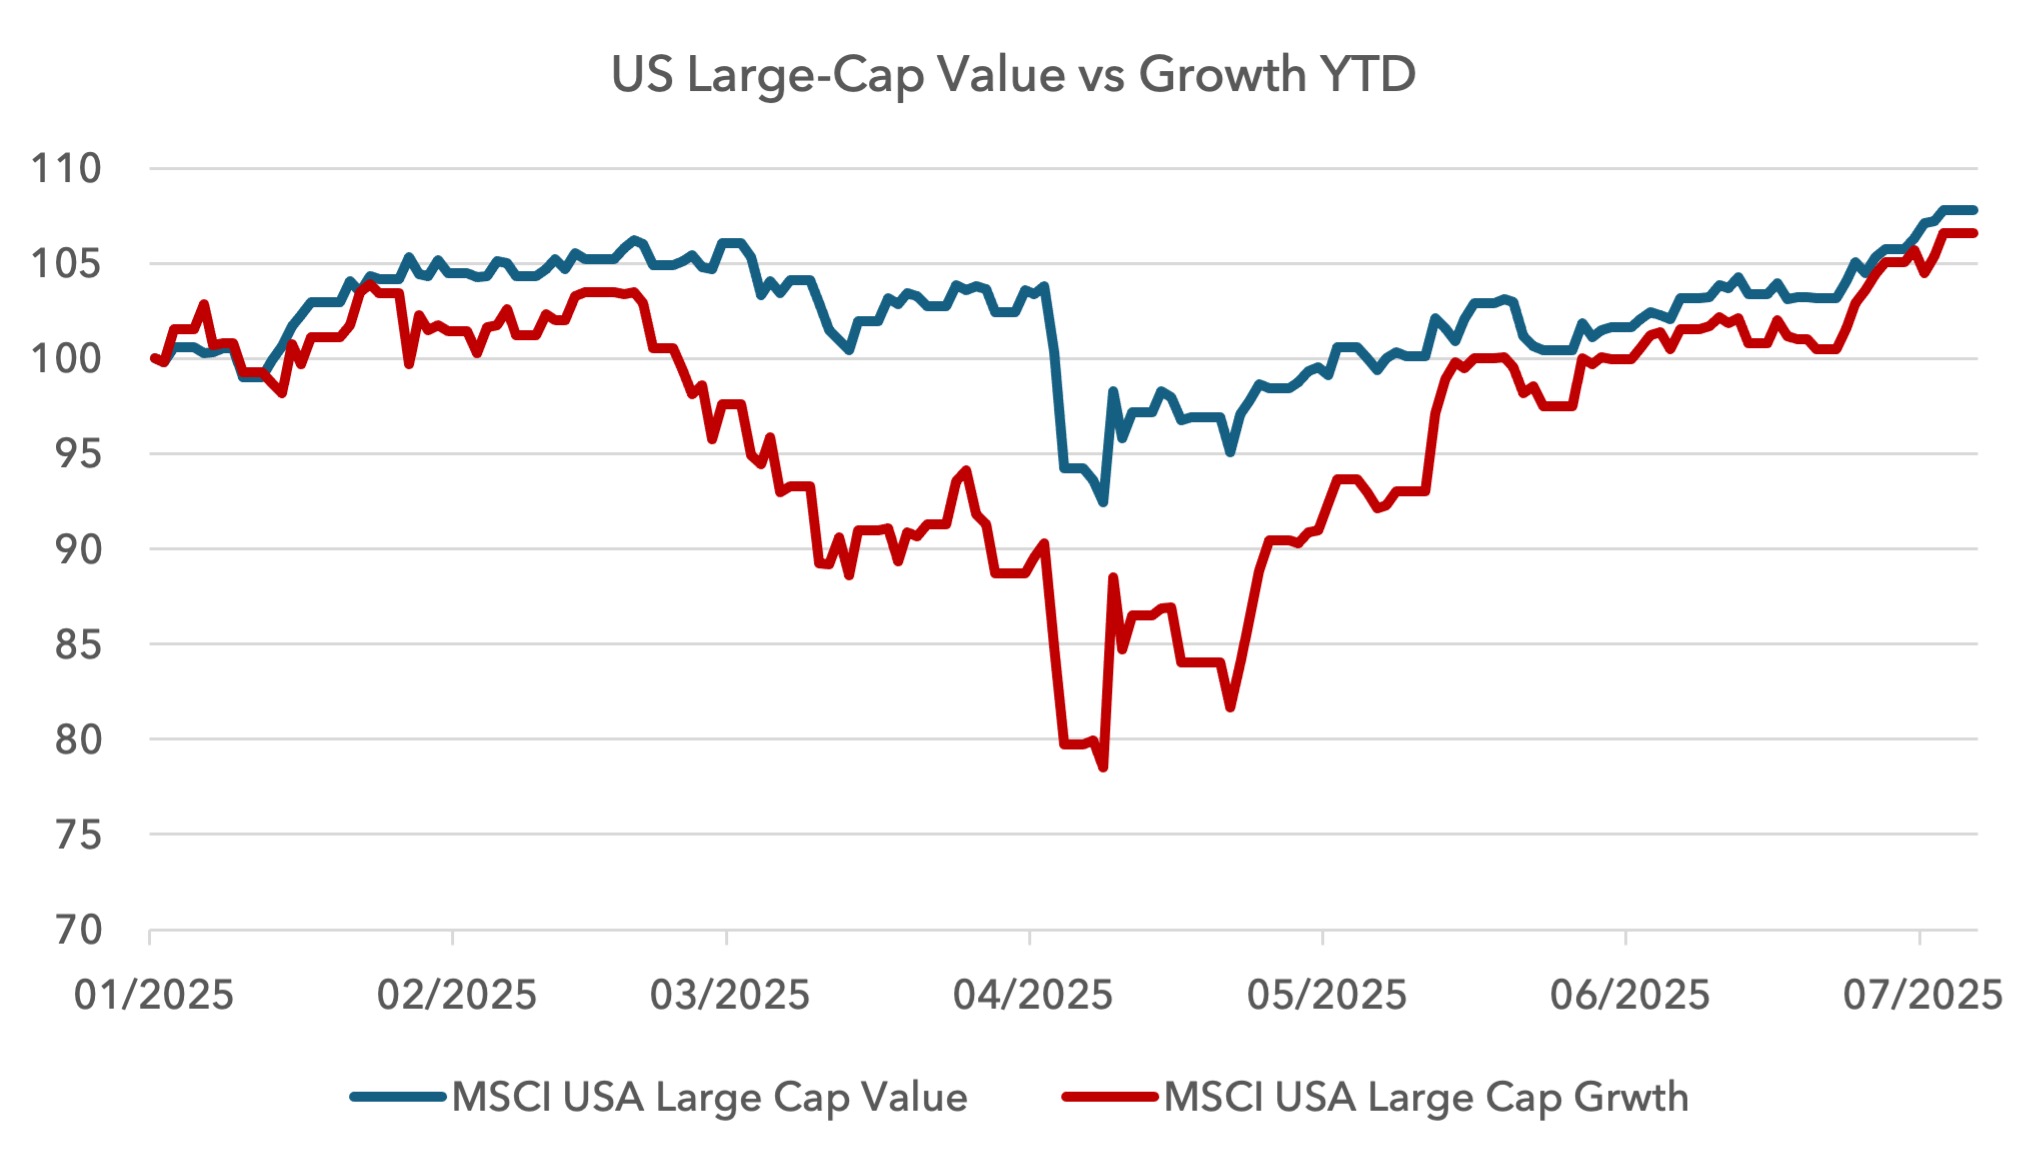
US mid-caps are pretty level between value and growth since late 2020, but as we all know, US large-cap growth is still outperforming. There was a major drawdown in 2022, when liquidity was negative, but large-cap growth recovered in 2023 and 2024.
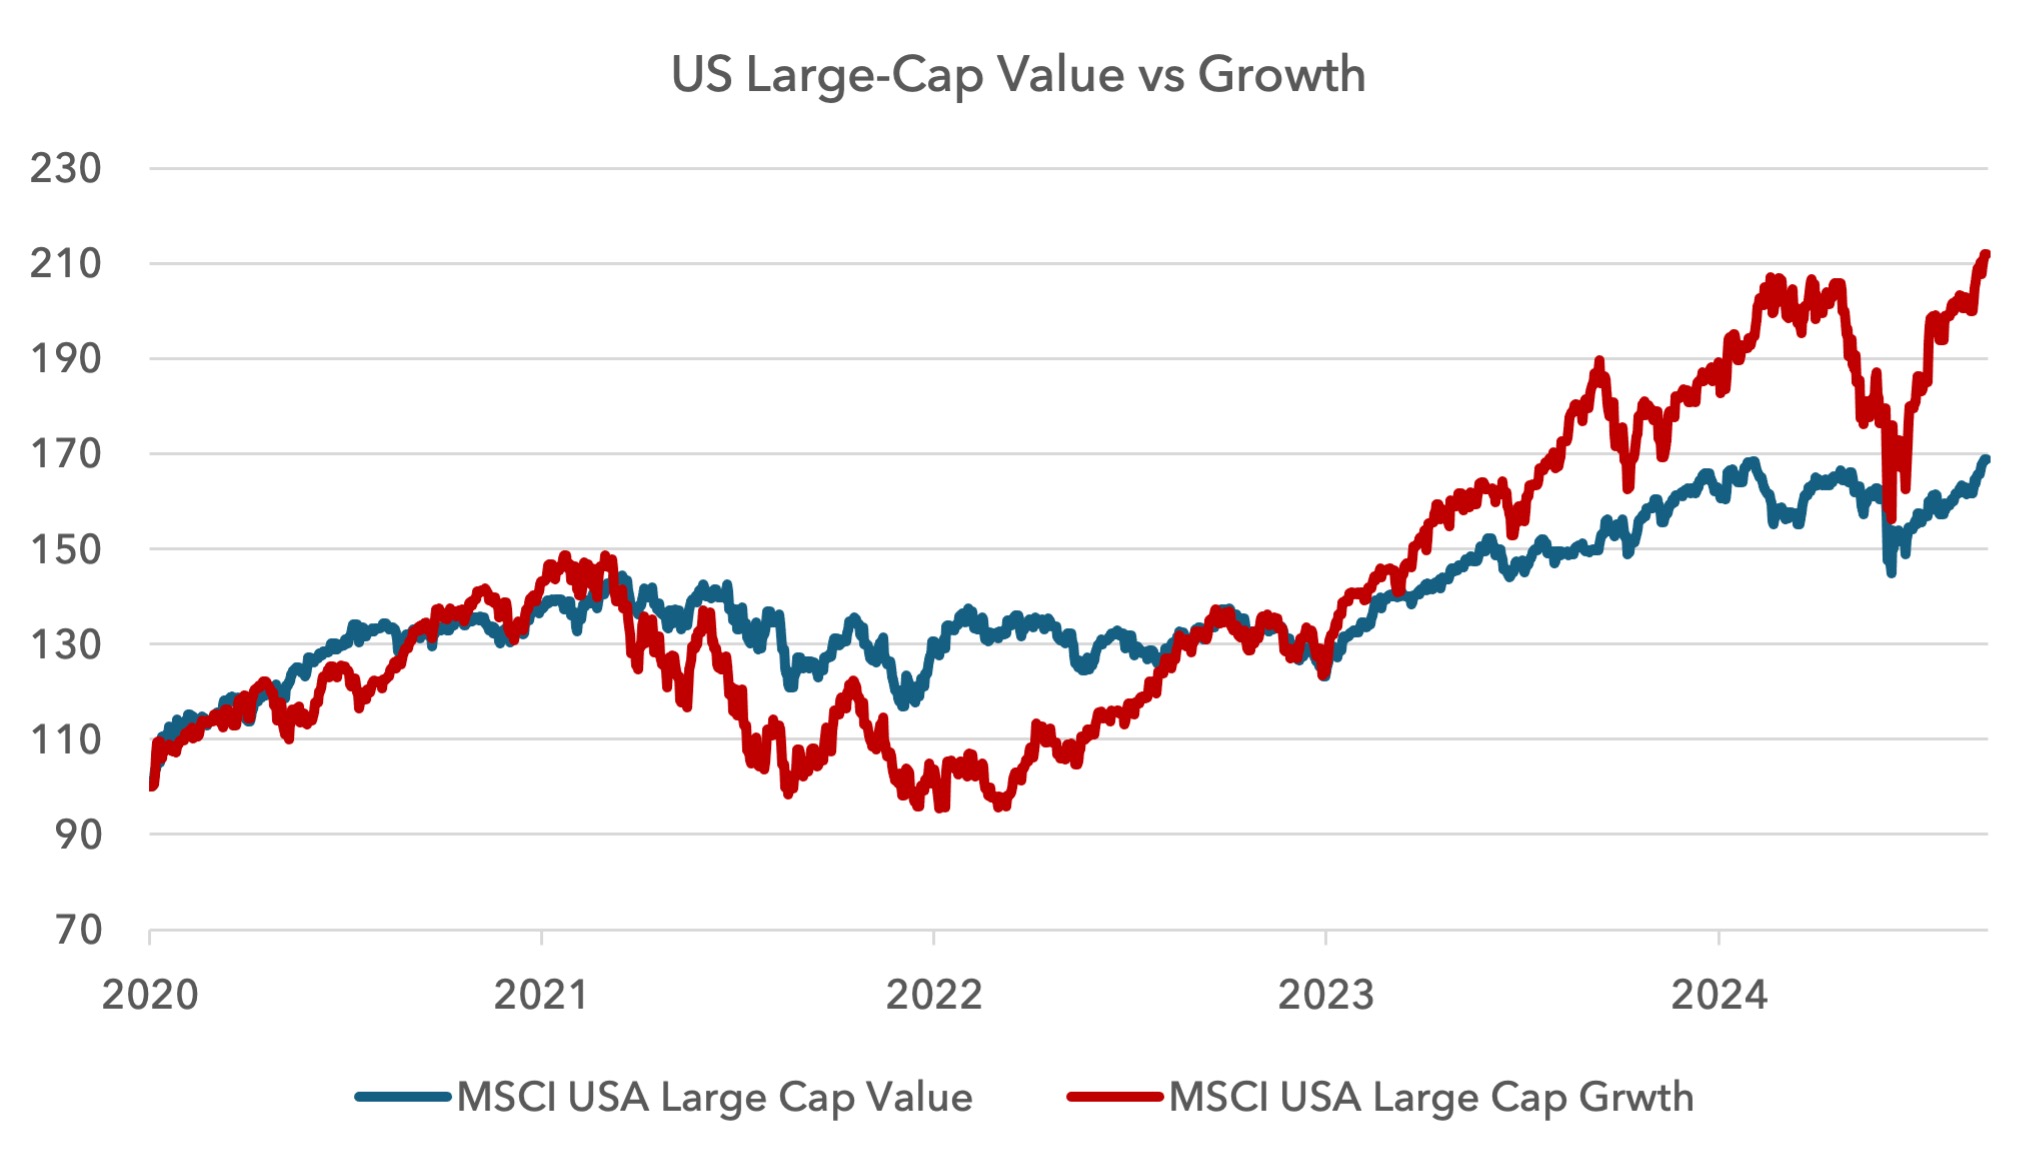
Interestingly, US large-cap growth is underperforming value in 2025 so far. Value was much more defensive in the drawdown earlier this year, and has given up a lot of its relative gains, but remains ahead of growth this year, albeit marginally. Risk-adjusted returns are far superior for US large-cap value compared to large cap growth year to date, over one year and since October 2020.
We expect the outperformance of US large-cap value to continue for the remainder of the year.
What does this mean for our European strategy?
Our outlook has not changed since the beginning of the year, and so we have not made major changes. We maintain our discipline of selling expensive equities and re-investing in high free cash flow yielding companies with strong balance sheets and the scope to do buy-backs.
Given our caution for US equities and possible spillover effects into other markets, we continue to believe it is sensible for the strategy to exhibit low downside volatility.
The European value index’s downside volatility has deteriorated this year, due to the large financials weight. We are more cautious on financials today and so are not exhibiting the same risk profile. When excluding financials, value remains defensive.
Our aim is to participate in the market’s moves up, but attempt to diminish downside volatility if conditions were to become more hostile. We continue to see the potential for upside in absolute and relative terms in the coming year, but we would expect these gains to be more modest than those experienced year to date.
Sources:
Z1 Flow of Funds, the Federal Reserve, US Treasury, Congressional Budget Office, Strategas, MSCI, Cameron Crise, Bloomberg, Lightman Investment Management.
Legal
Disclaimer
This communication and its content are owned by Lightman Investment Management Limited (“Lightman”, “we”, “us”). Lightman Investment Management Limited (FRN: 827120) is authorised and regulated by the Financial Conduct Authority (“FCA”) as a UK MiFID portfolio manager eligible to deal with professional clients and eligible counterparties in the UK. Lightman is registered with Companies House in England and Wales under the registration number 11647387, having its registered office at c/o Buzzacott LLP, 130 Wood Street, London, United Kingdom, EC2V 6DL.
Target audience
This communication is intended for ‘Eligible Counterparties’ and ‘Professional’ clients only, as described under the UK Financial Services and Markets Act 2000 (“FSMA”) (and any amendments to it). It is not intended for ‘Retail’ clients and Lightman does not have permission to provide investment services to retail clients. Generally, marketing communications are only intended for ‘Eligible Counterparties’ and ‘Professional’ clients in the UK, unless they are being used for purposes other than marketing, such as regulations and compliance etc. The Firm may produce marketing or communication documents for selected investor types in non UK jurisdictions. Such documents would clearly state the target audience and target jurisdiction.
Collective Investment Scheme(s)
The collective investment scheme(s) – WS Lightman Investment Funds (PRN: 838695) (“UK OEIC”, “UK umbrella”), and WS Lightman European Fund (PRN: 838696) (“UK sub-fund”, “UK product”) are regulated collective scheme(s), authorised and regulated by the FCA. In accordance with Section 238 of FSMA, such schemes can be marketed to the UK general public. Lightman, however, does not intend to receive subscription or redemption orders from retail clients and accordingly such retail clients should either contact their investment adviser or the Management Company Waystone Management (UK) Limited (“Waystone UK”) in relation to any fund documents.
The collective investment scheme(s) - Elevation Fund SICAV (Code: O00012482) (“Luxembourg SICAV”, “Luxembourg umbrella”), and Lightman European Equities Fund (Code: O00012482_00000002) (“Luxembourg sub-fund”, “Lux product”) are regulated undertakings for collective investments in transferrable securities (UCITS), authorised and regulated by the Commission de Surveillance du Secteur Financier (CSSF) in Luxembourg. In accordance with regulatory approvals obtained under the requirements of the Law of 17 December 2010 relating to undertakings for collective investment, the schemes can be marketed to the public in Luxembourg, Norway, Spain, and Republic of Ireland. Lightman, however, does not intend to receive subscription or redemption orders from any client types for the Lux product and accordingly such client should either contact a domestic distributor, domestic investment advisor or the Management Company Link Fund Solutions (Luxembourg) S.A. (“Link Luxembourg”) in relation to any fund documents.
Luxembourg umbrella and Luxembourg sub-fund are also approved for marketing to professional clients and eligible counterparties in the UK under the UK National Private Placement Regime (NPPR). UK registration numbers for the funds are as follows: Elevation Fund SICAV (PRN: 957838) and Lightman European Equities Fund (PRN: 957839). Please write to us at compliance@lightmanfunds.com for proof of UK registration of the funds.
Luxembourg sub-fund is also approved for marketing to qualified investors in Switzerland, within the meaning of Art. 10 para. 3 and 3ter CISA. In Switzerland, the representative is Acolin Fund Services AG, Leutschenbachstrasse 50, 8050 Zurich, Switzerland, whilst the paying agent is NPB Neue Privat Bank AG, Limmatquai 1 / am Bellevue, 8024 Zurich, Switzerland.
Accuracy and correctness of information
Lightman takes all reasonable steps to ensure the accuracy and completeness of its communications; we however request all recipients to contact us directly for the latest information and documents as issued documents may not be fully updated. We cannot accept any liability arising from loss or damage from the use of this communication.
Wherever our communications refer to a third party such as Waystone, Link, Northern Trust etc., we cannot accept any responsibility for the availability of their services or the accuracy and correctness of their content. We urge users to contact the third party for any query related to their services.
Important information for non-UK persons (Including US persons)
This communication is not intended for any person outside of the UK, Switzerland, or the European Economic Area (EEA). Lightman or any of the funds referenced in this communication are not approved for marketing outside of the UK, Switzerland, or the EEA. All such persons must consult their domestic lawyers in relation to services or products offered by Lightman.
Risk warning to all investors
The value of investments in any financial assets may fall as well as rise. Investors may not get back the amount they originally invested. Past performance is not an indicator of future performance. Potential investors should not use this communication as the basis of an investment decision. Decisions to invest in any fund should be taken only on the basis of information available in the latest fund documents. Potential investors should carefully consider the risks described in those documents and, if required, consult a financial adviser before deciding to invest.
Offer, advice, or recommendation
No information in this communication is intended to act as an offer, investment advice or recommendation to buy or sell a product or to engage in investment services or activities. You must consult your investment adviser or a lawyer before engaging in any investment service or product.
GDPR
Lightman may process personal information of persons using this communication. Please read our privacy policy.
Copyright
This communication cannot be distributed or reproduced without our consent.