
- In early October last year global central bank liquidity started to move higher, led by the Bank of Japan and the People’s Bank of China
- This balance sheet expansion more than offset the decline in liquidity from the Federal Reserve, the European Central Bank and the Bank of England, and it coincided with the rally in equities
- Dollar weakness occurred at a similar time and amplified the impact of these changes
- The Bank of Japan is now playing an outsized role in global markets. Asset prices may be vulnerable if the Bank of Japan changes its policy
One of the headwinds for equity markets last year, in addition to higher interest rates, came from a reduction of central bank balance sheets. This reduced financial system liquidity. In local currency terms, this trend has continued in 2023 for the Federal Reserve (Fed), the European Central Bank (ECB) and the Bank of England (BoE), as we show below.
Local Currency Central Bank Balance Sheet Size: Fed, ECB, BoE, December 2021 to January 2023
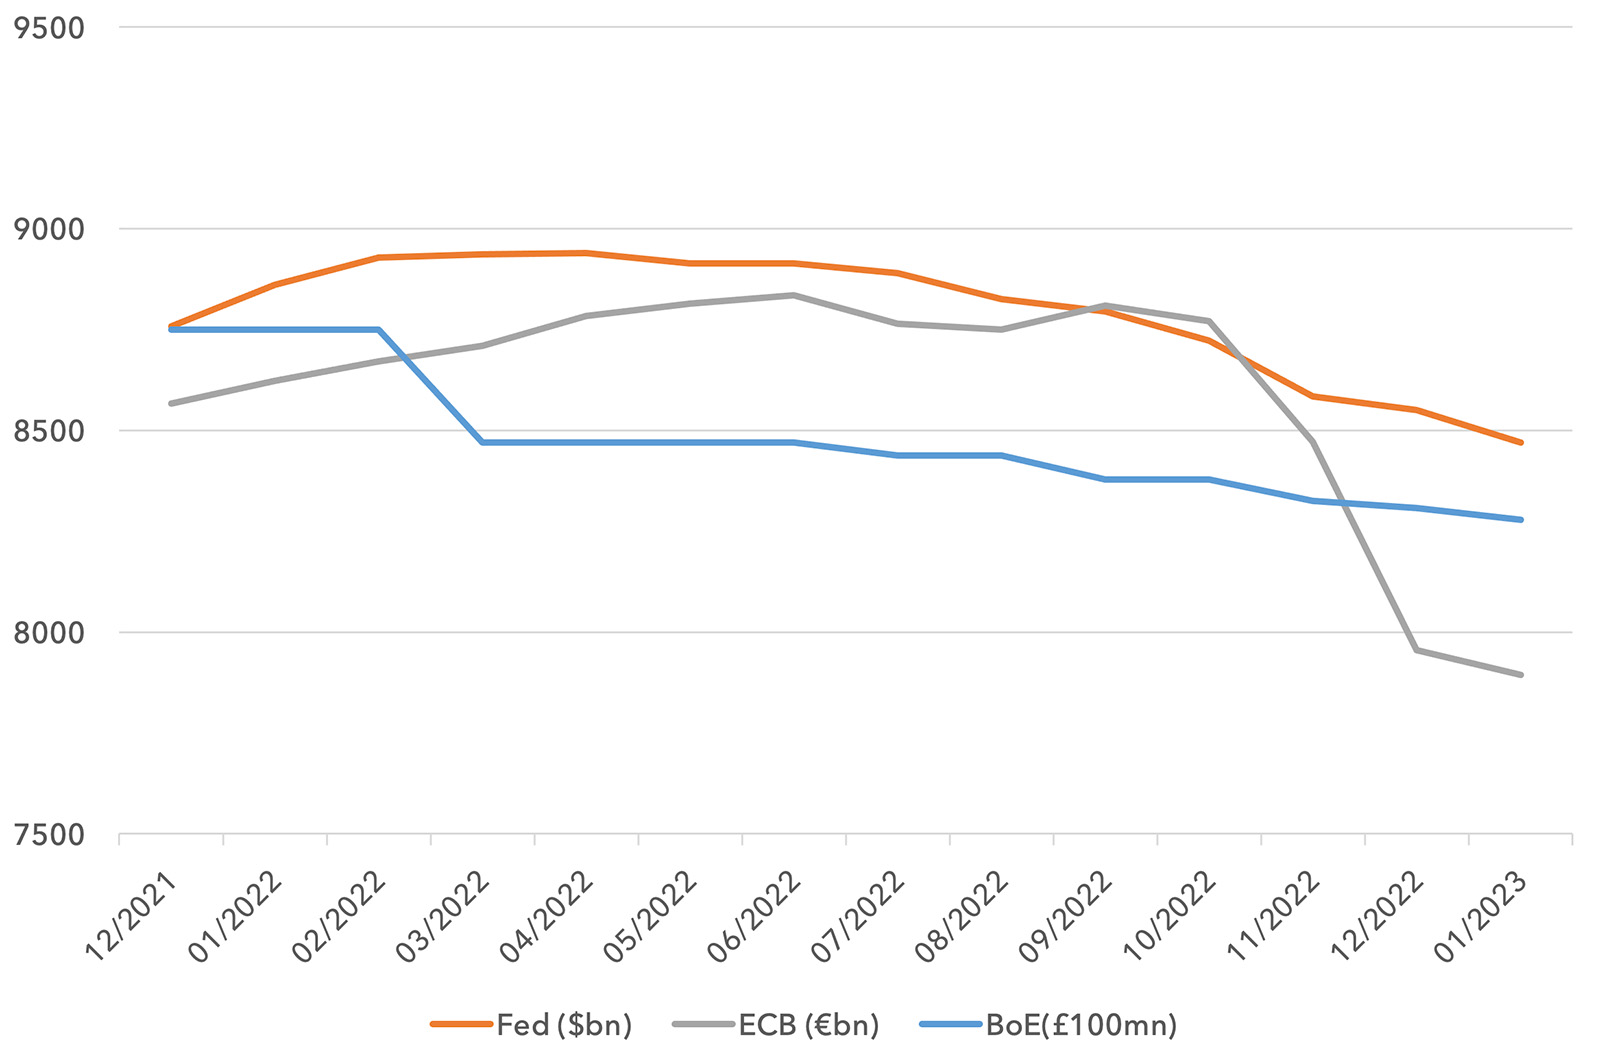
There is a technical and slightly arcane argument amongst some investors about the components of the Fed’s balance sheet reduction, namely how certain components have changed and what this might mean. Some argue that from September to mid-January, the Fed had offset quantitative tightening by reducing less market sensitive components of their balance sheet and increasing more market sensitive components. But this argument is a stretch. Bigger picture, the Fed balance sheet is shrinking. Over the last month all major components of their balance sheet are shrinking and they are set to shrink further through 2023. All in all it is hard to argue the Fed is adding liquidity into the system and supporting markets in 2023.
As we show below, the far bigger story is what is happening at the Bank of Japan (BoJ) and the People’s Bank of China (PBoC). For most of the first nine months of 2022, both central banks were reducing the size of their balance sheets. But this changed in September and October.
Local Currency Central Bank Balance Sheet Size: PBoC & BoJ, December 2021 to January 2023
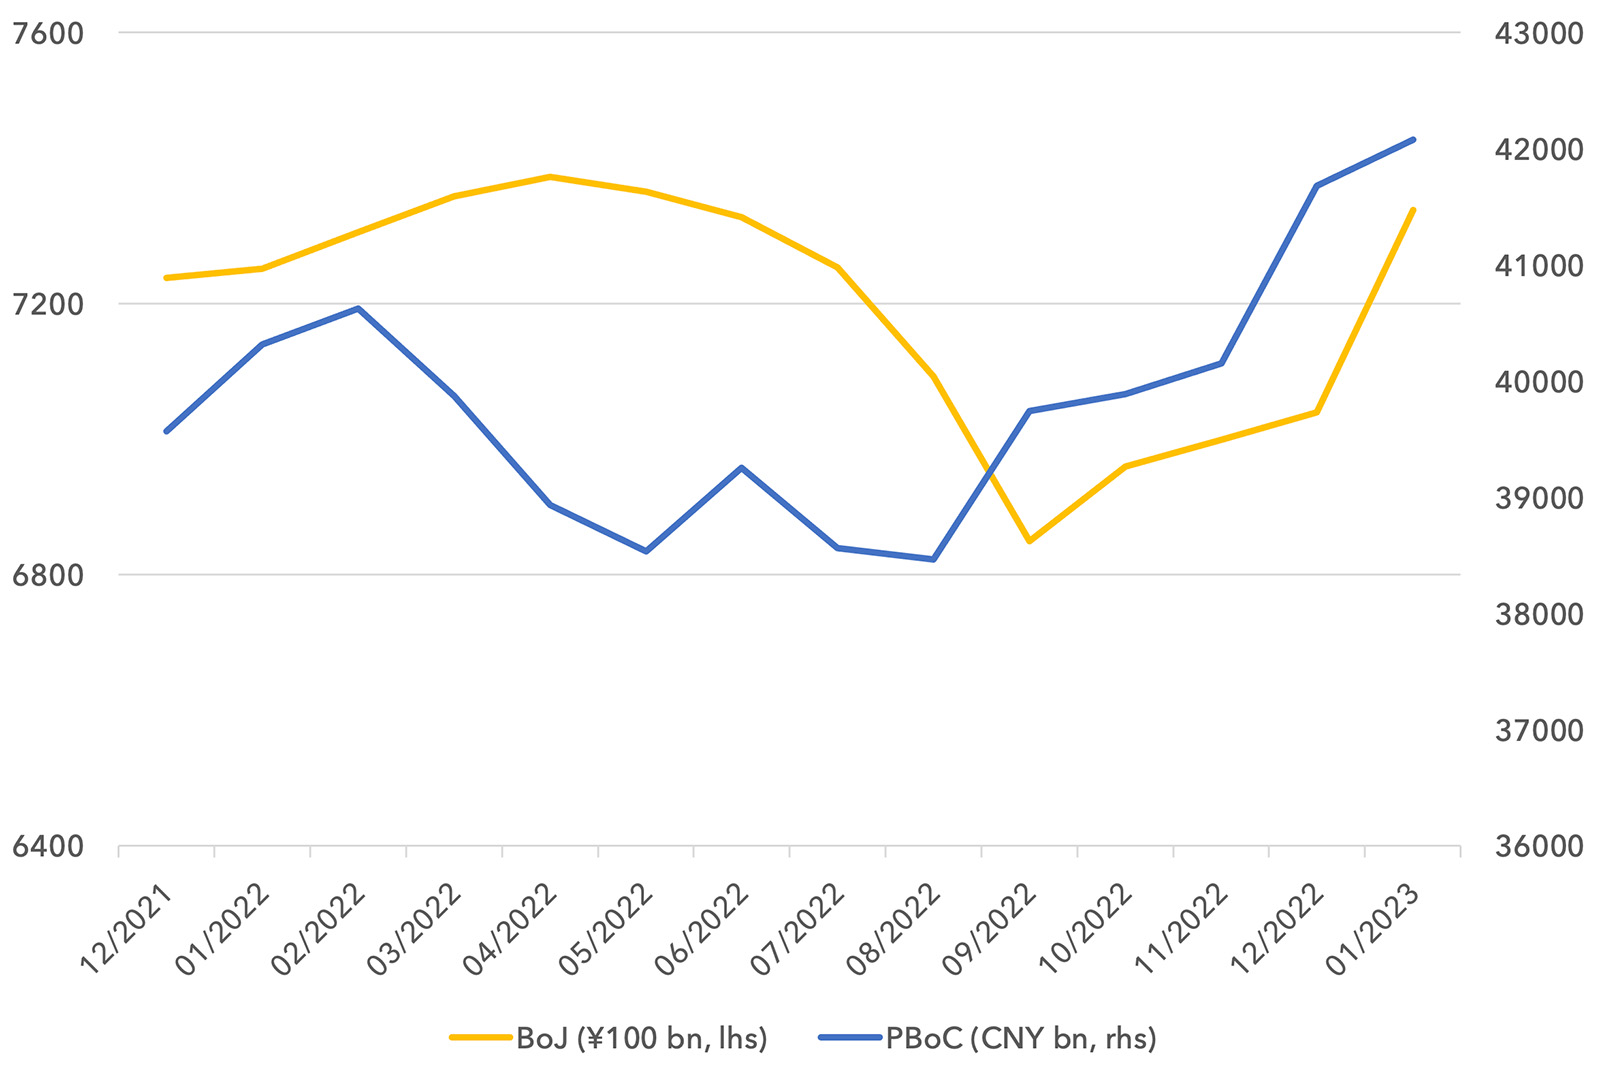
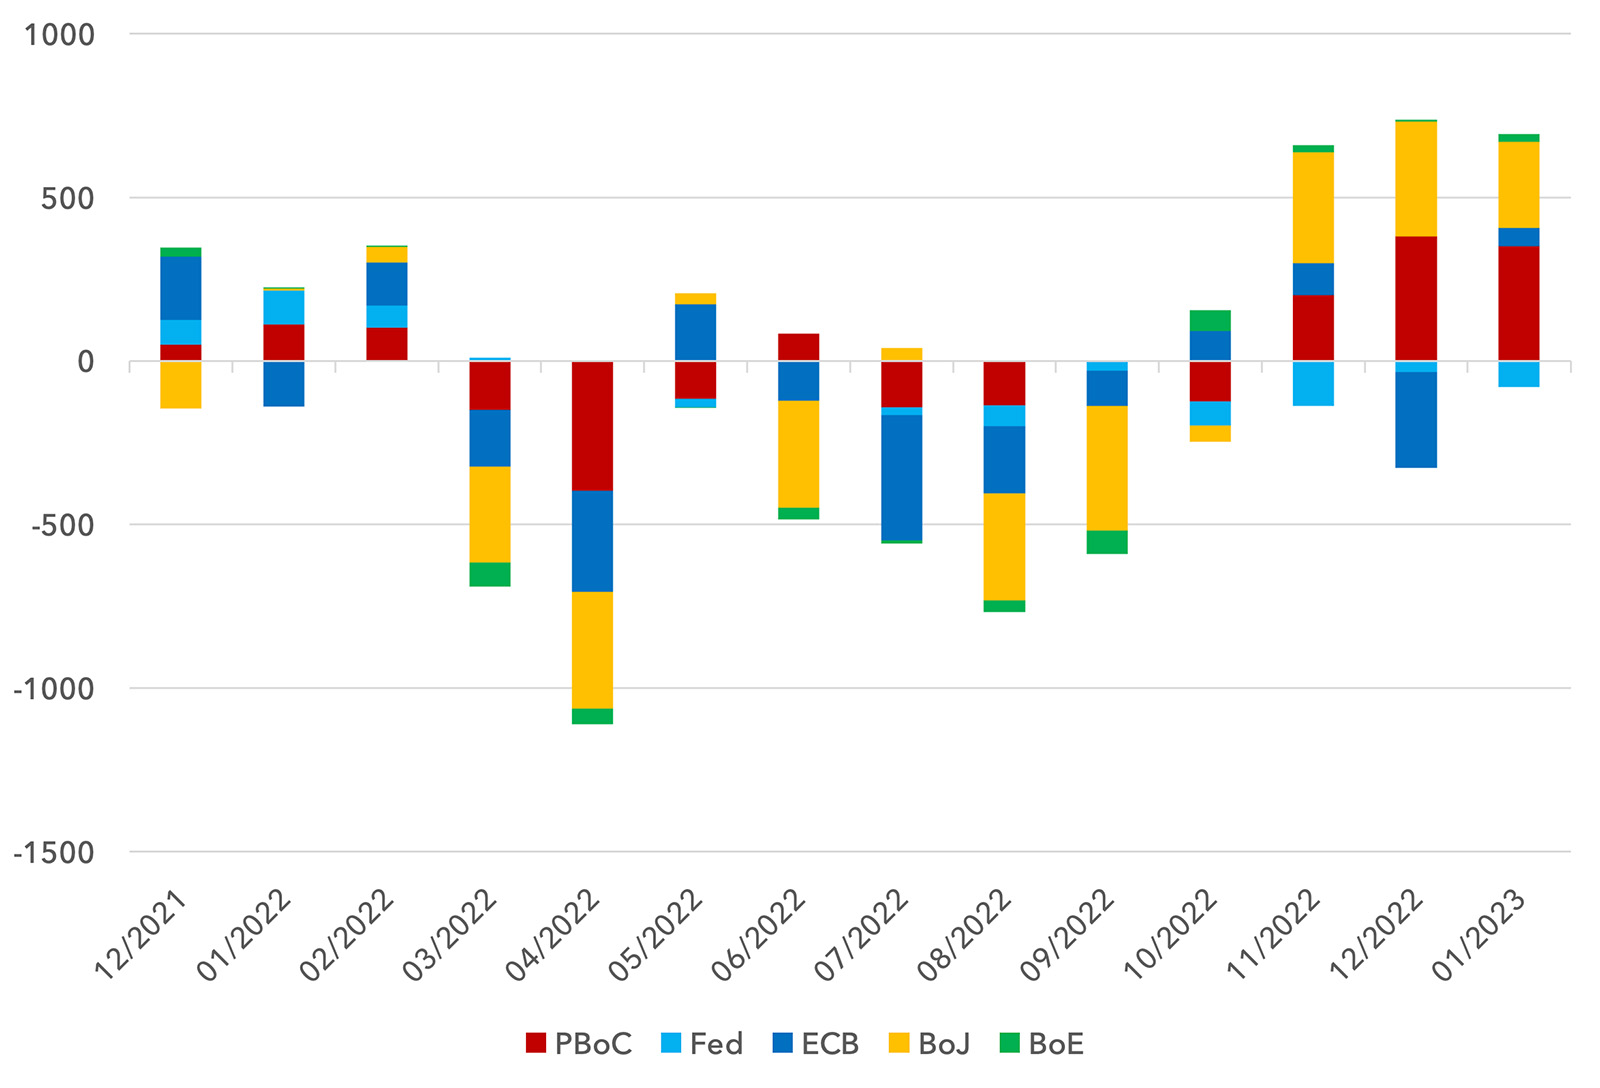
When we look at the monthly evolution of these central bank balance sheets in dollars, the picture becomes clearer. The decline in the dollar from late September significantly amplified the impact of the BoJ and the PBoC’s actions in dollar terms. As shown, we saw broad contractions in dollar liquidity for the first nine months of 2022, but things changed abruptly in the fourth quarter. Both the BoJ and PBoC have had an average monthly balance sheet expansion of over $300bn in each of the last three months. This has dwarfed any quantitative tightening from the rest of the world.
Monthly change in Central Bank Balance Sheets, $bn
The catalyst for the Chinese intervention was the confirmation of Xi’s third term and a renewed focus on stabilising the economy.
There is a valid question around the impact of the PBoC’s actions for non-Chinese markets. Since China has an effectively closed capital account, their liquidity injections are not available for global markets to a meaningful extent. Clearly the Chinese actions will have an outsized impact on domestic Chinese asset prices and perhaps commodity prices. They will also lift their economy and help global growth, but the liquidity alone may have less of an impact on securities outside China. For this reason, we should focus on the BoJ as being the most impactful on global dollar liquidity. Given the scale of current BoJ operations, any policy change from them will matter most for markets.
The catalyst for Japan’s balance sheet expansion came from market pressure. The BoJ do not want to expand their balance sheet, but have been forced into it. Japan has had a 10 year yield cap in place for Japanese government bonds (JGBs) since 2016. From October 2016 to July 2018 the upper limit of the JGB yield cap was set at 10 basis points (bps). It moved up to 20bps in July 2018 and 25bps in March 2021. Given Japan’s low inflation at that time and given the BoJ’s threat of infinite buying power, the BoJ did not need to buy many securities for most of this period.
In February 2022, as global yields began to rise, JGB yields began to move toward the 25bps upper limit. From April to June 2022 the BoJ was forced to make some interventions to hold the cap, but the real pressure came from the second acceleration higher in global yields in September and October 2022. No doubt the UK’s experience of disorderly gilt markets also caused major concern amongst Japanese policymakers. Interventions became larger in the fourth quarter.
On 20 December the BoJ staged a partial retreat, lifting the yield cap to 50bps. But this only encouraged investors to believe the yield cap was about to be abandoned, with investors continuing to short JGBs, now up to the 50bps cap. This has forced the BoJ to make an enormous intervention in mid-January this year to hold that level. At the time of writing yields are at 49.3bps and testing the upper limit.
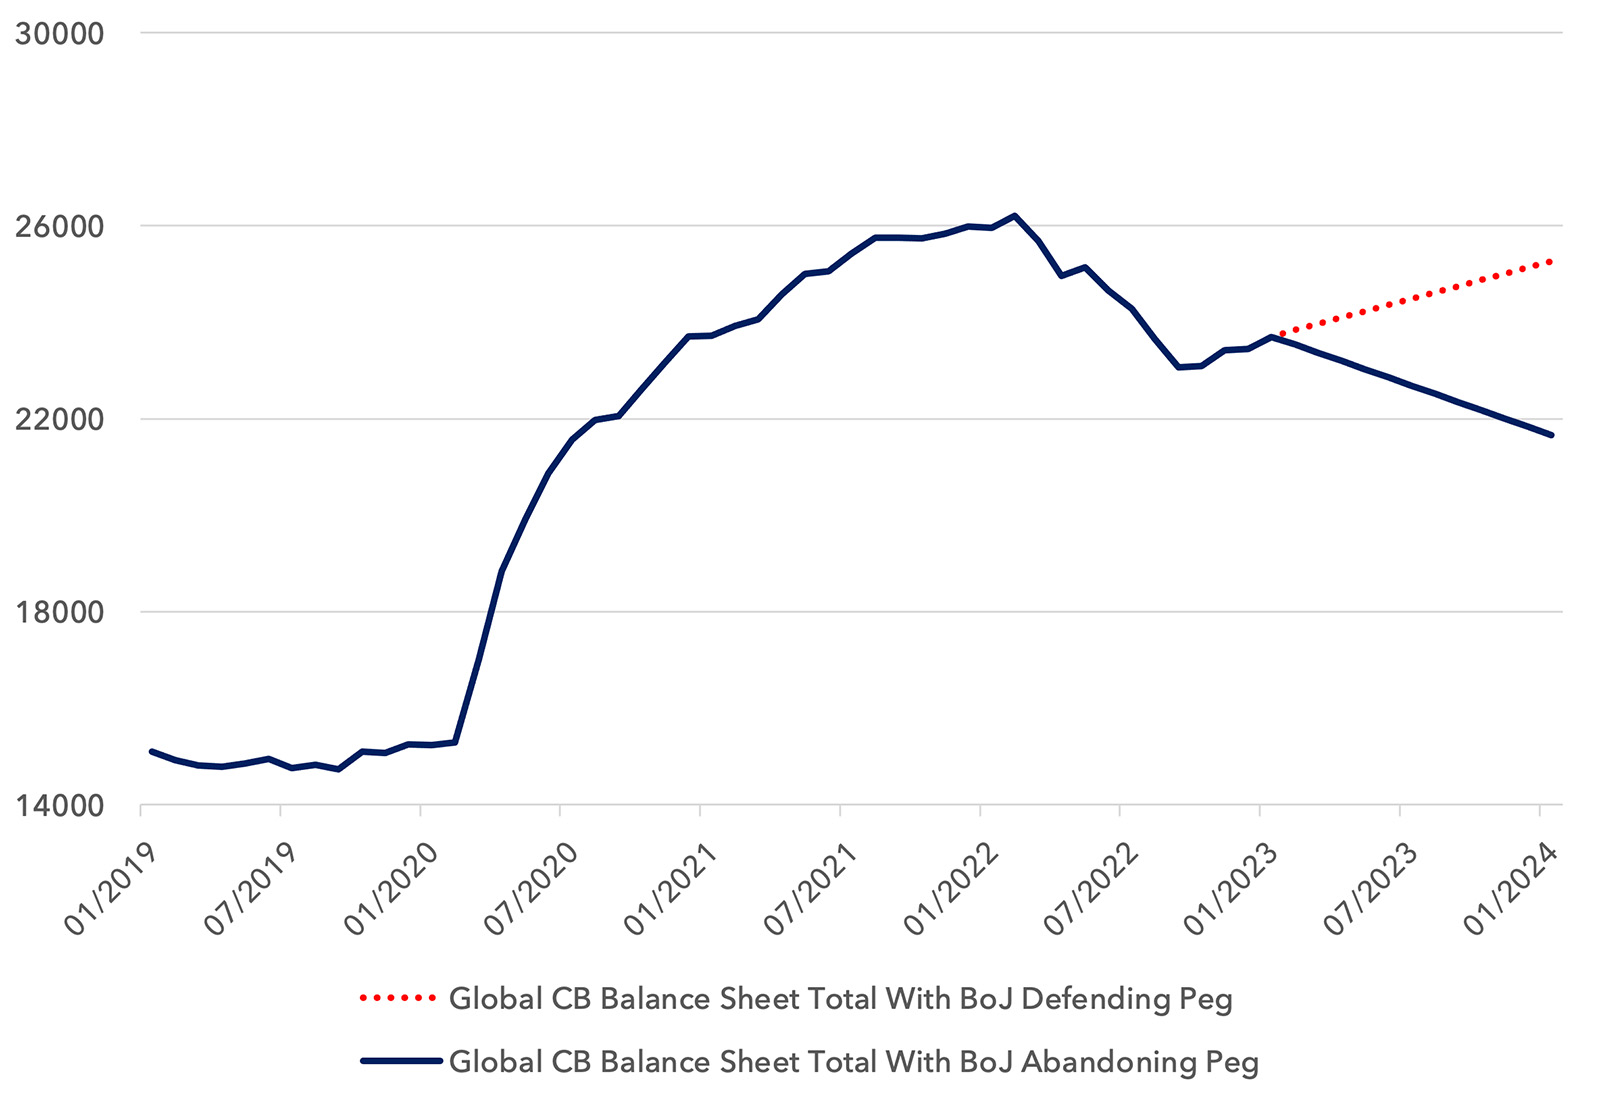
How to think about scenarios and what this might mean for markets? In the chart below we remove the PBoC from the data and aggregate the dollar balance sheets of the Fed, ECB, BoE and BoJ. We show what has actually happened from 2019 to today, and then make a forecast. We incorporate the central scenarios laid out by the Fed, ECB and BoE for their balance sheet run-off plans for 2023. In the case of the BoJ we have two scenarios: the first with their continued yield peg defence, the second with an abandonment of the peg. In the former we assume this requires them to print $250bn per month, slightly below recent months. In the latter we assume a gentle run down of their balance sheet, in line with their actions for most of 2022 before the yield peg defence was called into action. We hold exchange rates fixed in the forecast.
In the former example with Japan trying to hold the peg, global liquidity increases by $2 trillion this year. If they abandon the peg, liquidity decreases by the same amount. Clearly this is not on the same scale as the $10 trillion post-Covid explosion of liquidity from February 2020 to February 2021, but it is in line with the following year’s expansion from February 2021 to February 2022. The entire market capitalisation of MSCI World is $54 trillion, and so $2 trillion annualised is meaningful for markets.
Aggregate Central Bank Balance Sheet Size $bn: Fed+ECB+BOE+BoJ. 2019 – 2023 with scenarios to 2024 with fixed fx
This expansion in liquidity is appearing to have an impact on markets and risk appetite. We have seen a sharp increase in retail participation in equities in recent weeks. Many non-profitable companies have rallied sharply year-to-date, even with bond yields remaining elevated.
Certainly we have had some good news in recent months. We wrote a note at the start of October making the case for an equity market rally. Sentiment and fund flows were apocalyptic in Europe and some catalysts were imminent. The list of positive developments is long: Europe has weathered the energy crisis this winter, economic growth has been more resilient, China is reopening, inflation has eased and the Fed is indicating a potential pause in hikes. The Lightman Funds are up approximately 27% in Sterling terms since October with the index up over 20%. But there is a febrile element in markets in early 2023 that has not fully chimed with fundamentals. Markets are gaining extra propulsion from this liquidity but it is not clear if this liquidity will persist.
Haruhiko Kuroda, the Governor of the Bank of Japan, retires on April 8th. In the coming week the Japanese government will present their nominee for his replacement to parliament. Regardless of who replaces Kuroda, it is likely that we will see a policy change at some point. JGB purchases in the last two months represent over 7% of Japanese GDP. The BoJ now owns well over half of JGBs in issuance and two-thirds of bonds with a maturity between 1 and 11 years. The current policy is getting out of hand, but there are also risks to abandoning the peg.
Japan is the largest net creditor to the world, owning approximately $2.5 trillion of foreign long-term debt. They own $1.2 trillion of US debt, $700bn of European debt and $120bn of UK debt. The cost to Japanese institutions of hedging the foreign exchange risk of these foreign debt holdings has surged, such that there is now significant negative carry. This is incentivising the Japanese to sell foreign debt. If the yield peg is abandoned and JGBs reach a fair market price, the incentive to sell foreign bonds will become even stronger. There is also the question of paper losses for the BoJ, which could be large. And so there are incentives to maintain the current policy, even though the policy is reaching its limits.
But the most important reason to abandon the peg – and the fundamental reason for its inception in the first place – is the level of inflation. Japanese inflation is now 4%, the highest since 1990. In the short term there is a large focus on the “Shunto” wage talks that are ongoing. This is where management of large Japanese companies meet with unions to discuss wage increases for the coming fiscal year. If we see higher wage inflation announced, the argument for the yield cap will disappear.
The conclusion to the question in the title of this note is: as of now, thanks to the Bank of Japan, central banks are helping to push up equities, from an aggregate liquidity point of view. But this might change.
The movement in the dollar is also significant for liquidity. The US economy is showing resilience and on some measures may be accelerating. If we see a bout of dollar strength, particularly after the dust settles from a BoJ pivot, this could further tighten global liquidity conditions.
This sets up a tricky landscape for the equity market in the short term. Conditions are improving versus expectations in many economies and so earnings may prove resilient for the time being. China is re-opening and stimulating their economy and this will help to lift global growth. This may add fuel to inflation later this year or may not, but the evidence is not yet in place for this to act as a handbrake for valuations. This is a tentatively bullish setup, not least with institutional investors still a little cautious. But the BoJ could change tack and it could cause some turmoil.
We are sticking to our core portfolio structure. We focus on companies with high free cash flow yields, low valuations and strong balance sheets that can pay dividends and support buy-backs. We know that in an ultra-aggressive risk-on environment, outperforming the index may be difficult. We are aiming to participate in the upside but provide defensiveness in the event of a sell-off. The portfolio valuation has a median PE ratio of 9.3 in 2023 and 9.0 in 2024. The dividend yield is forecast to be 4.7% in 2023 and 5.0% in 2024. We believe we can continue to provide positive absolute and relative returns in 2023, irrespective of the index outcome.
Sources:
The IMF, Liberty Street Economics at the Federal Reserve Bank of New York, Howard Mason, Renmac, The Federal Reserve, the Bank of Japan, the European Central Bank, the People’s Bank of China, the Bank of England, Bloomberg, Lightman Investment Management.
Legal
Disclaimer
This communication and its content are owned by Lightman Investment Management Limited (“Lightman”, “we”, “us”). Lightman Investment Management Limited (FRN: 827120) is authorised and regulated by the Financial Conduct Authority (“FCA”) as a UK MiFID portfolio manager eligible to deal with professional clients and eligible counterparties in the UK. Lightman is registered with Companies House in England and Wales under the registration number 11647387, having its registered office at c/o Buzzacott LLP, 130 Wood Street, London, United Kingdom, EC2V 6DL.
Target audience
This communication is intended for ‘Eligible Counterparties’ and ‘Professional’ clients only, as described under the UK Financial Services and Markets Act 2000 (“FSMA”) (and any amendments to it). It is not intended for ‘Retail’ clients and Lightman does not have permission to provide investment services to retail clients. Generally, marketing communications are only intended for ‘Eligible Counterparties’ and ‘Professional’ clients in the UK, unless they are being used for purposes other than marketing, such as regulations and compliance etc. The Firm may produce marketing or communication documents for selected investor types in non UK jurisdictions. Such documents would clearly state the target audience and target jurisdiction.
Collective Investment Scheme(s)
The collective investment scheme(s) – WS Lightman Investment Funds (PRN: 838695) (“UK OEIC”, “UK umbrella”), and WS Lightman European Fund (PRN: 838696) (“UK sub-fund”, “UK product”) are regulated collective scheme(s), authorised and regulated by the FCA. In accordance with Section 238 of FSMA, such schemes can be marketed to the UK general public. Lightman, however, does not intend to receive subscription or redemption orders from retail clients and accordingly such retail clients should either contact their investment adviser or the Management Company Waystone Management (UK) Limited (“Waystone UK”) in relation to any fund documents.
The collective investment scheme(s) - Elevation Fund SICAV (Code: O00012482) (“Luxembourg SICAV”, “Luxembourg umbrella”), and Lightman European Equities Fund (Code: O00012482_00000002) (“Luxembourg sub-fund”, “Lux product”) are regulated undertakings for collective investments in transferrable securities (UCITS), authorised and regulated by the Commission de Surveillance du Secteur Financier (CSSF) in Luxembourg. In accordance with regulatory approvals obtained under the requirements of the Law of 17 December 2010 relating to undertakings for collective investment, the schemes can be marketed to the public in Luxembourg, Norway, Spain, and Republic of Ireland. Lightman, however, does not intend to receive subscription or redemption orders from any client types for the Lux product and accordingly such client should either contact a domestic distributor, domestic investment advisor or the Management Company Link Fund Solutions (Luxembourg) S.A. (“Link Luxembourg”) in relation to any fund documents.
Luxembourg umbrella and Luxembourg sub-fund are also approved for marketing to professional clients and eligible counterparties in the UK under the UK National Private Placement Regime (NPPR). UK registration numbers for the funds are as follows: Elevation Fund SICAV (PRN: 957838) and Lightman European Equities Fund (PRN: 957839). Please write to us at compliance@lightmanfunds.com for proof of UK registration of the funds.
Luxembourg sub-fund is also approved for marketing to qualified investors in Switzerland, within the meaning of Art. 10 para. 3 and 3ter CISA. In Switzerland, the representative is Acolin Fund Services AG, Leutschenbachstrasse 50, 8050 Zurich, Switzerland, whilst the paying agent is NPB Neue Privat Bank AG, Limmatquai 1 / am Bellevue, 8024 Zurich, Switzerland.
Accuracy and correctness of information
Lightman takes all reasonable steps to ensure the accuracy and completeness of its communications; we however request all recipients to contact us directly for the latest information and documents as issued documents may not be fully updated. We cannot accept any liability arising from loss or damage from the use of this communication.
Wherever our communications refer to a third party such as Waystone, Link, Northern Trust etc., we cannot accept any responsibility for the availability of their services or the accuracy and correctness of their content. We urge users to contact the third party for any query related to their services.
Important information for non-UK persons (Including US persons)
This communication is not intended for any person outside of the UK, Switzerland, or the European Economic Area (EEA). Lightman or any of the funds referenced in this communication are not approved for marketing outside of the UK, Switzerland, or the EEA. All such persons must consult their domestic lawyers in relation to services or products offered by Lightman.
Risk warning to all investors
The value of investments in any financial assets may fall as well as rise. Investors may not get back the amount they originally invested. Past performance is not an indicator of future performance. Potential investors should not use this communication as the basis of an investment decision. Decisions to invest in any fund should be taken only on the basis of information available in the latest fund documents. Potential investors should carefully consider the risks described in those documents and, if required, consult a financial adviser before deciding to invest.
Offer, advice, or recommendation
No information in this communication is intended to act as an offer, investment advice or recommendation to buy or sell a product or to engage in investment services or activities. You must consult your investment adviser or a lawyer before engaging in any investment service or product.
GDPR
Lightman may process personal information of persons using this communication. Please read our privacy policy.
Copyright
This communication cannot be distributed or reproduced without our consent.