
- Investors are preoccupied with European political risk, but we see greater risks in the US equity market
- US equity underperformance may finally be imminent
- Upcoming changes to Bank of Japan policy may have a large impact on global markets
- We have moved to a more defensive footing, with the Consumer Staples weighting up and Energy down
European politics
Emmanuel Macron has surprised investors and called a general election. These are legislative elections and are not for the Presidency. Macron’s term expires in 2027.
It appears that Macron aims to bring the far right into government and force it to be exposed to the realities of the world. Assuming it fails to live up to expectations in government, this ought to reduce support ahead of the Presidential elections in 2027.
The Rassemblement National party (RN) under Marine Le Pen and Jordan Bardella performed well in European elections with 31.4% of the vote. If it becomes the largest party after the legislative elections, France could see Jordan Bardella become Prime Minister.
The RN no longer wants to leave the European Union, but it wants to make significant changes to how Europe works, particularly on immigration.
European bond spreads have risen, led by France and Belgium. Spanish and Italian spreads have also risen.
We see the risk of bond spreads rising more over the medium term, but we view this as driven by the fiscal position of certain governments rather than the risks around European Union membership. France has a large deficit. Macron has attempted to address it but has not succeeded and these elections may make the necessary reforms less likely to occur. This remains a latent risk for Belgium, Spain and Italy.
Europe outperforming the US?
We do not view European political risk as a sustainable driver of underperformance for European equities over the US. The US fiscal position is worse than Europe’s, with even larger deficits, and therefore any fiscally driven widening of spreads in Europe should also be a headwind for the US. In the US this can be monitored more clearly via the term premium, which we expect to rise.
US valuations are much higher than in Europe and we see this as most relevant for future returns. When looking at price to sales and price to book, European value and European growth are half the price of their US equivalents.
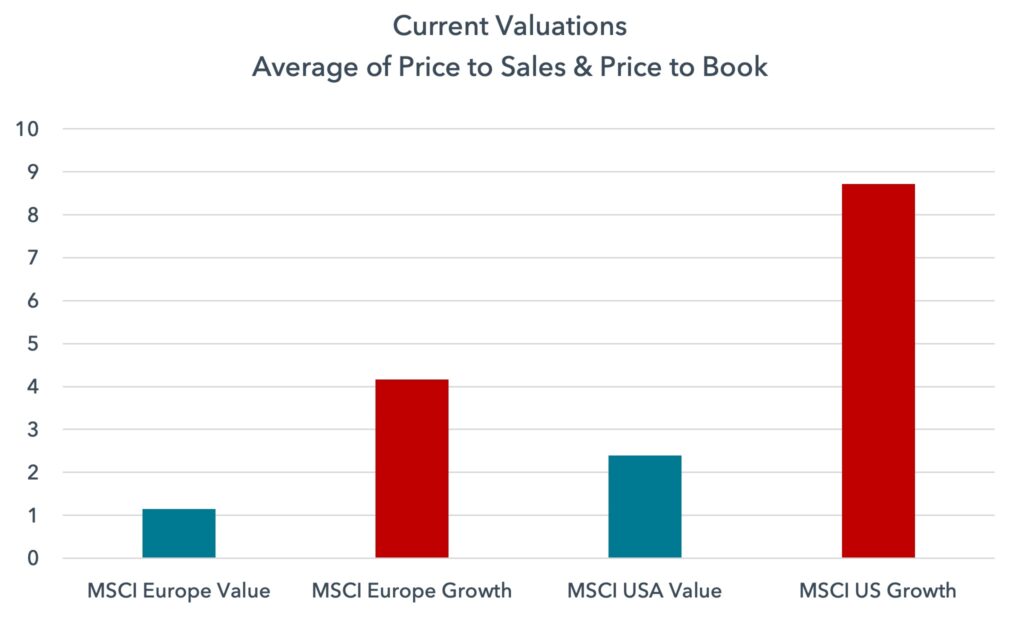
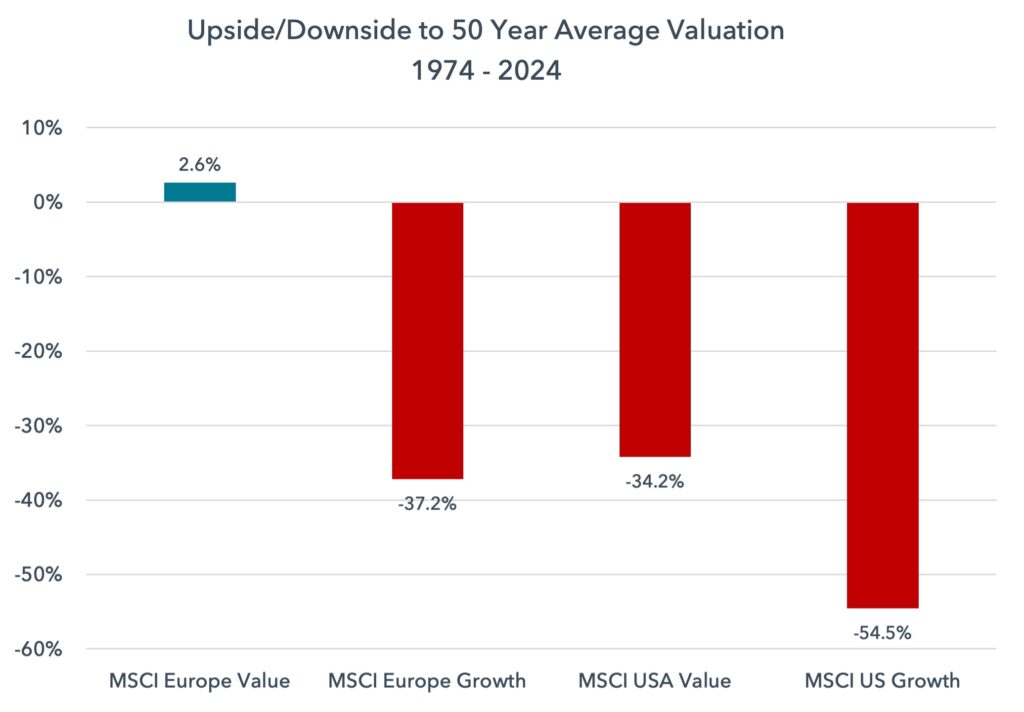
Importantly, European value remains cheap relative to its 50 year average valuation. After a decade of quantitative easing and ultra-low interest rates, it is rare to find genuinely cheap assets. This valuation support ought to provide resilience in a correction led by US equities.
The problem of timing
European equities have been cheap relative to the US for some time and yet US equities have outperformed for much of the last decade. Why might the US underperform now?
The major driver of US outperformance has been technology. If the US is to underperform, so must technology.
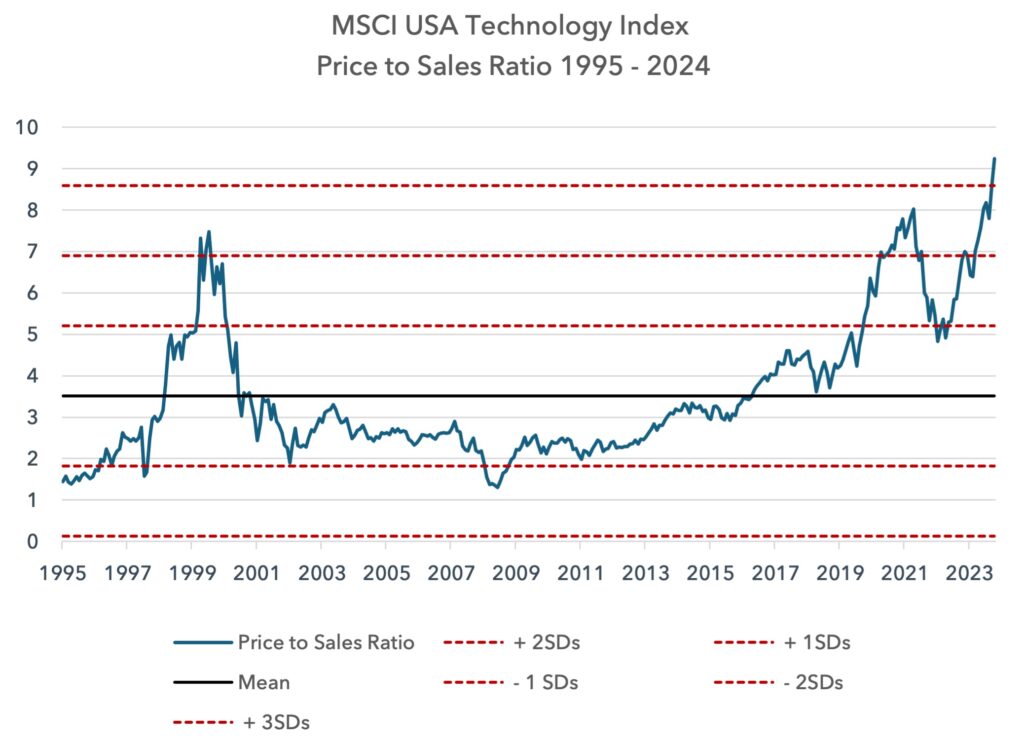
We have already written about expensive technology valuations recently. Below we update the latest technology price to sales valuation chart. On this metric US technology valuations are now at +3.4 standard deviations from their 30 year average and are well above the dotcom peak.
In the section below we want to focus on the leader within technology, Nvidia. Whilst we are European investors, Nvidia represents the apex of growth equity investing and so we follow its developments.
A peak for Nvidia?
We all know Nvidia is the tip of the spear for Artificial Intelligence.
We believe there is quite a high probability that Nvidia has a deep correction, which could have large implications for technology and growth investing globally.
We do not see an acceptable return on investment for AI capabilities today that justifies the planned capex spend, so we expect capex to slow and begin to miss expectations. We believe Meta’s sell-off on 24 April was the first signal that return on AI investment is beginning to come, albeit slowly, into investor focus. We also see higher competition, not least from Nvidia’s largest customers, threatening its future market share.
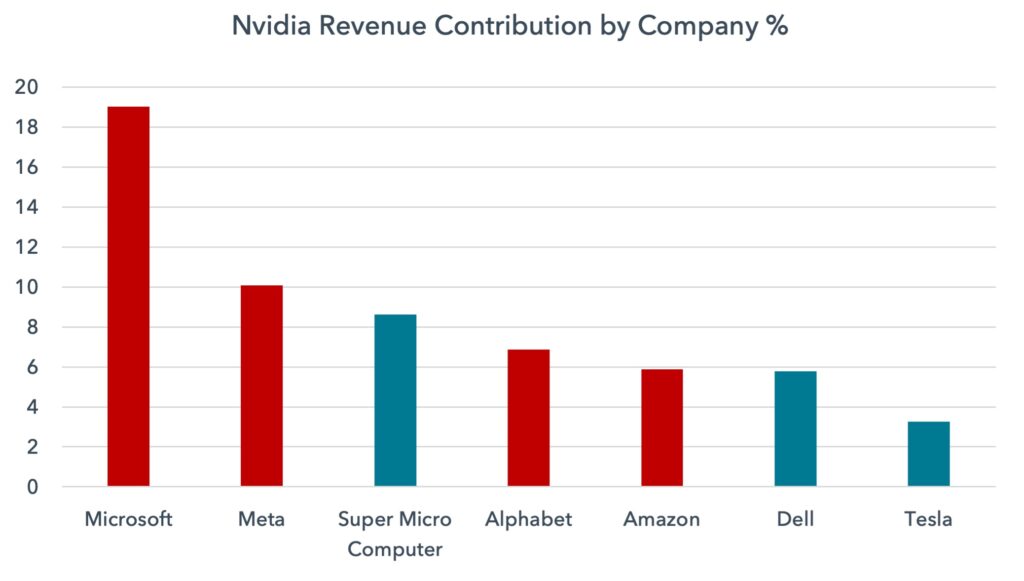
The market’s confidence in the valuation of Nvidia appears excessive given the risks. Its customers are incredibly concentrated. Usually, high customer concentration merits a discount in company valuations. This appears especially relevant in this case since many of Nvidia’s customers are attempting to build their own graphics processing units (GPUs), which may result in lower dependence on Nvidia over time.
Below we show Nvidia’s key customers. 30% of the company’s revenue comes from two customers and 60% from seven. In red are those companies that are also developing their own GPUs. Approximately 40% of revenue comes from customers that are attempting to build competitor products of their own.
Nvidia vs Cisco
Below we show Nvidia’s valuation versus Cisco in price to sales terms. Cisco is often cited as one of the most extreme examples of excess in the dotcom bubble, because it is so rare to get an extremely high valuation in a megacap stock. Nvidia recently hit the exact valuation peak that Cisco did in March 2000, and Nvidia is even larger as a share of the equity market, at 7% of the S&P 500 today compared to Cisco’s peak of 4.1% in March 2000.
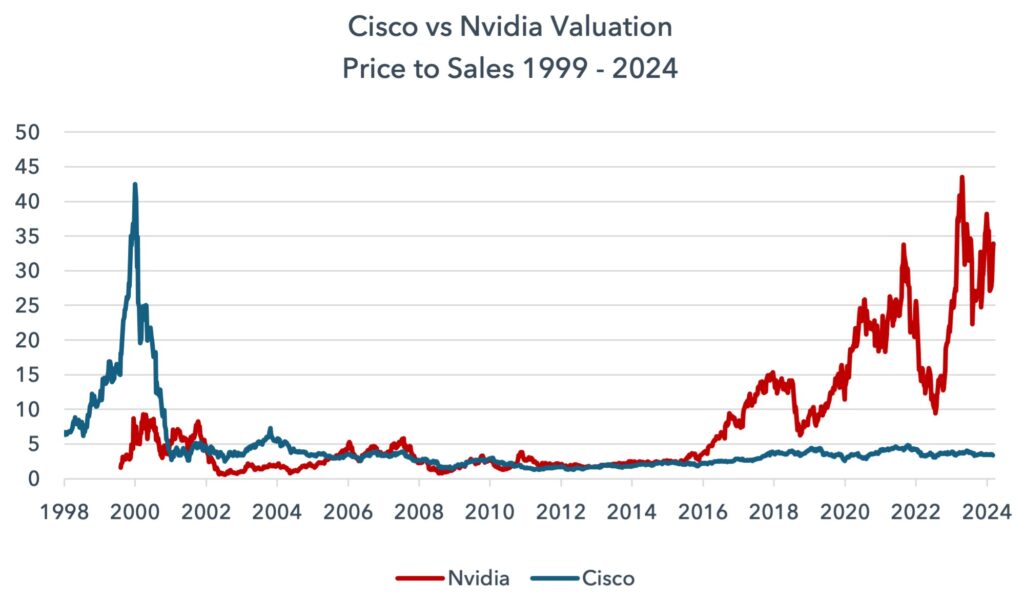
In the last four weeks Nvidia’s market cap has increased by the same as the $880bn total valuation of Berkshire Hathaway. Warren Buffet’s life’s work – 60 years of near faultless value creation – was eclipsed in 20 trading days. Since reporting earnings on 22 May – 16 trading days – Nvidia has rallied by more than the entire market cap of Spain and Italy combined.
We view AI as a fully inflated bubble, but as we know, it is difficult to assess the exact timing of the peak.
Sentiment can be helpful with timing. Today there are 71 analysts covering Nvidia and there is no sell rating – there are 64 buys and 7 holds. Nvidia is also the largest weighting in day trading portfolios, averaging 10%, double the size of any other position according to Vanda research. When allied with some of the call option data which we discuss below, we wonder who the marginal buyers of this stock are.
Can Tesla teach us something about Nvidia?
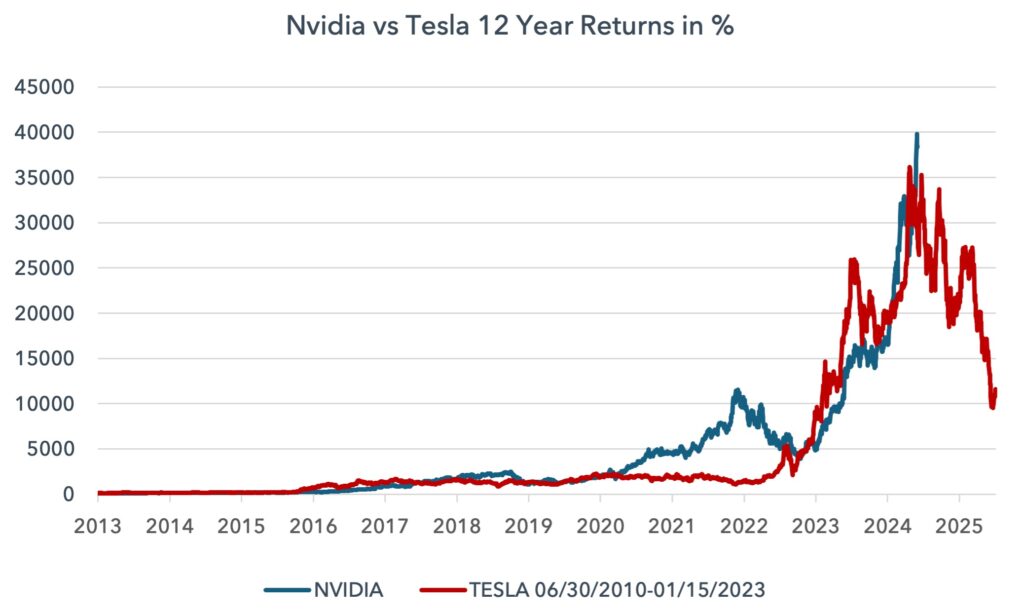
We can look to history to try to put Nvidia’s bubble in context. There are uncanny similarities between Nvidia today and Tesla at its peak in late 2021.
Whilst this is nothing more than coincidence, it is interesting that in the 12 years leading up to Tesla’s peak in late 2021 and Nvidia’s current peak both stocks rallied approximately 35,000%.
In the chart below we move Tesla’s performance forward by 3 years to match the current date range of Nvidia and normalise both with a starting price of 100.
There is no evidence to suggest Nvidia will follow Tesla’s path, but bubbles often have similarities to each other and so we believe this chart can provide some perspective.
Call option volumes suggest mania
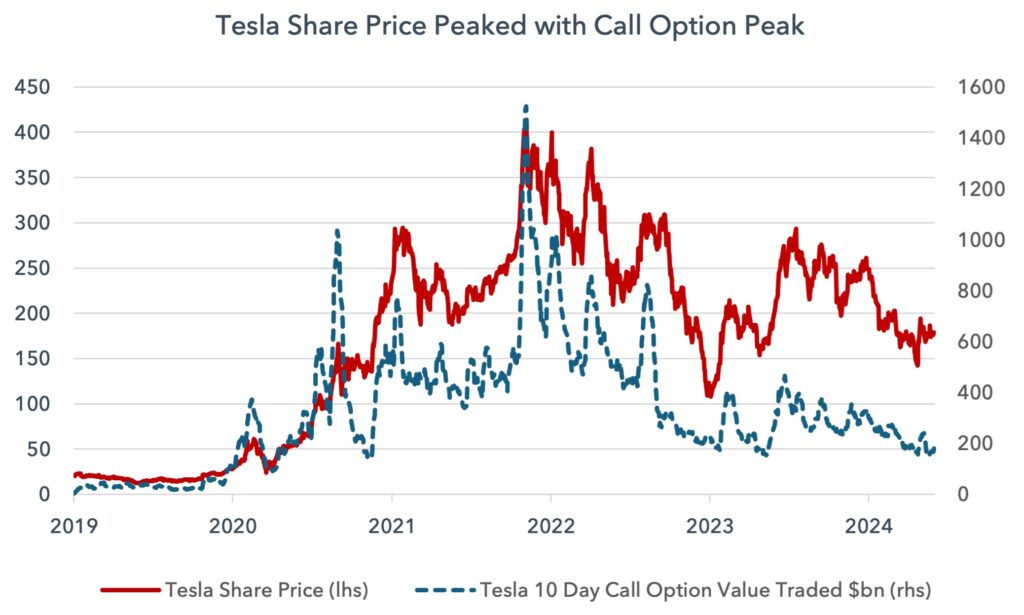
One element that defined Tesla’s peak was enormous call option activity. Once more we can see interesting similarities between the two companies.
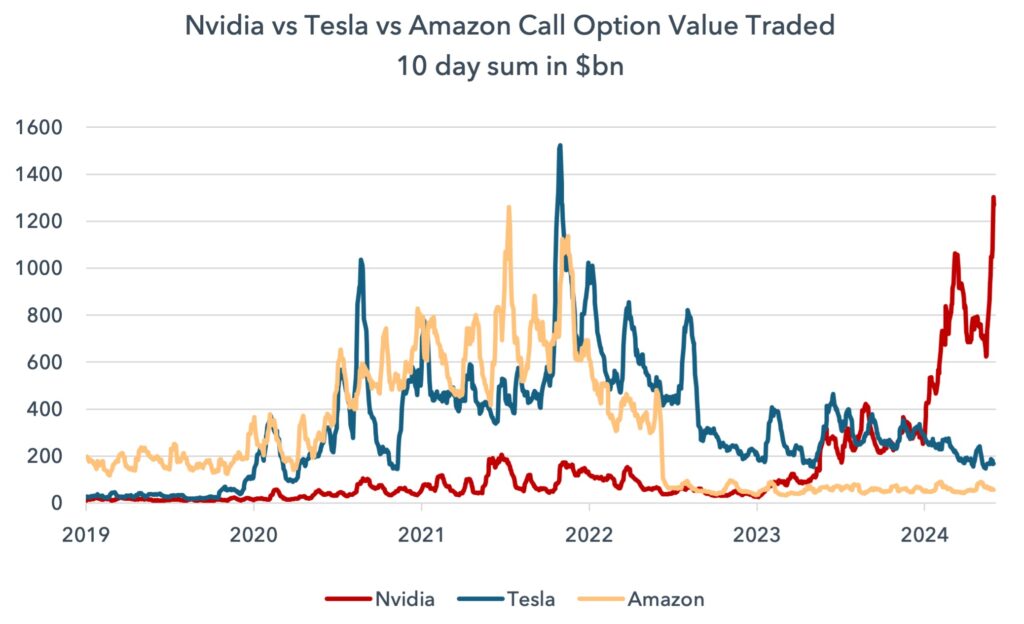
Nvidia has had staggering call option activity recently. Over $1.3tn in call options was traded in a 10-day period from 23 May to 6 June. Call options also hit $1tn in March this year. Only two other companies have seen this level of call option activity in stock market history and in both cases it was the prelude to a significant price decline.
Tesla is the record holder. It had two moments of ultra-high call option volumes. The first was in late August 2020, with $1tn value traded. The share price then fell 33% – but this was not the all-time high. The second was November 2021, perfectly coincident with its all-time high, when Tesla saw $1.5tn of call options traded over a 10 day period. The share price then fell 70% over the following 14 months.
Amazon is the only other company to have hit the $1tn mark over a 10 day period. In July and November 2021 it saw $1.2tn and $1.1tn of call options traded. Amazon’s share price traded in a range from July to November before falling 55% in the following 18 months.
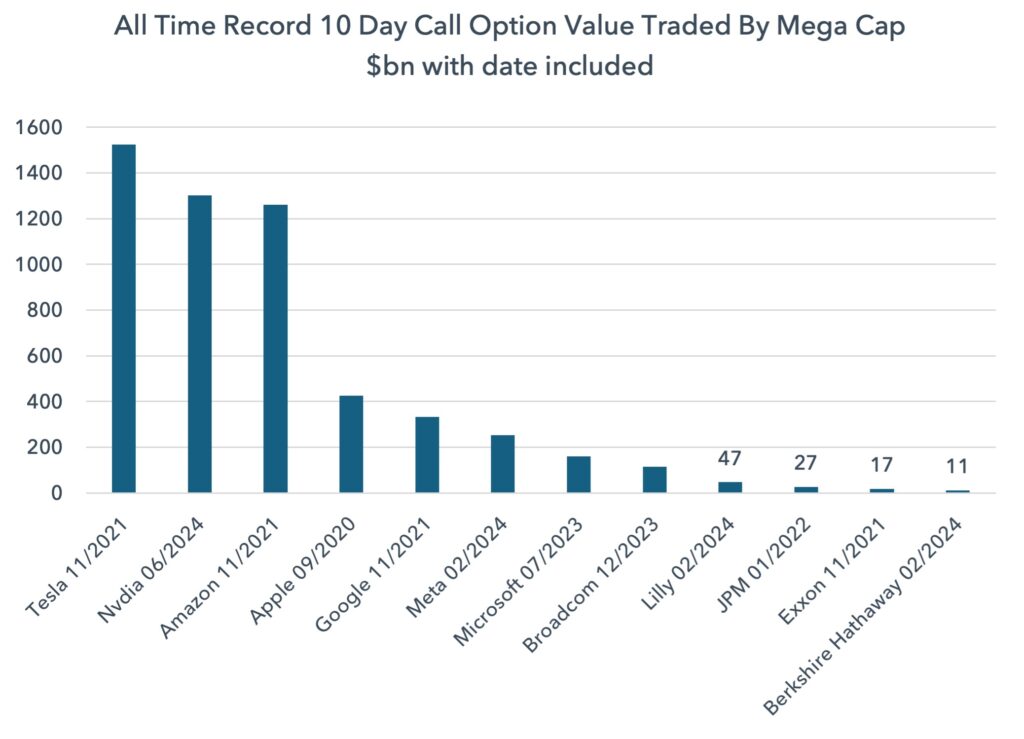
The top seven rankings for call option value traded are all held by the Magnificent 7. We show these below and include other mega caps Lilly, JPM, Exxon and Berkshire Hathaway for some perspective.
Below we show Tesla’s share price versus 10 day call option value traded.
In Nvidia’s case it is possible that there is another frenzy with even higher call option volumes. The stock split that took place on 10 June could facilitate higher option volumes, but this ought not to be the base case.
Nvidia continues to ramp expectations higher, making bolder forecasts, even after earnings. The company has made a flurry of recent announcements, with its latest GPU announced just three months after its last, which itself has not started shipping. They have also lifted the cadence of new product launches from once every two years to once per year, which will put further financial pressure on their key customers.
Time will tell whether we are close to the peak for Nvidia, but as a symbol for the AI bubble, technology and growth investing, a break in Nvidia’s share price momentum will likely end US equity market outperformance. In this case, Europe’s lower exposure to technology ought to act as a tailwind for relative performance.
A correction in Nvidia and AI stocks need not be a threat to investor portfolios. Investors with a value bias and a strong diversification outside the US can limit the risks associated with the bursting of the AI bubble.
Japan’s role in markets for the remainder of 2024
We believe Japan may act as an important driver of global markets in the coming months. Yen weakness is persisting and becoming a domestic political issue. This may force a policy change from the Bank of Japan (BoJ) that could impact global markets.
Unlike all other central banks, the BoJ is still engaging in modest amounts of quantitative easing. Given this expansion in its balance sheet relative to the rest of the world, it is not surprising that the yen keeps weakening.
The BoJ has two options in its own hands to stop yen weakness: either start quantitative tightening or raise interest rates. This matters for global markets because this policy change may act to catalyse a repatriation of Japanese capital from abroad.
On 14 June the BoJ stated its intention to reduce the scale of its bond purchases, but did not disclose what it had in mind. We have to wait for its July meeting to find out what this will mean.
Why a change in Japan’s position in foreign debt markets is important
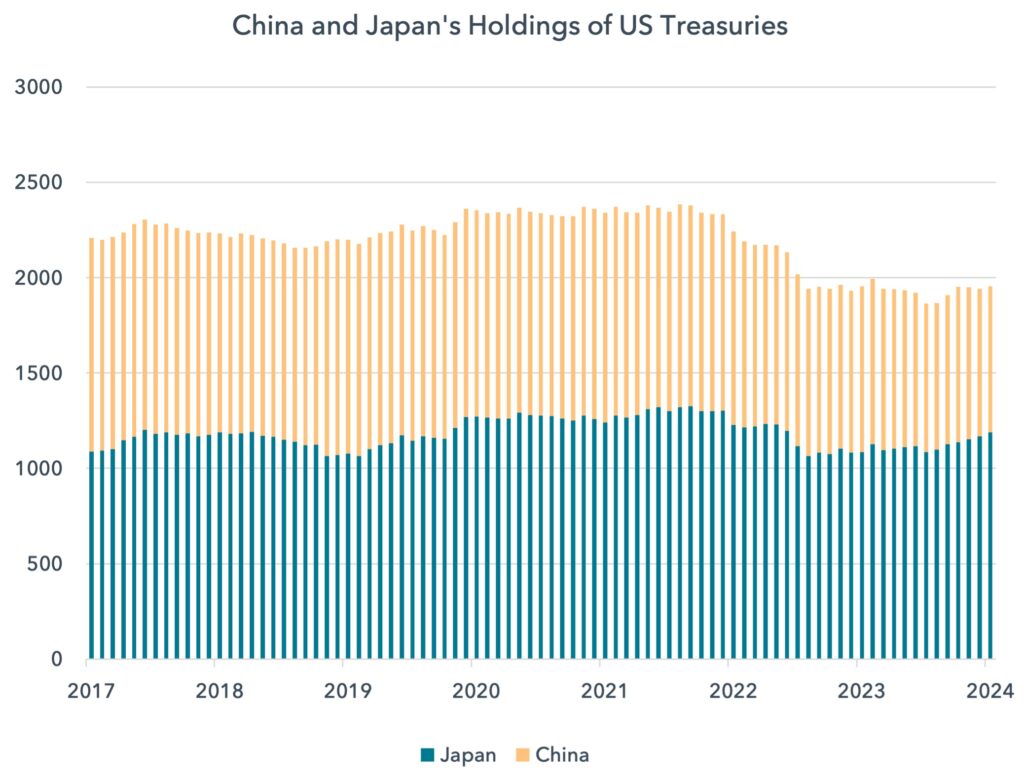
Japan is the largest single owner of Treasuries, with a $1.2tn position. It also holds large positions in UK and European debt markets.
Unlike China, which has been relentlessly selling since the Russian invasion of Ukraine, Japan has held its Treasury holdings relatively stable. Japanese institutions did appear to reduce exposure in 2022 but bought some of those positions back in 2023.
Over the past 12 months Japan increased its position in Treasuries by $100bn, perfectly offsetting Chinese selling of the same amount. But as we will discuss below, the risk of Japanese selling is rising.
The importance of the Japanese 10 year yield
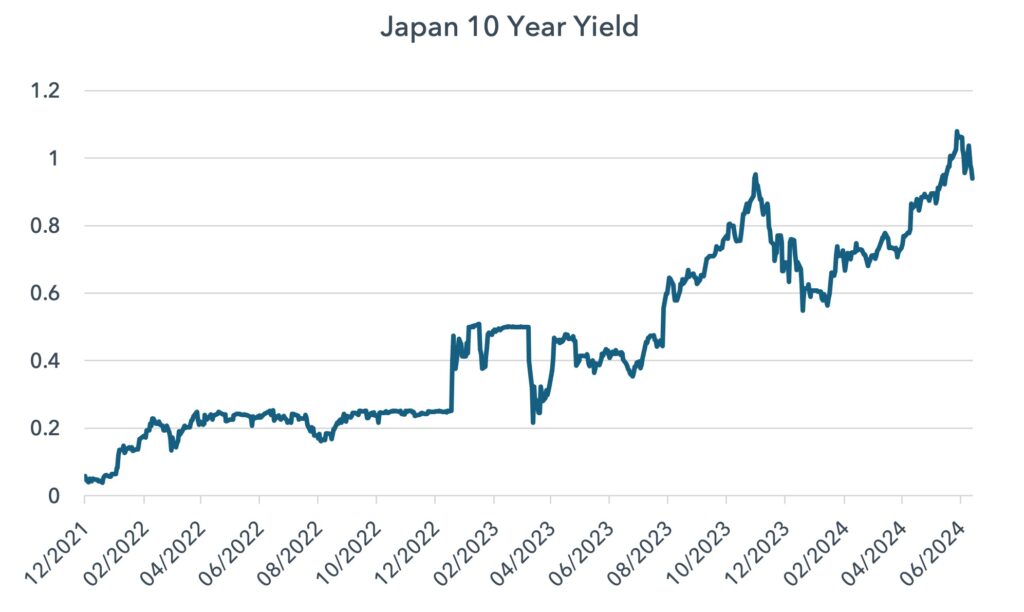
In addition to the yen, the Japanese 10 year yield is a key security to focus on for global markets. From 2016 to 2022 Japan adopted strict yield curve control whereby it capped the upside on the 10 year yield. This policy was watered down in 2022 but its 10 year remains peculiarly low relative to the long end of the Japanese yield curve. Japanese 30 year bonds yield 2.1% yet the 10 year yields just under 1%. Normally, as we show below, the 10 year has a closer relationship in absolute yield to the 30 year.
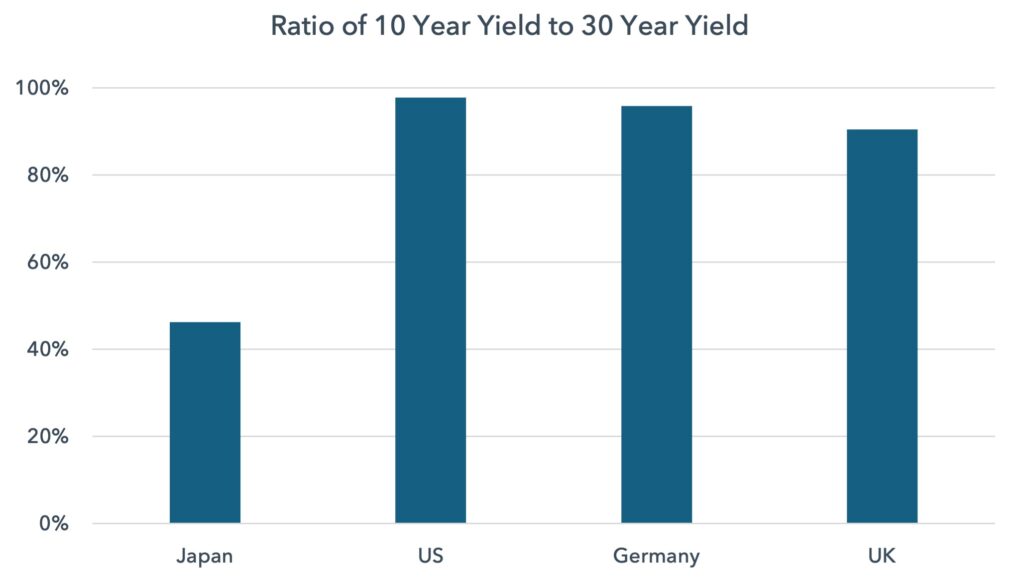
Whilst this relationship can persist, it suggests sharper upward spikes in the Japanese 10 year yield are possible. We have already seen a large move higher over the last year.
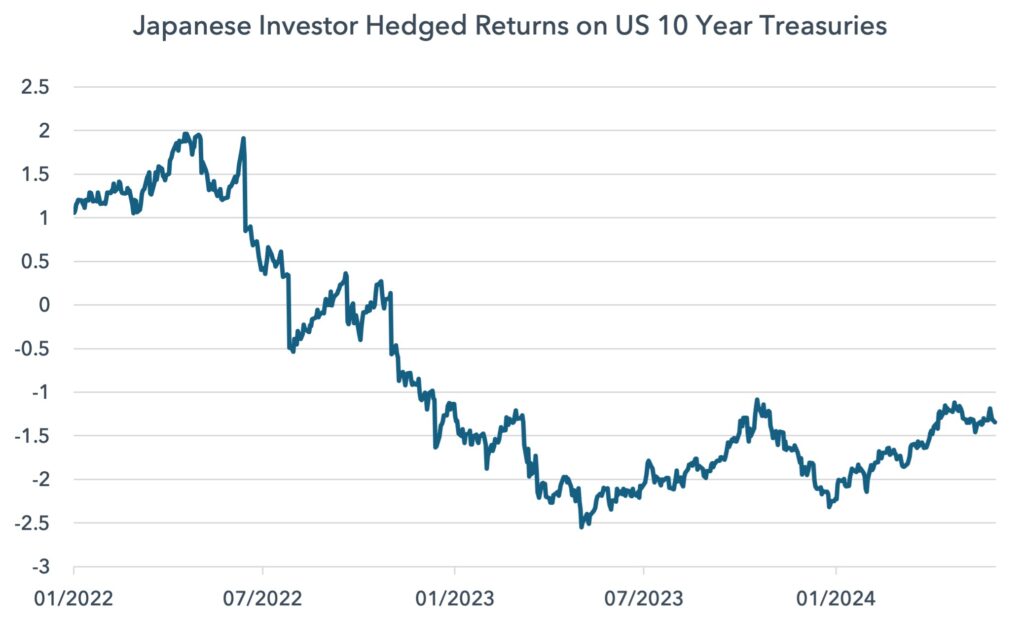
Why is this relevant for global markets?
Japanese financial institutions are already losing money on a hedged basis in their Treasury holdings. This has been the case for the last 18 months. These losses are tolerable when the opportunity cost is low. But as Japanese yields move up, the opportunity cost rises. Many Japanese institutions cite 1% as a key level where Japanese bonds become more attractive for domestic institutions. We reached that level last month and so we must be prepared for the beginning of a repatriation of Japanese money from the US and abroad.
Recent Japan Ministry of Finance data showed the largest selling volume of foreign debt in nine years during the week ending 7 June. Net sales were ¥2.65tn ($17bn). This might be a one-off and may not mark a trend, but it bears watching.
Japan is an important supporter of global sovereign bond markets, in particular the US Treasury market. If we see bigger flows start to return to Japan it will put upward pressure on the US term premium and could act to lift yields. This could act to compress the valuations of assets, with the most expensive assets more vulnerable.
Once more, this need not be a threat to investor portfolios; value equities ought to be relatively immune from a rising term premium.
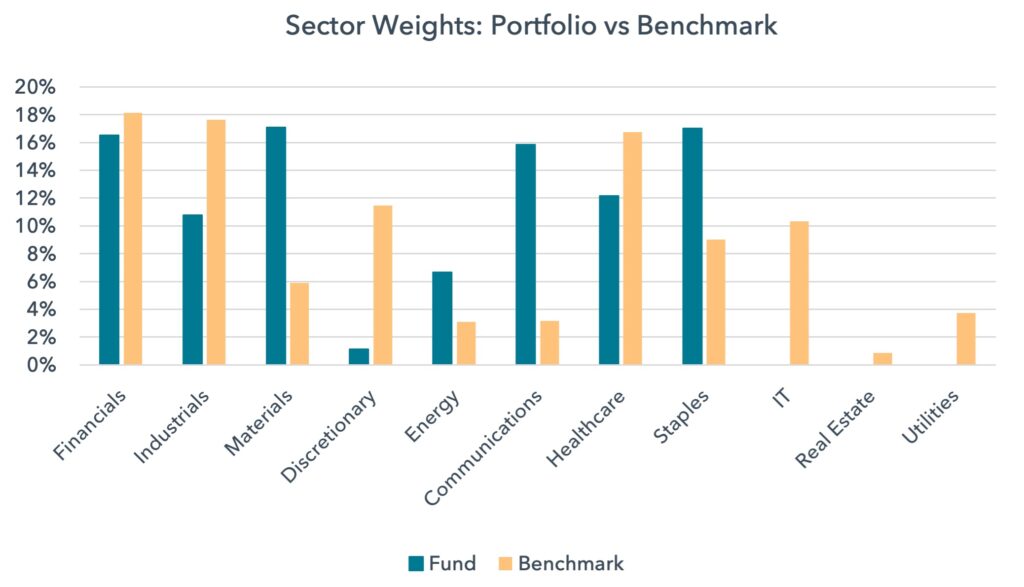
Portfolio Update: Consumer Staples weighting up, Energy down
The portfolio has increased its position in Consumer Staples and reduced exposure to Energy. We have also added to Healthcare. The current sector split is shown below.
These changes have not shifted the overall portfolio valuation much when accounting for the recent rise in markets. The portfolio’s median PE is 12.7x in 2024 and 10.9x in 2025. The weighted expected dividend yield is 4.6% in 2024 and 5.0% in 2025. The median portfolio price to sales ratio is 1.3x and price to book is 1.6x.
The Energy exposure is now marginally overweight, having been a large overweight earlier in the year. We have trimmed Galp after its large oil discovery this year, cut back Shell and sold the last of our Equinor.
Oil equities are still cheap and constitute good value, but the outlook for earnings is a little unclear in the short term. We are unsure about the direction of the oil price for the remainder of the year. A possible slowdown in the US may become evident in the coming months, and this may weaken oil demand. OPEC discipline is beginning to fray. The outlook for refining margins is also unclear. The combination of these elements has changed the risk reward for us and merits a smaller overweight.
More importantly, we have found some new ideas in Consumer Staples. Staples have had a difficult two years, with sizeable underperformance leading to some companies hitting valuation levels that are now low enough for us. We started a small position in Danone late last year and have added to it in recent months. We have also built a new position in Unilever and have added to Ahold Delhaize and Carrefour.
We have maintained our weighting in Materials, which is focussed on mining companies. We see China’s resource intensity rising this year despite the continued softness in housing. Grid and renewable energy investment is so large that it is fully offsetting softer private sector housing demand for copper and other base metals.
The rest of the portfolio is more or less unchanged. We remain neutral in Banks and have focussed our exposure to those banks that are well capitalised, have strong lending standards and operate in countries with the strongest sovereign credit ratings. Our banks have outperformed in this recent widening of sovereign bond spreads.
We are keen to make sure the portfolio is resilient in a more difficult market or macroeconomic scenario. The liquidity backdrop peaked in late February and is becoming more neutral, in line with our notes from late last year and earlier this year. This ought to be a source of support for the relative performance of the portfolio and of value.
Over the last three months, the portfolio has started to slowly outperform. Our aim is to participate as markets rise but also provide downside protection in the event of a deeper sell-off.
Despite seeing downside for some companies in the index, we continue to see upside for the portfolio for the remainder of 2024.
Sources:
Kepler Cheuvreux, Japan Ministry of Finance, Bank of Japan, David Threadgold, KBW, Treasury International Capital (TIC) System, US Department of the Treasury, MSCI, Bloomberg, Lightman Investment Management
Legal
Disclaimer
This communication and its content are owned by Lightman Investment Management Limited (“Lightman”, “we”, “us”). Lightman Investment Management Limited (FRN: 827120) is authorised and regulated by the Financial Conduct Authority (“FCA”) as a UK MiFID portfolio manager eligible to deal with professional clients and eligible counterparties in the UK. Lightman is registered with Companies House in England and Wales under the registration number 11647387, having its registered office at c/o Buzzacott LLP, 130 Wood Street, London, United Kingdom, EC2V 6DL.
Target audience
This communication is intended for ‘Eligible Counterparties’ and ‘Professional’ clients only, as described under the UK Financial Services and Markets Act 2000 (“FSMA”) (and any amendments to it). It is not intended for ‘Retail’ clients and Lightman does not have permission to provide investment services to retail clients. Generally, marketing communications are only intended for ‘Eligible Counterparties’ and ‘Professional’ clients in the UK, unless they are being used for purposes other than marketing, such as regulations and compliance etc. The Firm may produce marketing or communication documents for selected investor types in non UK jurisdictions. Such documents would clearly state the target audience and target jurisdiction.
Collective Investment Scheme(s)
The collective investment scheme(s) – WS Lightman Investment Funds (PRN: 838695) (“UK OEIC”, “UK umbrella”), and WS Lightman European Fund (PRN: 838696) (“UK sub-fund”, “UK product”) are regulated collective scheme(s), authorised and regulated by the FCA. In accordance with Section 238 of FSMA, such schemes can be marketed to the UK general public. Lightman, however, does not intend to receive subscription or redemption orders from retail clients and accordingly such retail clients should either contact their investment adviser or the Management Company Waystone Management (UK) Limited (“Waystone UK”) in relation to any fund documents.
The collective investment scheme(s) - Elevation Fund SICAV (Code: O00012482) (“Luxembourg SICAV”, “Luxembourg umbrella”), and Lightman European Equities Fund (Code: O00012482_00000002) (“Luxembourg sub-fund”, “Lux product”) are regulated undertakings for collective investments in transferrable securities (UCITS), authorised and regulated by the Commission de Surveillance du Secteur Financier (CSSF) in Luxembourg. In accordance with regulatory approvals obtained under the requirements of the Law of 17 December 2010 relating to undertakings for collective investment, the schemes can be marketed to the public in Luxembourg, Norway, Spain, and Republic of Ireland. Lightman, however, does not intend to receive subscription or redemption orders from any client types for the Lux product and accordingly such client should either contact a domestic distributor, domestic investment advisor or the Management Company Link Fund Solutions (Luxembourg) S.A. (“Link Luxembourg”) in relation to any fund documents.
Luxembourg umbrella and Luxembourg sub-fund are also approved for marketing to professional clients and eligible counterparties in the UK under the UK National Private Placement Regime (NPPR). UK registration numbers for the funds are as follows: Elevation Fund SICAV (PRN: 957838) and Lightman European Equities Fund (PRN: 957839). Please write to us at compliance@lightmanfunds.com for proof of UK registration of the funds.
Luxembourg sub-fund is also approved for marketing to qualified investors in Switzerland, within the meaning of Art. 10 para. 3 and 3ter CISA. In Switzerland, the representative is Acolin Fund Services AG, Leutschenbachstrasse 50, 8050 Zurich, Switzerland, whilst the paying agent is NPB Neue Privat Bank AG, Limmatquai 1 / am Bellevue, 8024 Zurich, Switzerland.
Accuracy and correctness of information
Lightman takes all reasonable steps to ensure the accuracy and completeness of its communications; we however request all recipients to contact us directly for the latest information and documents as issued documents may not be fully updated. We cannot accept any liability arising from loss or damage from the use of this communication.
Wherever our communications refer to a third party such as Waystone, Link, Northern Trust etc., we cannot accept any responsibility for the availability of their services or the accuracy and correctness of their content. We urge users to contact the third party for any query related to their services.
Important information for non-UK persons (Including US persons)
This communication is not intended for any person outside of the UK, Switzerland, or the European Economic Area (EEA). Lightman or any of the funds referenced in this communication are not approved for marketing outside of the UK, Switzerland, or the EEA. All such persons must consult their domestic lawyers in relation to services or products offered by Lightman.
Risk warning to all investors
The value of investments in any financial assets may fall as well as rise. Investors may not get back the amount they originally invested. Past performance is not an indicator of future performance. Potential investors should not use this communication as the basis of an investment decision. Decisions to invest in any fund should be taken only on the basis of information available in the latest fund documents. Potential investors should carefully consider the risks described in those documents and, if required, consult a financial adviser before deciding to invest.
Offer, advice, or recommendation
No information in this communication is intended to act as an offer, investment advice or recommendation to buy or sell a product or to engage in investment services or activities. You must consult your investment adviser or a lawyer before engaging in any investment service or product.
GDPR
Lightman may process personal information of persons using this communication. Please read our privacy policy.
Copyright
This communication cannot be distributed or reproduced without our consent.