
- Inflation is likely to moderate for a few months. This may bring down bond yields – but to a smaller degree than expected.
- This scenario may provide some support for expensive equities and value may lag the equity market for a short time.
- But this is unlikely to last. Valuation polarisation remains extreme and long term fundamentals support the continued outperformance of value this year and next.
Supply chain bottlenecks are starting to ease, and higher interest rates and the rising cost of living are curbing demand. Some of the heat is starting to dissipate from the labour market with initial jobless claims bottoming out and starting to rise. From a mixture of year-on-year comparison effects and some lower demand drivers, headline inflation is due to moderate, from near double digit levels to a potential 3-5% range. This might be expected to enable bond yields to drift lower and help expensive growth equities find a footing.
All things being equal, this scenario may allow equity markets to recover somewhat with value equities potentially lagging expensive growth.
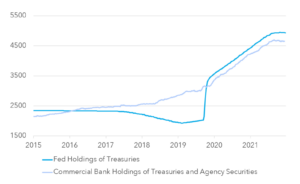
But there are caveats to this view. Whilst headline inflation is set to moderate, bond yields may not fall much. The two largest buyers of Treasuries in recent years have switched to selling. The first, as is well understood, are Central Banks. The second, that is less well discussed, are Commercial Banks. Commercial Banks have been large buyers of Treasuries for regulatory and cyclical purposes, but this demand is now coming to an end. Since the start of the pandemic, the Fed bought $2.9 trillion of Treasuries whilst Commercial Banks bought $1.7 trillion. The run rate of combined purchases from 2020 to the end of 2021 was nearly $200 billion per month.
Banks have to meet certain liquidity requirements under capital and resolution rules, which has forced them into Treasuries in recent years. The pandemic also caused a massive surge in deposits and most of these were funnelled by banks into Treasuries. But today banks have plentiful liquidity buffers and so face no regulatory driver to buy Government bonds. Deposit balances at banks are also now declining and so this fact reduces banks’ ability and willingness to hold Government debt. Commercial Banks reduced their Treasury holdings by around $40bn year to date and this decline is set to continue. The Fed will reduce its balance sheet by $47.5 billion per month in June, July and August and by up to $95 billion per month from September. This volume of selling from the two largest participants in the market will have to find significant private sector buyers simply to keep yields where they are. This means recession fears and lower inflation may have a more muted impact on the Treasury market than we are used to in the last two decades. Even in a recession it is possible that yields will have an upward bias.
Fed and Bank Holdings of Treasuries in $bn
Declining inflation will help growth equities. But stable Treasury yields will mitigate the scope of growth’s outperformance. If yields were to rise, the runway for growth’s outperformance will disappear.
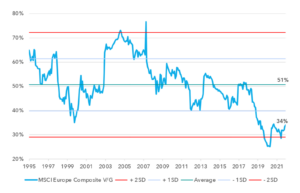
More tellingly, the fundamental support for value’s outperformance remains intact. Despite value’s strong performance in recent months, the value discount remains historically wide. As of today, European value equities are 34% of the price of growth equities. To return to the post 1995 average would require a further 50% re-rating.
MSCI Europe Composite Value / Growth 1995 – 2022
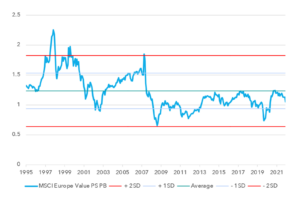
Looking into the sub components, value in absolute terms is also cheap, trading at a 20% discount to its post 1995 average.
MSCI Europe Value Composite Valuation / Price to Sales & Price to Book 1995 – 2022
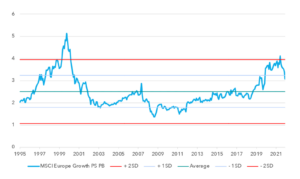
Growth equities have corrected, but still trade at a 21% premium to their post 1995 average.
MSCI Europe Growth Composite Valuation / Price to Sales & Price to Book 1995 – 2022
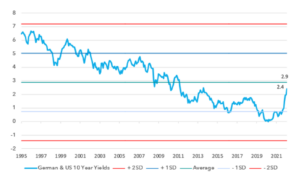
Whilst interest rates are not the only driver of valuation, it can be helpful to view rates in a similar light to the valuation screens above. European equities are influenced by both US and German yields as components of their risk free rate – and so below we show a composite of both yields back to 1995. Today’s composite yield is below the post 1995 average of 2.9% but not by a significant margin. The higher yields go, the harder it will be to justify the current valuation of growth equities. In contrast, value equities are cheap compared to their post 1995 average, yet the current level of yields suggests they should trade at a premium to their average rating. Whilst this is a simple analogue, all things being equal, the composite yield would need to rise above 3.5% to cap today’s valuation for European value. This means there is still a decent margin of safety for European value in absolute terms, even if yields rise further.
US & German Average 10 Year Yields
One of the pre-conditions that helps growth investing and hinders value investing is ultra-low inflation in the 0%-1.5% range. For a number of reasons, we believe it will be unlikely for inflation to fall back to these levels sustainably in the foreseeable future. One important driver is the price of energy. Even in a recession we do not see the conditions for a significant decline in oil prices. This comes down to the supply side.
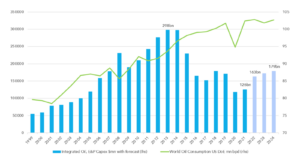
Below we show oil capex for the 31 largest listed Integrated and E&P companies. This data shows historic capex from 1999-2021 with forecasts based on company announcements for 2022 – 2025. We show capex alongside global consumption. Despite many forecasts of global oil demand declines, it has yet to materialise outside of recessions – yet capex has plummeted since 2014. The expectation of future demand declines continues to hold capex back.
2021 capex was equivalent to the level last seen 16 years ago when global oil consumption was 86 million barrels per day (m b/d). 2022 capex is equivalent to 2006 levels when consumption was 86-87m b/d, yet consumption this year will be 102-103m b/d. The price signal is not working, capex is not ramping up as you would ordinarily expect. Today’s recession concerns will further undermine capex intentions.
Since 2014 oil consumption is up 10% and capex is down 60%
Past disinflationary episodes have aligned with two trends, both demand and supply. Higher interest rates have dealt with the demand side, and a prior ramp-up in investments have dealt with the supply side. In 2022 only the demand side is being dealt with. The supply side remains tight in a number of commodities. This will limit the scope of price declines, irrespective of the level of interest rates. Similarly, any recovery in demand will quickly bump up against supply constraints. Central banks can’t deal with the supply side and so a true disinflationary episode can only materialise after an investment boom in commodities and in particular oil. This is yet to materialise. This leaves the outlook for consumption and expensive asset prices challenged. Rates may not fall significantly, nor will consumption be able to drive a recovery until the supply side responds.
The market is also vulnerable to incremental supply shocks, even in a recession. In the second half of 2022 there is a risk that Russia switches their gas off to Europe. So far we have seen intermittent changes to flows as Russia tries to divide Europe in their support for Ukraine. But given European dependence on Russian energy is set to reduce sharply in the coming years, Russia’s political leverage with energy will soon expire. The winter of 2022 and to a lesser extent the winter of 2023 are Russia’s last chances to put major pressure on the European Union. It would be surprising if they did not cause disruption in Q3 and Q4 this year.
An incremental energy shock will have widespread implications for European companies, consumers and governments. But for the purposes of this note, it is relevant because it will extend elevated inflation expectations. The longer inflation expectations are elevated, the more likely they percolate into wages and risk becoming more entrenched. Expensive securities do not reflect these risks.
The best defence in this market remains value, focussing on companies with high free cashflow yields and strong balance sheets who can capitalise on higher inflation where it is found. The LF Lightman European Fund has a median PE of 9.01 in 2022 and 8.71 in 2023. The price to sales ratio is 0.93 and price to book is 1.09. The forecast dividend yield is 4.2% in 2022 and 4.7% in 2023. We remain confident about the absolute and relative returns for the LF Lightman European Fund for this this year and next.
Sources:
Lightman, MSCI, Bloomberg, The Federal Reserve, Company Reports
Legal
Disclaimer
This communication and its content are owned by Lightman Investment Management Limited (“Lightman”, “we”, “us”). Lightman Investment Management Limited (FRN: 827120) is authorised and regulated by the Financial Conduct Authority (“FCA”) as a UK MiFID portfolio manager eligible to deal with professional clients and eligible counterparties in the UK. Lightman is registered with Companies House in England and Wales under the registration number 11647387, having its registered office at c/o Buzzacott LLP, 130 Wood Street, London, United Kingdom, EC2V 6DL.
Target audience
This communication is intended for ‘Eligible Counterparties’ and ‘Professional’ clients only, as described under the UK Financial Services and Markets Act 2000 (“FSMA”) (and any amendments to it). It is not intended for ‘Retail’ clients and Lightman does not have permission to provide investment services to retail clients. Generally, marketing communications are only intended for ‘Eligible Counterparties’ and ‘Professional’ clients in the UK, unless they are being used for purposes other than marketing, such as regulations and compliance etc. The Firm may produce marketing or communication documents for selected investor types in non UK jurisdictions. Such documents would clearly state the target audience and target jurisdiction.
Collective Investment Scheme(s)
The collective investment scheme(s) – WS Lightman Investment Funds (PRN: 838695) (“UK OEIC”, “UK umbrella”), and WS Lightman European Fund (PRN: 838696) (“UK sub-fund”, “UK product”) are regulated collective scheme(s), authorised and regulated by the FCA. In accordance with Section 238 of FSMA, such schemes can be marketed to the UK general public. Lightman, however, does not intend to receive subscription or redemption orders from retail clients and accordingly such retail clients should either contact their investment adviser or the Management Company Waystone Management (UK) Limited (“Waystone UK”) in relation to any fund documents.
The collective investment scheme(s) - Elevation Fund SICAV (Code: O00012482) (“Luxembourg SICAV”, “Luxembourg umbrella”), and Lightman European Equities Fund (Code: O00012482_00000002) (“Luxembourg sub-fund”, “Lux product”) are regulated undertakings for collective investments in transferrable securities (UCITS), authorised and regulated by the Commission de Surveillance du Secteur Financier (CSSF) in Luxembourg. In accordance with regulatory approvals obtained under the requirements of the Law of 17 December 2010 relating to undertakings for collective investment, the schemes can be marketed to the public in Luxembourg, Norway, Spain, and Republic of Ireland. Lightman, however, does not intend to receive subscription or redemption orders from any client types for the Lux product and accordingly such client should either contact a domestic distributor, domestic investment advisor or the Management Company Link Fund Solutions (Luxembourg) S.A. (“Link Luxembourg”) in relation to any fund documents.
Luxembourg umbrella and Luxembourg sub-fund are also approved for marketing to professional clients and eligible counterparties in the UK under the UK National Private Placement Regime (NPPR). UK registration numbers for the funds are as follows: Elevation Fund SICAV (PRN: 957838) and Lightman European Equities Fund (PRN: 957839). Please write to us at compliance@lightmanfunds.com for proof of UK registration of the funds.
Luxembourg sub-fund is also approved for marketing to qualified investors in Switzerland, within the meaning of Art. 10 para. 3 and 3ter CISA. In Switzerland, the representative is Acolin Fund Services AG, Leutschenbachstrasse 50, 8050 Zurich, Switzerland, whilst the paying agent is NPB Neue Privat Bank AG, Limmatquai 1 / am Bellevue, 8024 Zurich, Switzerland.
Accuracy and correctness of information
Lightman takes all reasonable steps to ensure the accuracy and completeness of its communications; we however request all recipients to contact us directly for the latest information and documents as issued documents may not be fully updated. We cannot accept any liability arising from loss or damage from the use of this communication.
Wherever our communications refer to a third party such as Waystone, Link, Northern Trust etc., we cannot accept any responsibility for the availability of their services or the accuracy and correctness of their content. We urge users to contact the third party for any query related to their services.
Important information for non-UK persons (Including US persons)
This communication is not intended for any person outside of the UK, Switzerland, or the European Economic Area (EEA). Lightman or any of the funds referenced in this communication are not approved for marketing outside of the UK, Switzerland, or the EEA. All such persons must consult their domestic lawyers in relation to services or products offered by Lightman.
Risk warning to all investors
The value of investments in any financial assets may fall as well as rise. Investors may not get back the amount they originally invested. Past performance is not an indicator of future performance. Potential investors should not use this communication as the basis of an investment decision. Decisions to invest in any fund should be taken only on the basis of information available in the latest fund documents. Potential investors should carefully consider the risks described in those documents and, if required, consult a financial adviser before deciding to invest.
Offer, advice, or recommendation
No information in this communication is intended to act as an offer, investment advice or recommendation to buy or sell a product or to engage in investment services or activities. You must consult your investment adviser or a lawyer before engaging in any investment service or product.
GDPR
Lightman may process personal information of persons using this communication. Please read our privacy policy.
Copyright
This communication cannot be distributed or reproduced without our consent.