
First, let us address the bear case for Energy. A recession may be coming and this will likely see oil demand fall. How do we think about potential oil consumption decline scenarios?
Recession scenarios and oil demand
Global real GDP growth has a relationship with oil consumption, but with oil consumption consistently lower than GDP growth. Below we show annual oil consumption growth since 1972 compared to real GDP growth that is deflated. We can achieve a reasonable fit if oil consumption is matched with global GDP growth that is deflated by 2.07% per year.
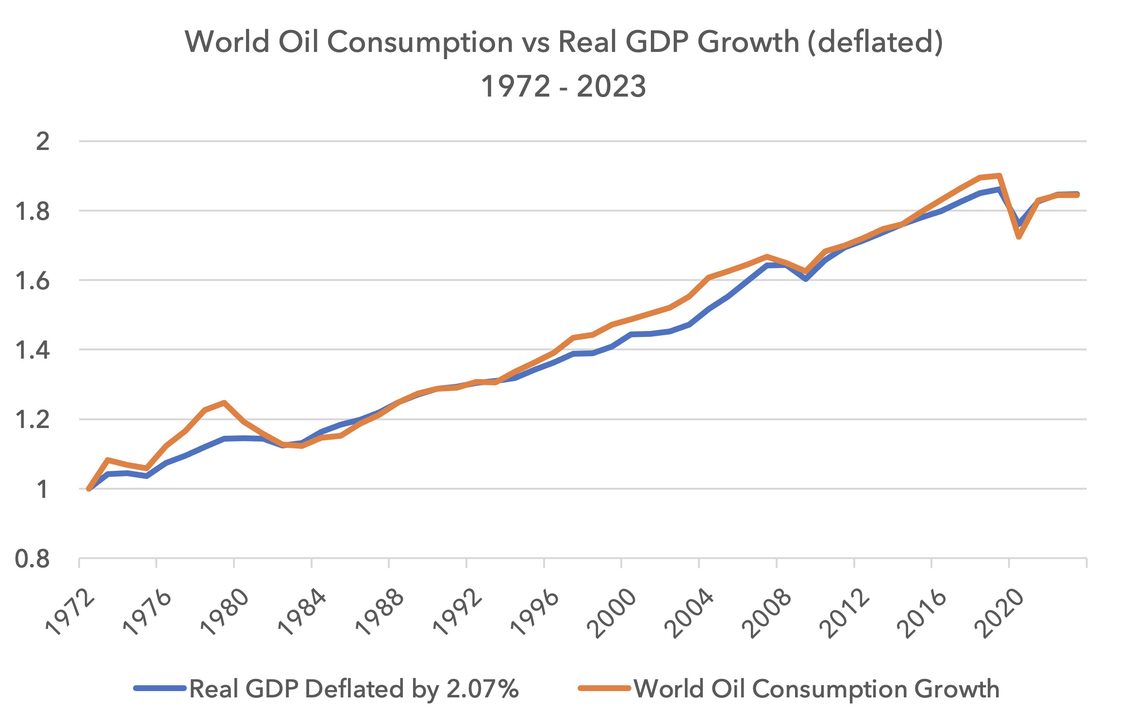
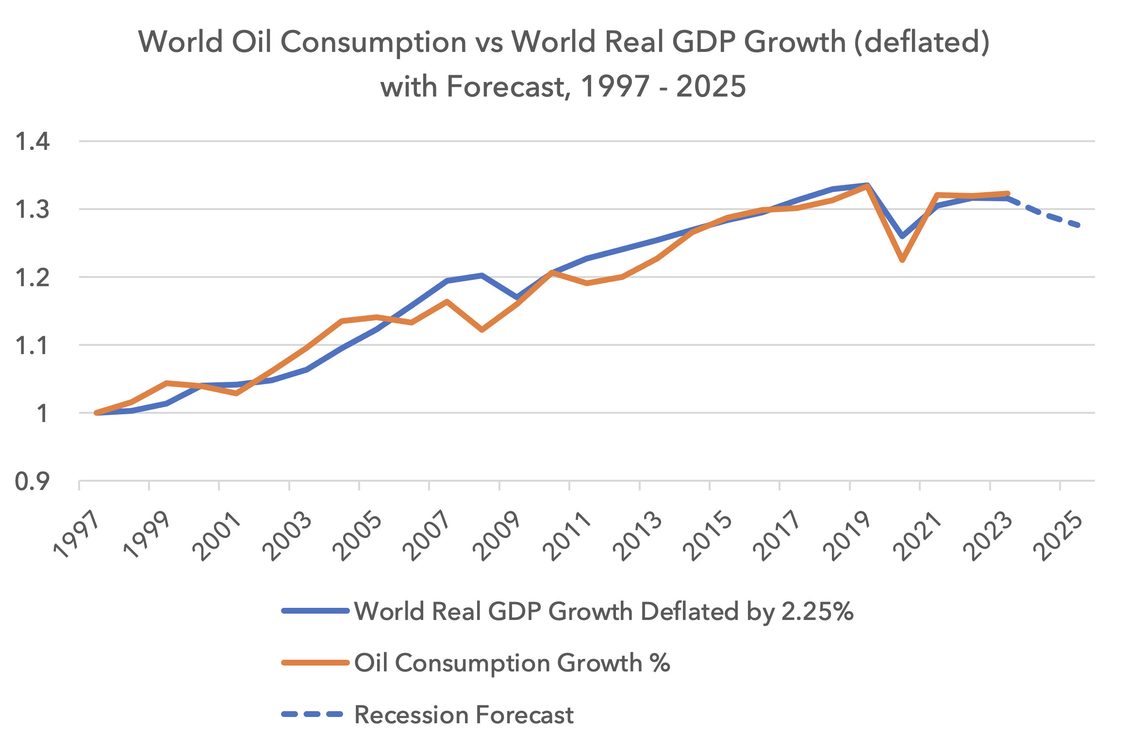
Whilst this series matches real GDP growth to the end point of oil consumption in 2023, it does not match well in the earlier years. This is because the world is progressively using less oil over time per unit of GDP growth. If we run this series over a more recent time horizon, we need to use a larger deflator. Below we match real GDP with oil consumption since 1997, and this time we use a 2.25% deflator to help match the series.
This suggests global GDP growth of approximately 2.25% is required today simply to create stable oil demand. Oil demand will only rise if global real GDP growth is above 2.25%. As the decade progresses, the deflator will rise, meaning higher GDP growth than 2.25% will be needed to keep oil consumption stable.
Today, consensus global real GDP growth forecasts for 2024 and 2025 are 2.9% and 3.3%. Let us assume these numbers are too high. For the sake of this forecast let us assume real GDP growth will amount to only 0.5% in 2024 and 1% in 2025, due to recessions in certain countries. This is a relatively cautious forecast since there have only been three years since 1970 with real global GDP growth of less than 0.5%. These years were 1982, 2009 and 2020.
If we apply this recession forecast, global oil consumption would likely fall by 1.75% in 2024 and 1.25% in 2025. The forecast is shown in the dotted blue line of the chart below.
Strategic Petroleum Reserve not yet a tailwind
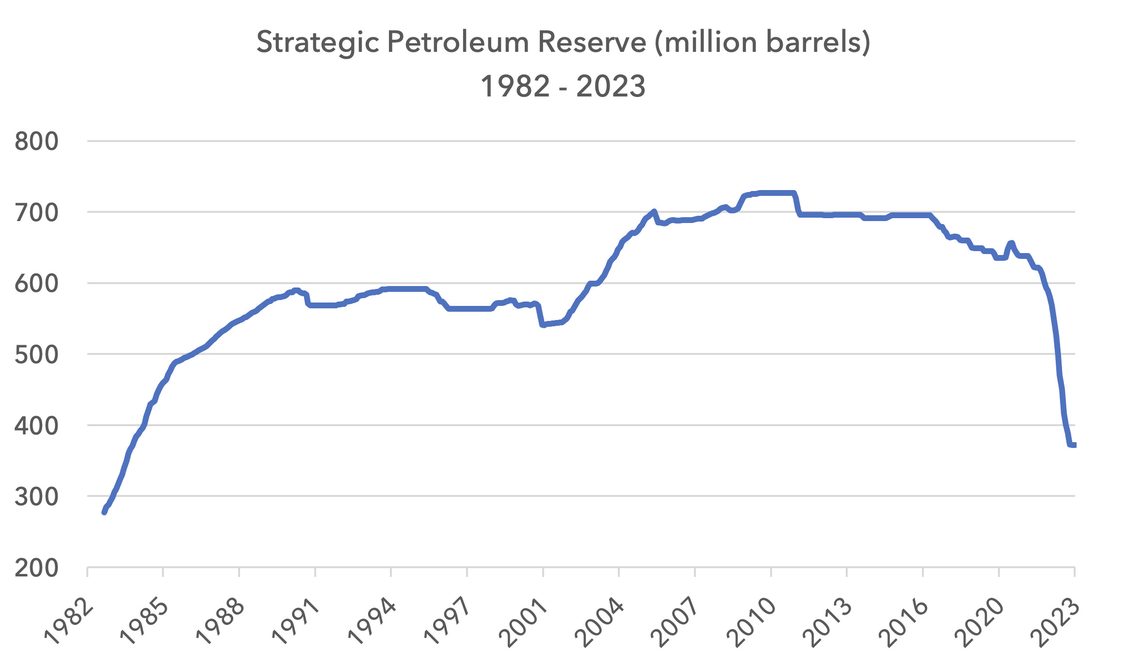
The Strategic Petroleum Reserve (SPR) has been significantly depleted, and is back to levels seen in 1983, as we show in the chart below. In the last three years, the US released over 300 million barrels. This has significantly diminished the upward pressure on oil prices. At some point, this reserve is likely to be rebuilt, but this is not likely to happen this year. On 23 March 2023, the US government confirmed that it is in no rush to rebuild the SPR. This hurt oil sentiment and oil equities. More negative still, there is a further SPR release starting from 1 April and concluding on 30 June of 26 million barrels. Spread over three months this amounts to an incremental 30 basis point of supply relative to global demand. It does not sound like a large amount but in a softening market it could help keep US oil prices lower in the second quarter of 2023.
Given this potential weak demand backdrop with a further short-term release from the SPR, why stay overweight oil companies? There are four key reasons.
1. Oil is likely to have a higher elasticity of supply in this downturn than in past downturns, meaning supply will adjust quickly to a demand decline
2. The oil industry has a decade of cumulative underinvestment behind it, meaning shortfalls in supply are likely structural
3. The Russian oil industry is unlikely to be able to grow production
4. Oil equities have record high free cash flow yields, low valuations, next to no debt and management strategies focussed on cash returns
A higher elasticity of supply
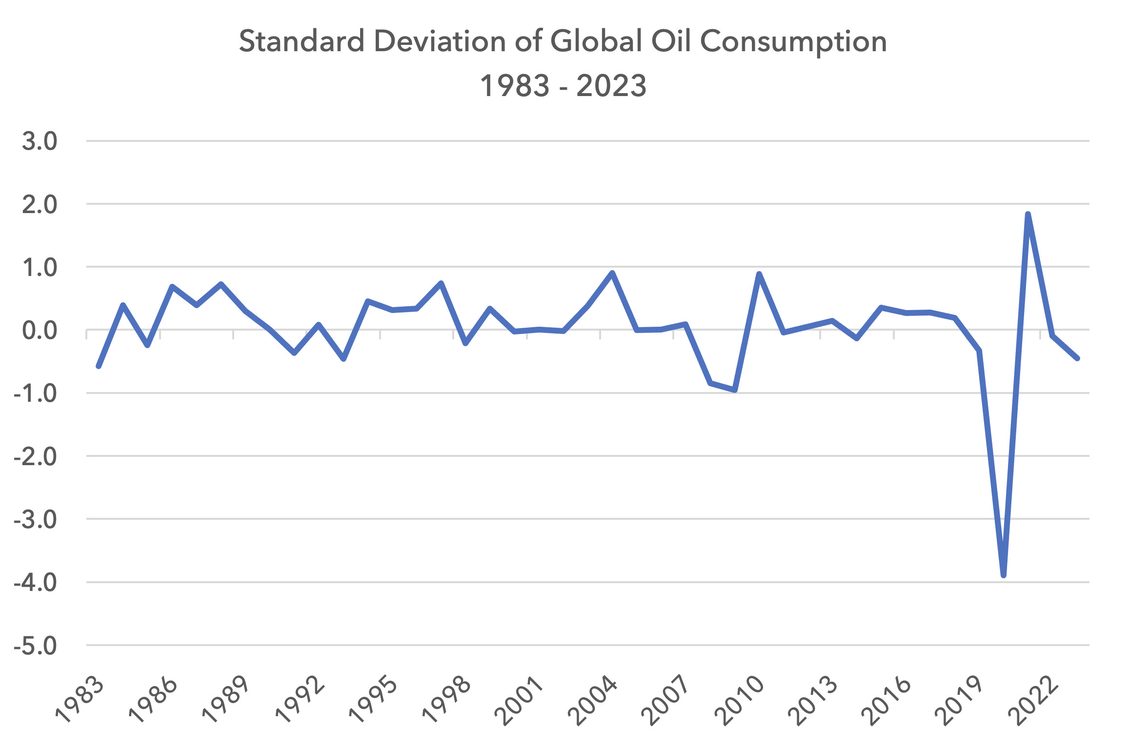
Over the last 15 years, global oil consumption has seen immense volatility relative to history. Below we show the standard deviation of global oil consumption over the last 40 years. Not only has the industry had to cope with the impact of the financial crisis, where oil demand declined at the steepest rate in 40 years, but also it has had to cope with the pandemic in 2020, which was a four standard deviation event.
OPEC supply flexibility and incentives
Below we show OPEC’s year-on-year oil production change in percentage terms since 1995. Even though the pandemic came with no warning, OPEC was able to cut production by 25% by June 2020. We can also see the scale of oil production declines in 2009 and during the more shallow recession of 2001. The scale of production flexibility is impressive. The issue for OPEC – and the oil price – is not one of production flexibility but one of foresight, or the lack of it. The 2008-9 financial crisis was a shock and not anticipated by most investors, or oil analysts. The pandemic was even more of a shock, with no time to prepare. But the economic slowdown of 2023 has been widely telegraphed. It is not like the shocks of 2008 or 2020.
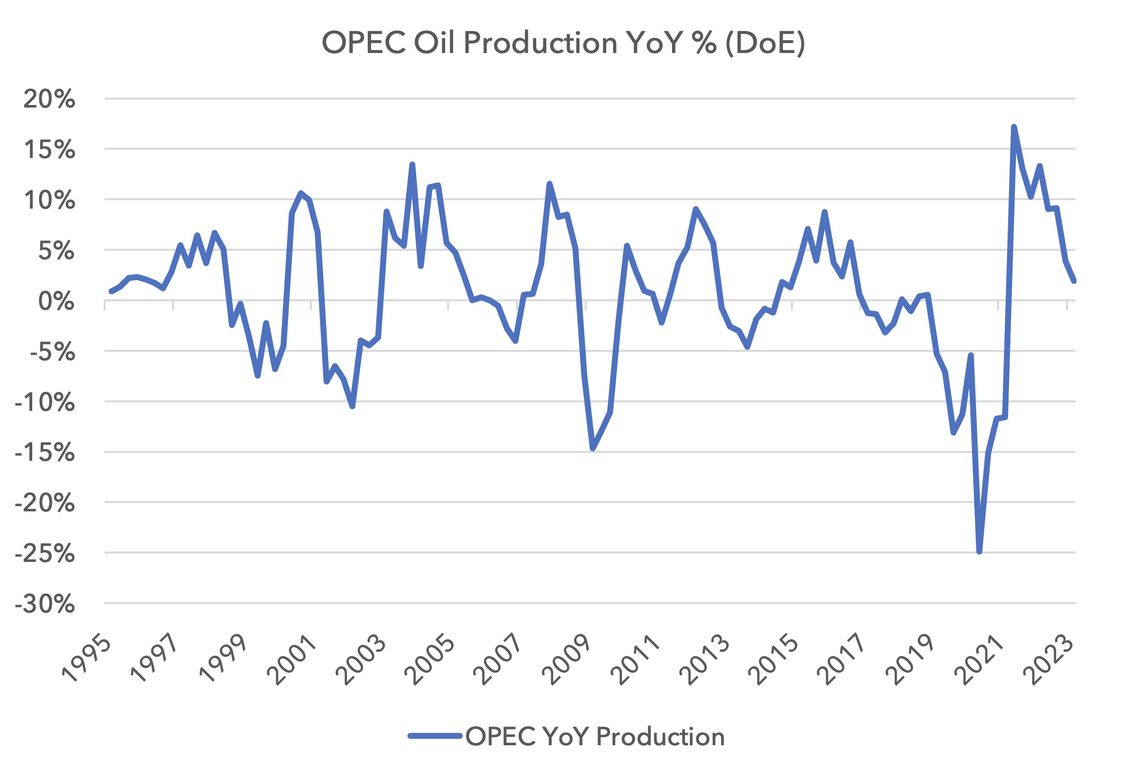
OPEC is already scaling back production and this will likely intensify in the coming months. Once OPEC gets the message they respond decisively. In our recession scenario we anticipate a cumulative oil demand decline of 3% over two years. This is similar to the 3.5% decline we saw over the calendar year in 2009. Given how well telegraphed this slowdown has been, it is not a stretch to assume OPEC will respond in a timely manner to help to balance the market.
OPEC is also incentivised to stabilise the market at $65-70. Below we show the fiscal breakeven of OPEC countries using IMF data and 2022 government spending budgets.
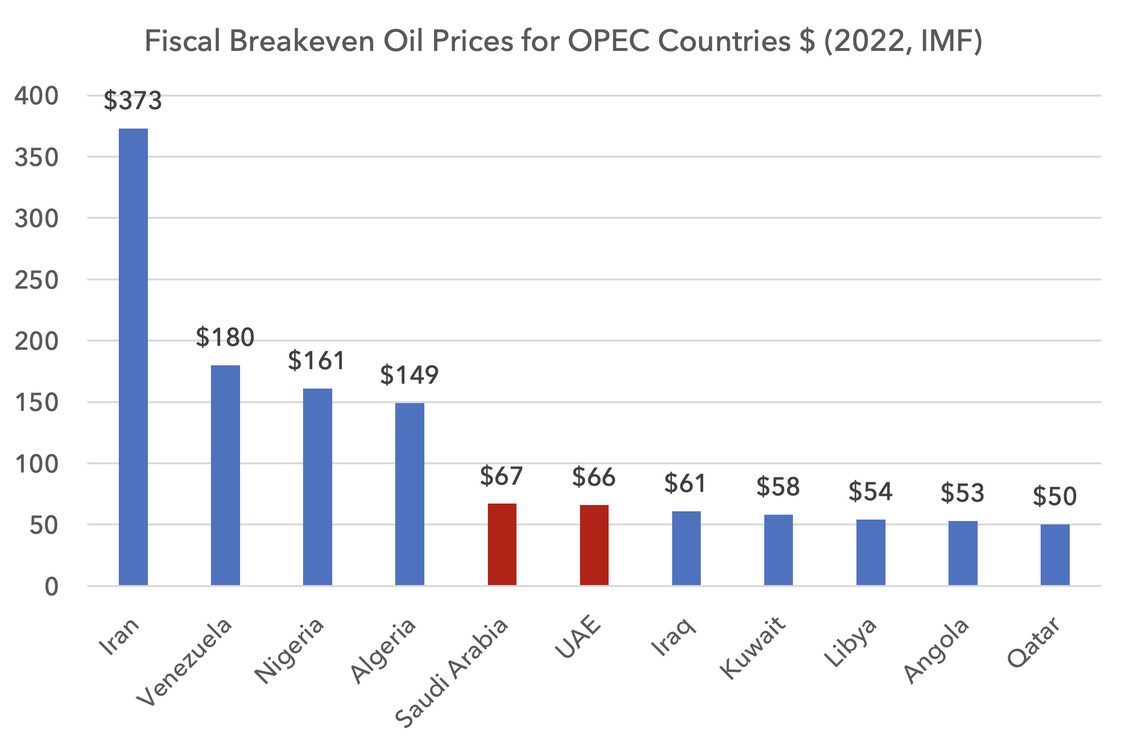
Saudi is OPEC’s de facto leader, and together with Iraq and the UAE, they make up 60% of OPEC production. Each of these important countries would like oil to hold at or above the $65-70 level.
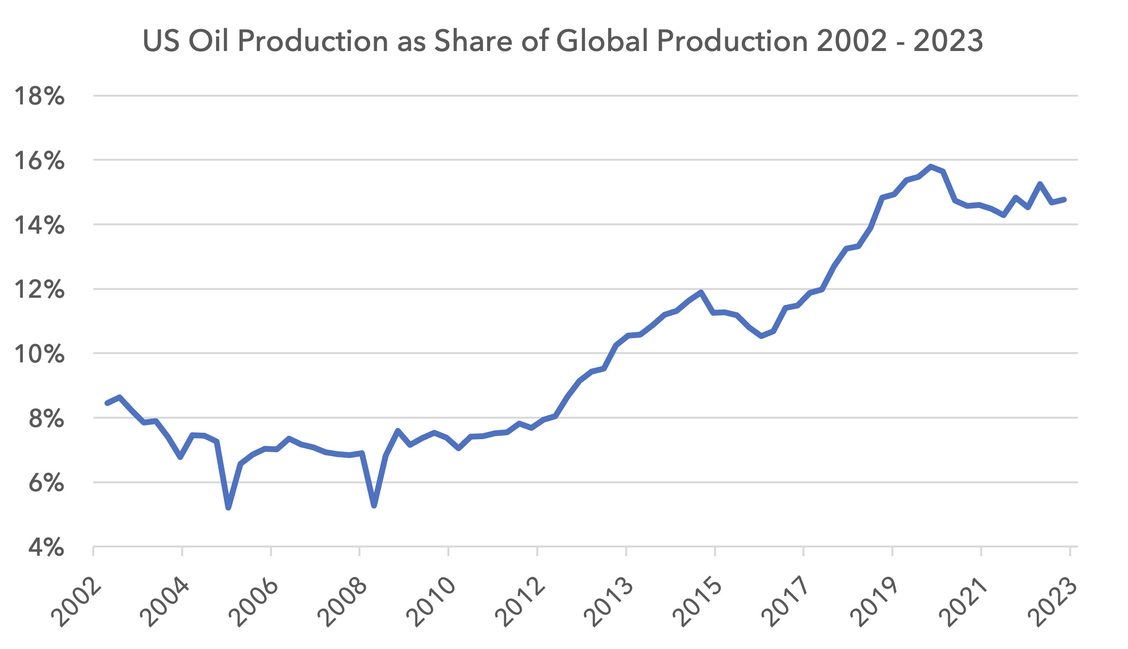
The importance of the US market and US incentives
Whilst OPEC still dominates global production, the US is now the world’s largest single producer, having overtaken Saudi and Russia in 2017 and 2018. Below we show US production as a percentage of global production from 2002 – 2023.
The US supply response to a demand slowdown will be an important part of bringing the market into balance within this cycle. Given the US-centric banking crisis in recent weeks, and the echoes of 2008, we anticipate US oil management teams scaling back production plans in 2023 and 2024.
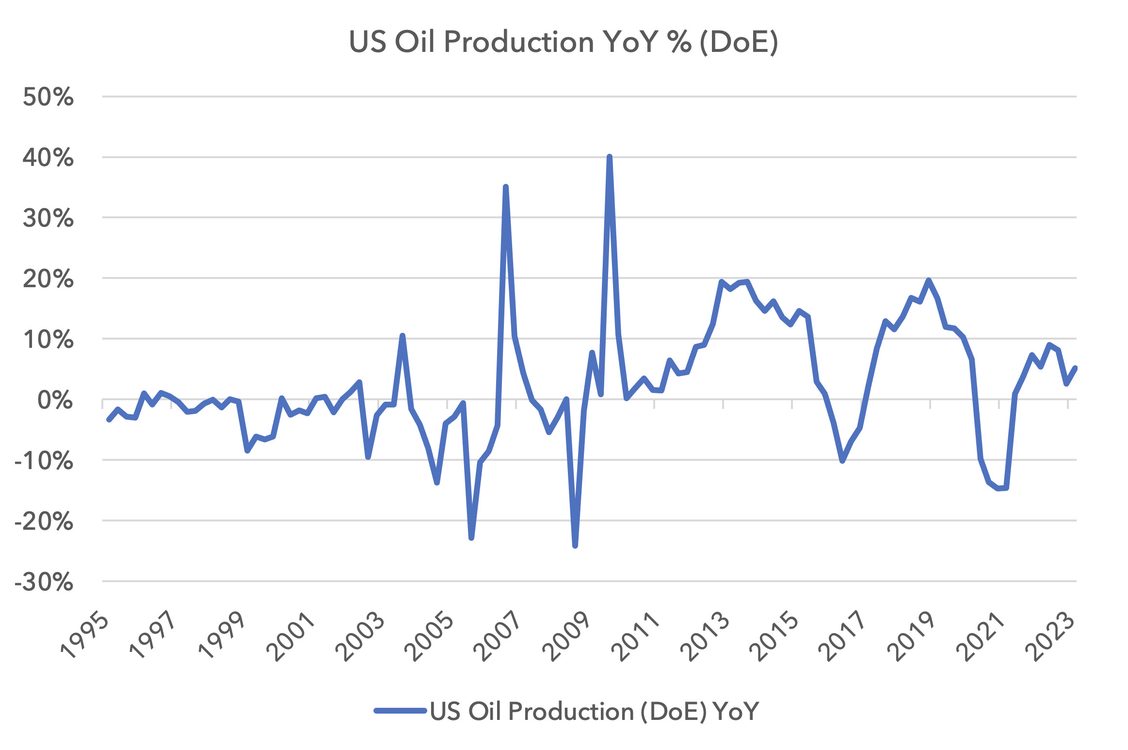
From a production profile point of view, shale oil production is able to sharply adjust volumes, given its short-cycle nature. Shale oil wells deplete quickly and so production can only be maintained by continuous new drilling.
Below we show US oil production by year-on-year percentage change. The US cut production by 15% in 2020 and by more during the financial crisis. Having cut back production sharply in 2020, US management teams have demonstrated their production flexibility and will likely respond quickly again. Given recent boom and bust cycles, shale oil companies are now focussed on free cash flow and supply discipline. Like OPEC producers, US producers are ready and able to cut supply sharply.
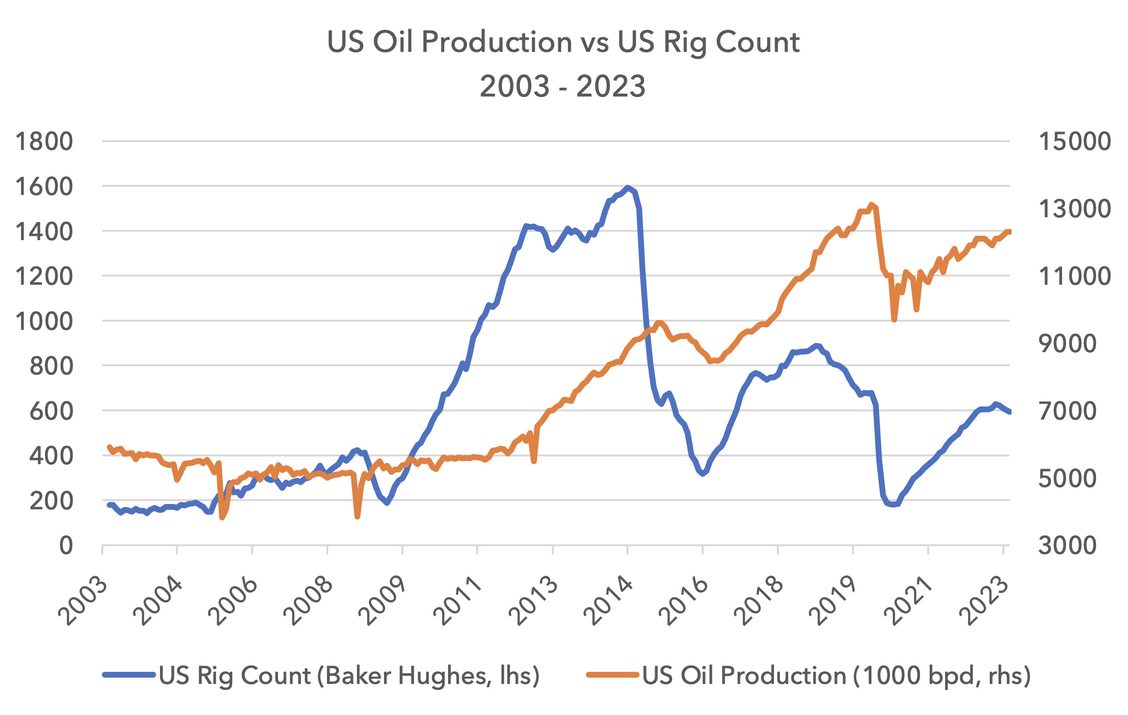
There is some tentative evidence of future production declines in the US. Below we show US oil production in absolute terms in orange with the Baker Hughes US rig count in blue. This calculates the number of oil rigs that are presently active in North America.
Although not easy to see in the chart, the US rig count has been falling for three consecutive months and we expect these declines to continue. Production declines may come later this year.
Cumulative underinvestment over a decade
Whilst there is a strong case that OPEC and US production will drop to match demand declines, there is also the lasting impact of years of underinvestment in the oil industry. Oil suffered a 12-year bear market from 2008 – 2020 and this was reflected by very low investment rates. A period of overinvestment in the 2008 – 2012 period created a bust that was met by existential worries about long-term oil demand and the advent of electric vehicles, helping to drive steep investment declines.
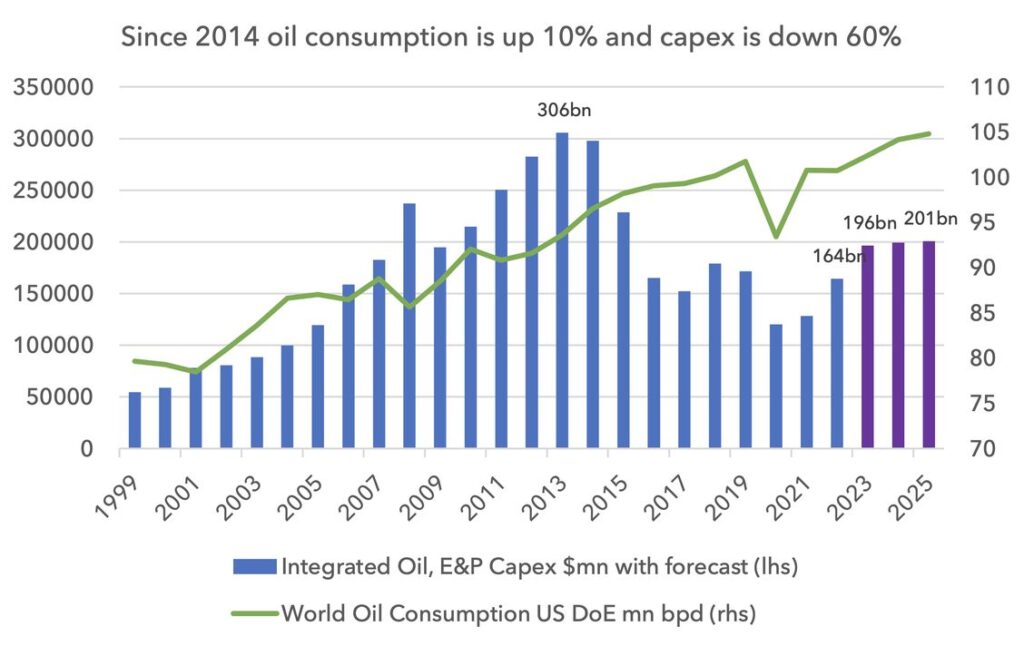
Below we show the aggregated annual capex of the 31 largest listed oil companies in the developed world from 1999 – 2022 with forecasts out to 2025 using company compiled consensus. We compare this capex to historic global oil consumption in green with US Department of Energy forecasts. In 2012 these 31 companies were investing over $300bn per year. Capex subsequently more than halved. The cumulative underinvestment over the last decade is approximately $900bn. This leaves it likely that supply will tend to surprise to the downside on a structural basis this decade.
Russian production
Russia is the wild card in 2023 and 2024. Because of the war, Russia is incentivised to maximise revenues. What this means for production is difficult to forecast.
Russia is responsible for 12.5% of global production today. Since the war broke out, Russian production has held up better than originally expected. Below we show Russian oil production year-on-year in percentage terms. It is now just slightly negative year-on-year.
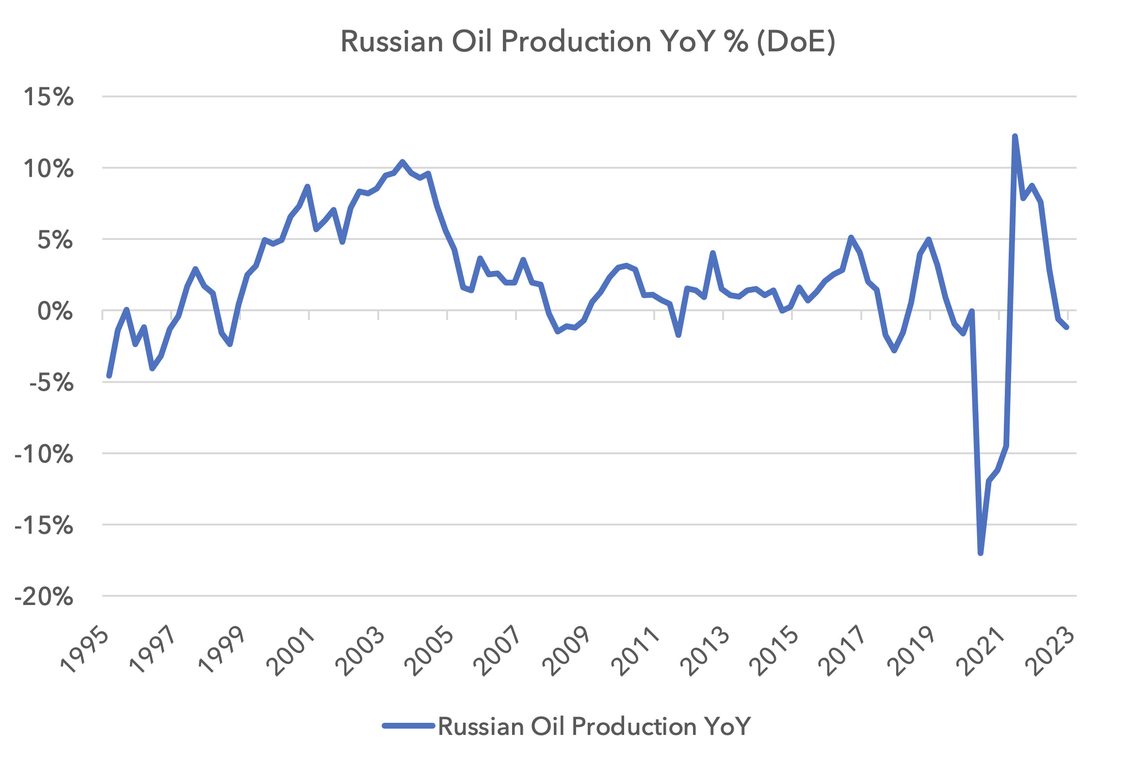
Many western companies have pulled out of Russia but some companies are still operating. In oil services, Halliburton and Baker Hughes pulled out of Russia, selling their local operations, but Schlumberger and Weatherford remained. Many large integrated oil companies have pulled out, like Shell and BP, but Total has chosen to stay and keep operating. This is a risky strategy by those companies remaining and will likely prove an expensive mistake over time, but this has helped Russia keep some access to western oil technology and maintain production stability for now.
Whilst Russian production has performed better than expected in 2022, given the scale of the western exodus and sanctions, it is more likely that production will modestly decrease than increase in the coming years.
Oil company free cash flow and valuations
The analysis above suggests oil should exhibit less downside volatility than in previous crises. More importantly, oil equities, where we gain exposure to the industry, are in a solid position. Valuations are very low, free cash flow yields high and balance sheets strong. Management teams are focussed on capex discipline, generating free cashflow and returning this cash to shareholders. PE ratios of our oil companies are 4-6x in 2023 with free cash flow yields averaging 15%. Companies are either in a net cash position or close to it. Oil breakeven rates are approximately $40. Brent today is $75, which remains a solidly profitable level.
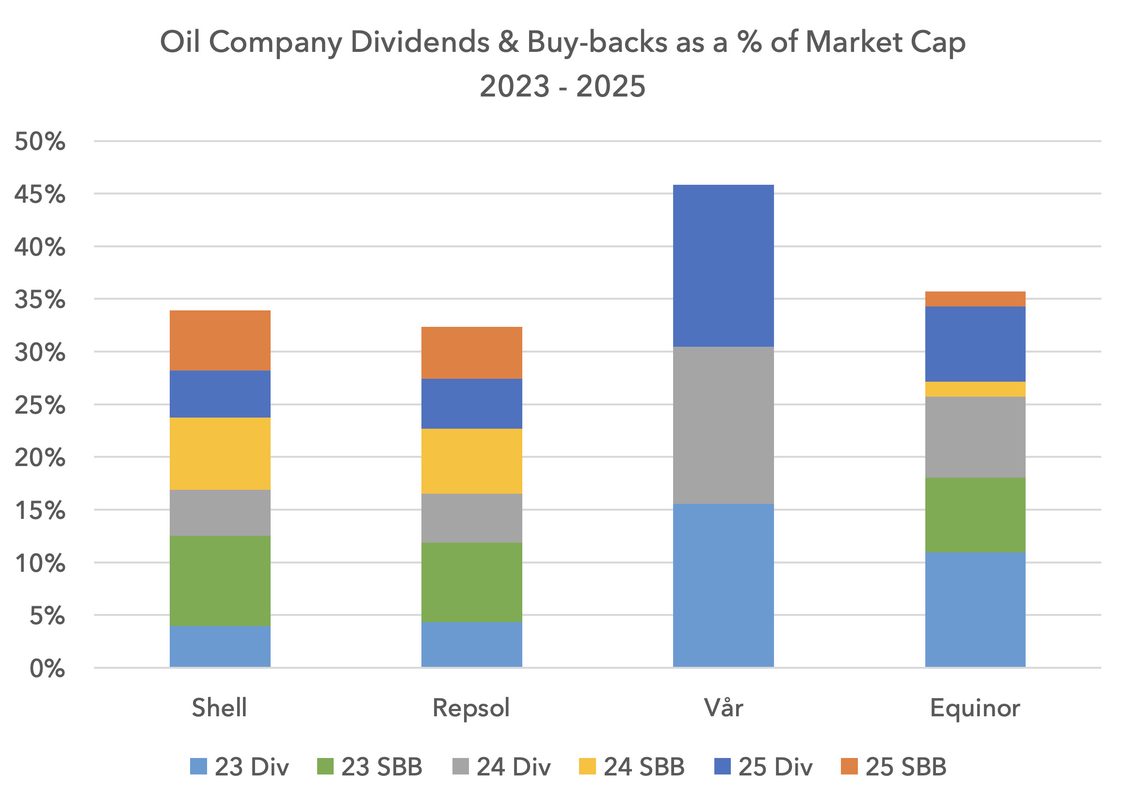
Below we show potential cash returns in the form of dividends and buybacks for 2023, 2024 and 2025 for four oil companies. In all cases, companies are capable of returning over 30% of their market capitalisation over the coming three years. If oil prices were to average $75-$85 this decade, these companies could return 100% of their market cap over the period. There is no other equity market investment even close to this potential cash return. In a benign macro-economic environment, the European banks would be the second best in the market from a potential cash return perspective, but still offer about a third less than the oil companies.
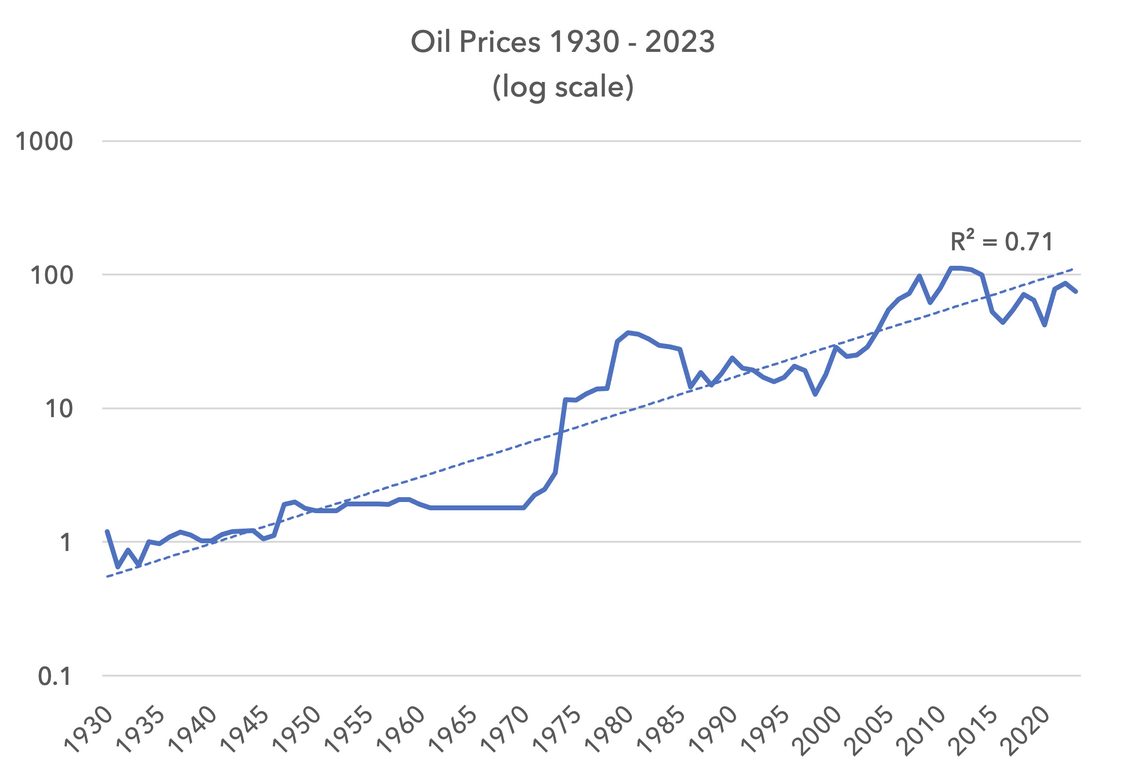
The longer-term perspective
It is quite hard to find long-term oil charts. We constructed the chart below using a mixture of time series. What is noticeable is that oil has been in an uptrend for 100 years. Based on the regression of this near 100-year trend, the trend level of oil in 2023 is approximately $110. Given recession fears, spot prices are $70-$75, more than 1.5 standard deviations below trend. These recession fears are appropriate. But the oil price may already be discounting a large part of the economic downside risk.
Our Energy investments have been very resilient since we moved overweight in the summer of 2021. They provided powerful returns in 2022, when most asset prices were falling. But the Lightman European funds have struggled relative to the benchmark over the last month. Whilst we evaded most of the downside risk from banks, we have not evaded the downside from energy. The falling oil price has also hindered Materials where we are overweight and supported Consumer Discretionary and Technology, where we are underweight.
Over the last month investors are re-running the 2008 playbook. Banking system stress and a pending recession has driven a liquidation of Energy positions. Given recent memory, this response is in some ways understandable. But the 2023 backdrop is very different to 2008. Even in recession, the supply response will be quicker than in prior cycles. Whether it is OPEC producers or oil management teams, both have seen this movie before and are prepared.
We view this weakness in oil as providing an interesting long-term entry point into European oil equities. We have modestly added to positions in the last week to maintain our overweight stance. There appears to be an asymmetry in the risk profile for absolute and relative returns: lower downside risk to oil company earnings than normal in the event of recession, with significant upside risks to earnings in the event of a more resilient economy. Valuations do not reflect this asymmetry. With balance sheets and free cash flow as strong as they are, we view oil companies as likely to be solid and defensive investments over the majority of this decade.
Sources:
US Department of Energy, IEA, BP Statistical Review of World Energy, IMF, Strategas, Bloomberg, Lightman Investment Management
Legal
Disclaimer
This communication and its content are owned by Lightman Investment Management Limited (“Lightman”, “we”, “us”). Lightman Investment Management Limited (FRN: 827120) is authorised and regulated by the Financial Conduct Authority (“FCA”) as a UK MiFID portfolio manager eligible to deal with professional clients and eligible counterparties in the UK. Lightman is registered with Companies House in England and Wales under the registration number 11647387, having its registered office at c/o Buzzacott LLP, 130 Wood Street, London, United Kingdom, EC2V 6DL.
Target audience
This communication is intended for ‘Eligible Counterparties’ and ‘Professional’ clients only, as described under the UK Financial Services and Markets Act 2000 (“FSMA”) (and any amendments to it). It is not intended for ‘Retail’ clients and Lightman does not have permission to provide investment services to retail clients. Generally, marketing communications are only intended for ‘Eligible Counterparties’ and ‘Professional’ clients in the UK, unless they are being used for purposes other than marketing, such as regulations and compliance etc. The Firm may produce marketing or communication documents for selected investor types in non UK jurisdictions. Such documents would clearly state the target audience and target jurisdiction.
Collective Investment Scheme(s)
The collective investment scheme(s) – WS Lightman Investment Funds (PRN: 838695) (“UK OEIC”, “UK umbrella”), and WS Lightman European Fund (PRN: 838696) (“UK sub-fund”, “UK product”) are regulated collective scheme(s), authorised and regulated by the FCA. In accordance with Section 238 of FSMA, such schemes can be marketed to the UK general public. Lightman, however, does not intend to receive subscription or redemption orders from retail clients and accordingly such retail clients should either contact their investment adviser or the Management Company Waystone Management (UK) Limited (“Waystone UK”) in relation to any fund documents.
The collective investment scheme(s) - Elevation Fund SICAV (Code: O00012482) (“Luxembourg SICAV”, “Luxembourg umbrella”), and Lightman European Equities Fund (Code: O00012482_00000002) (“Luxembourg sub-fund”, “Lux product”) are regulated undertakings for collective investments in transferrable securities (UCITS), authorised and regulated by the Commission de Surveillance du Secteur Financier (CSSF) in Luxembourg. In accordance with regulatory approvals obtained under the requirements of the Law of 17 December 2010 relating to undertakings for collective investment, the schemes can be marketed to the public in Luxembourg, Norway, Spain, and Republic of Ireland. Lightman, however, does not intend to receive subscription or redemption orders from any client types for the Lux product and accordingly such client should either contact a domestic distributor, domestic investment advisor or the Management Company Link Fund Solutions (Luxembourg) S.A. (“Link Luxembourg”) in relation to any fund documents.
Luxembourg umbrella and Luxembourg sub-fund are also approved for marketing to professional clients and eligible counterparties in the UK under the UK National Private Placement Regime (NPPR). UK registration numbers for the funds are as follows: Elevation Fund SICAV (PRN: 957838) and Lightman European Equities Fund (PRN: 957839). Please write to us at compliance@lightmanfunds.com for proof of UK registration of the funds.
Luxembourg sub-fund is also approved for marketing to qualified investors in Switzerland, within the meaning of Art. 10 para. 3 and 3ter CISA. In Switzerland, the representative is Acolin Fund Services AG, Leutschenbachstrasse 50, 8050 Zurich, Switzerland, whilst the paying agent is NPB Neue Privat Bank AG, Limmatquai 1 / am Bellevue, 8024 Zurich, Switzerland.
Accuracy and correctness of information
Lightman takes all reasonable steps to ensure the accuracy and completeness of its communications; we however request all recipients to contact us directly for the latest information and documents as issued documents may not be fully updated. We cannot accept any liability arising from loss or damage from the use of this communication.
Wherever our communications refer to a third party such as Waystone, Link, Northern Trust etc., we cannot accept any responsibility for the availability of their services or the accuracy and correctness of their content. We urge users to contact the third party for any query related to their services.
Important information for non-UK persons (Including US persons)
This communication is not intended for any person outside of the UK, Switzerland, or the European Economic Area (EEA). Lightman or any of the funds referenced in this communication are not approved for marketing outside of the UK, Switzerland, or the EEA. All such persons must consult their domestic lawyers in relation to services or products offered by Lightman.
Risk warning to all investors
The value of investments in any financial assets may fall as well as rise. Investors may not get back the amount they originally invested. Past performance is not an indicator of future performance. Potential investors should not use this communication as the basis of an investment decision. Decisions to invest in any fund should be taken only on the basis of information available in the latest fund documents. Potential investors should carefully consider the risks described in those documents and, if required, consult a financial adviser before deciding to invest.
Offer, advice, or recommendation
No information in this communication is intended to act as an offer, investment advice or recommendation to buy or sell a product or to engage in investment services or activities. You must consult your investment adviser or a lawyer before engaging in any investment service or product.
GDPR
Lightman may process personal information of persons using this communication. Please read our privacy policy.
Copyright
This communication cannot be distributed or reproduced without our consent.