
Structural forces suggest higher inflation may persist this decade, for the following reasons:
- The rarity of 2% inflation
- Demographic changes and the impact on labour’s pricing power
- Globalisation in partial reverse
- The ESG Transition and its cost
- The political imperative – do Governments want 2% inflation?
Before we discuss inflation, we provide a short market update:
Despite the significant increase in interest rates in the developed world, the cost-of-living crisis and the huge inversion of the yield curve, we do not fear a deep recession in the short term. Various tactical factors ought to support the US and global economy over the coming two quarters.
30-year fixed rate mortgages dominate the property market in the US, and so interest rate hikes have had a limited impact on the US consumer so far. Gasoline prices seem more important in the near term, and the 20% fall in fuel prices since June is providing some consumer relief. A recent pick-up in US automotive and aerospace production will also mechanically support Q1 GDP.
In Europe, the energy crisis is not as severe as expected this winter, and natural gas prices have declined 50% since the summer. Whilst Germany is the large EU country most vulnerable to the energy crisis, the German government is expanding fiscal stimulus in 2023 vs 2022, providing some counterweight.
China has acted to stimulate its property market with over 1 trillion yuan of liquidity pledged in recent weeks. There is also a tentative exit from zero-Covid taking shape given the evidently finite patience of the Chinese population for their lockdown. The weaker dollar is also acting to ease global financial conditions.
These tactically supportive factors are taking place in the context of one of the most widely telegraphed recessions in history. Purchasing managers have been seeking to manage down their inventories for six months. If a deeper slowdown does not materialise soon, inventories will run low and PMI indicators will start to turn up. Market participants are also expecting recession with cash balances high and many asset allocators waiting to buy lower. Today investors expect rate cuts of 100 basis points starting in late 2023 with large allocations added to US Treasury markets in recent months.
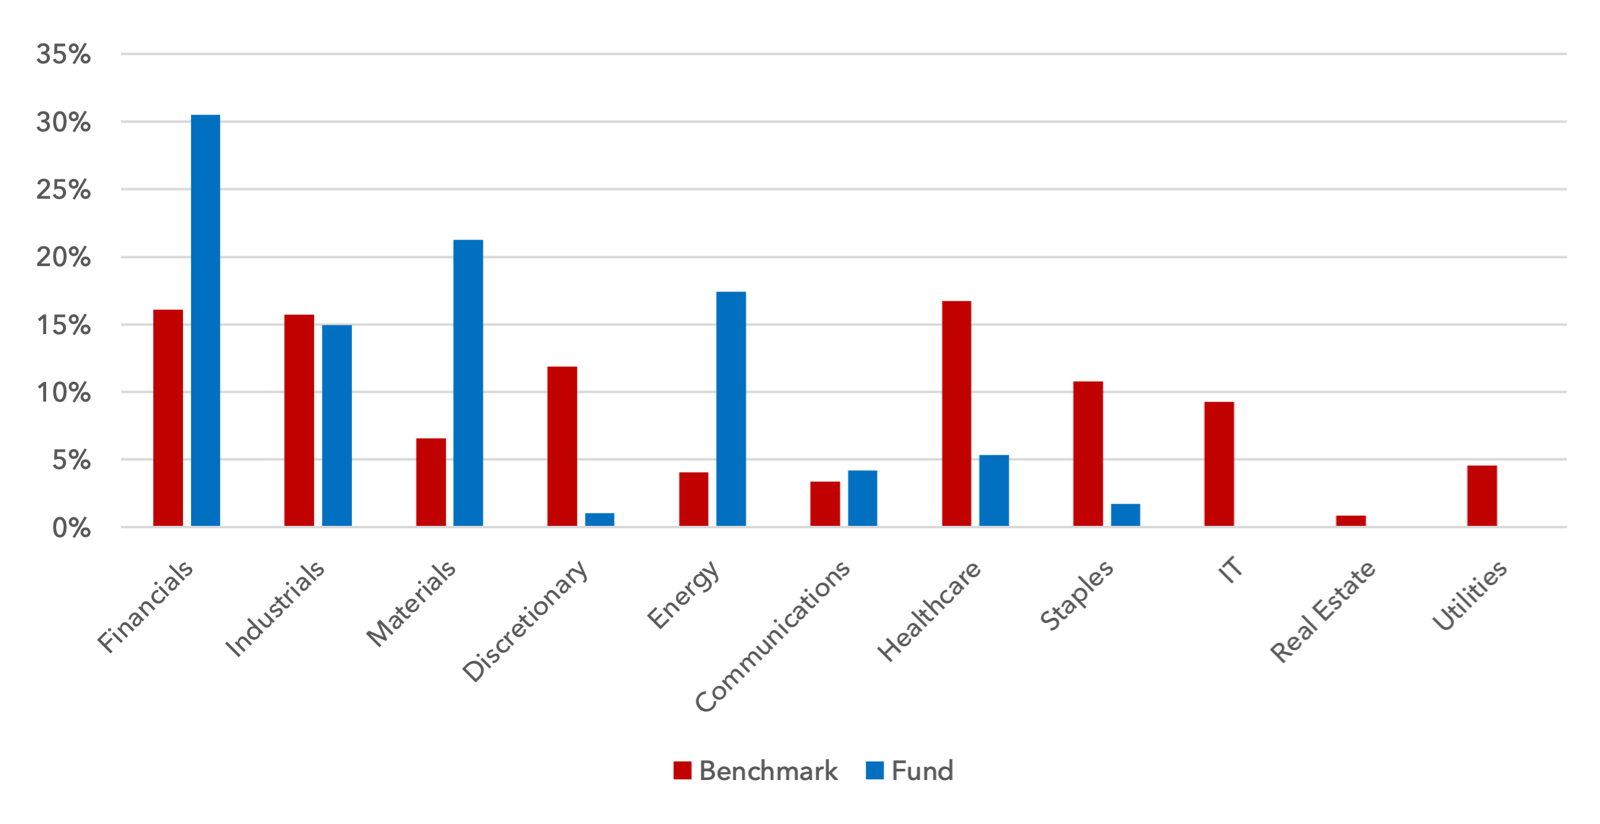
This setup has some similarities with the situation six months ago. In the short term, economic outcomes may be more resilient than expected and investor sentiment may prove too negative. But this better economic scenario might see bond yields rise and therefore valuation compression might continue. As in 2022, investors will be best served to own companies at low valuations with high free cashflow yields, low debt and, preferably, exposure to supply-constrained industries. In this context the Lightman European equity funds have not made many significant changes to positioning since the summer. We continue to believe Energy, select Banks, Materials and Industrial companies offer an attractive balance of low valuation, earnings growth and balance sheet strength.
Lightman European Sector Weights vs MSCI Benchmark
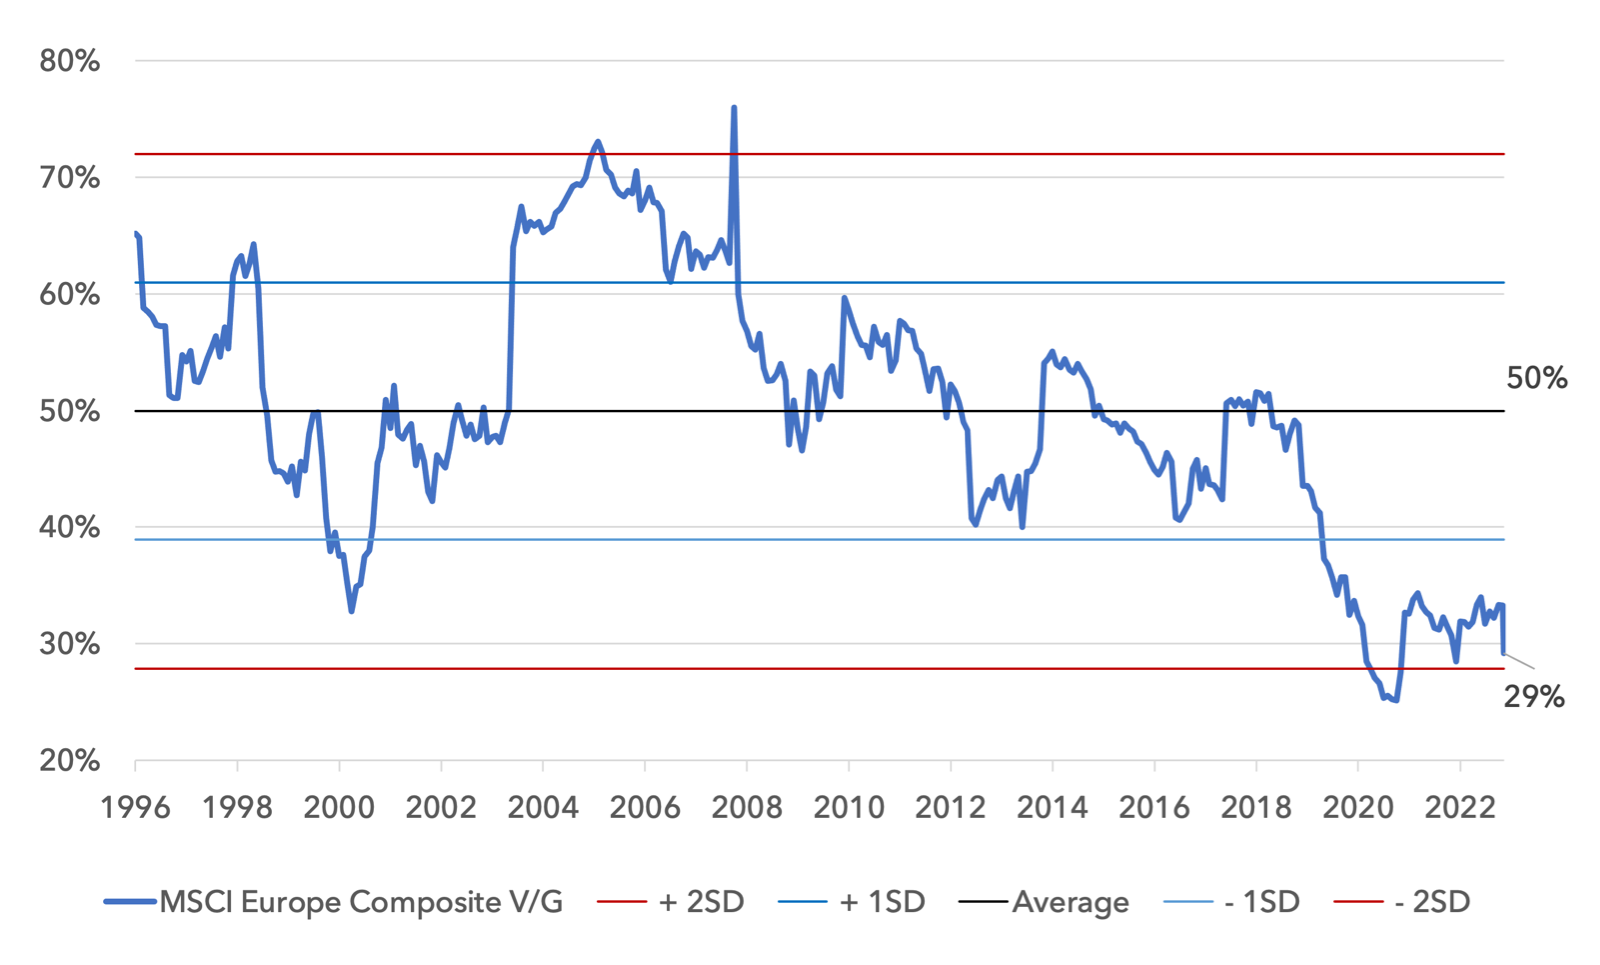
The European equity market remains polarised in valuation terms. European value is still at a large discount to European growth, despite outperforming for the last two years. The current reading is not far off the all-time low, at 29% vs the post-1995 average of 50%. A re-rating to the relative valuation average since 1995 would mean 70% further outperformance of value over growth. Given the fundamental picture, we believe the continued outperformance of cheaper value securities over expensive growth securities is likely.
MSCI Europe Composite Value / Growth 1995 – 2022
In our last note we highlighted near-record negative sentiment and fund flows in Europe. Europe is a consensus underweight. This is a tailwind for European equities that can assist forward returns. Europe and the Euro are also warrants on global growth. If the global economy, and in particular emerging markets, are experiencing tactical tailwinds, this may enable earnings growth to prove more resilient than expected over the coming months.
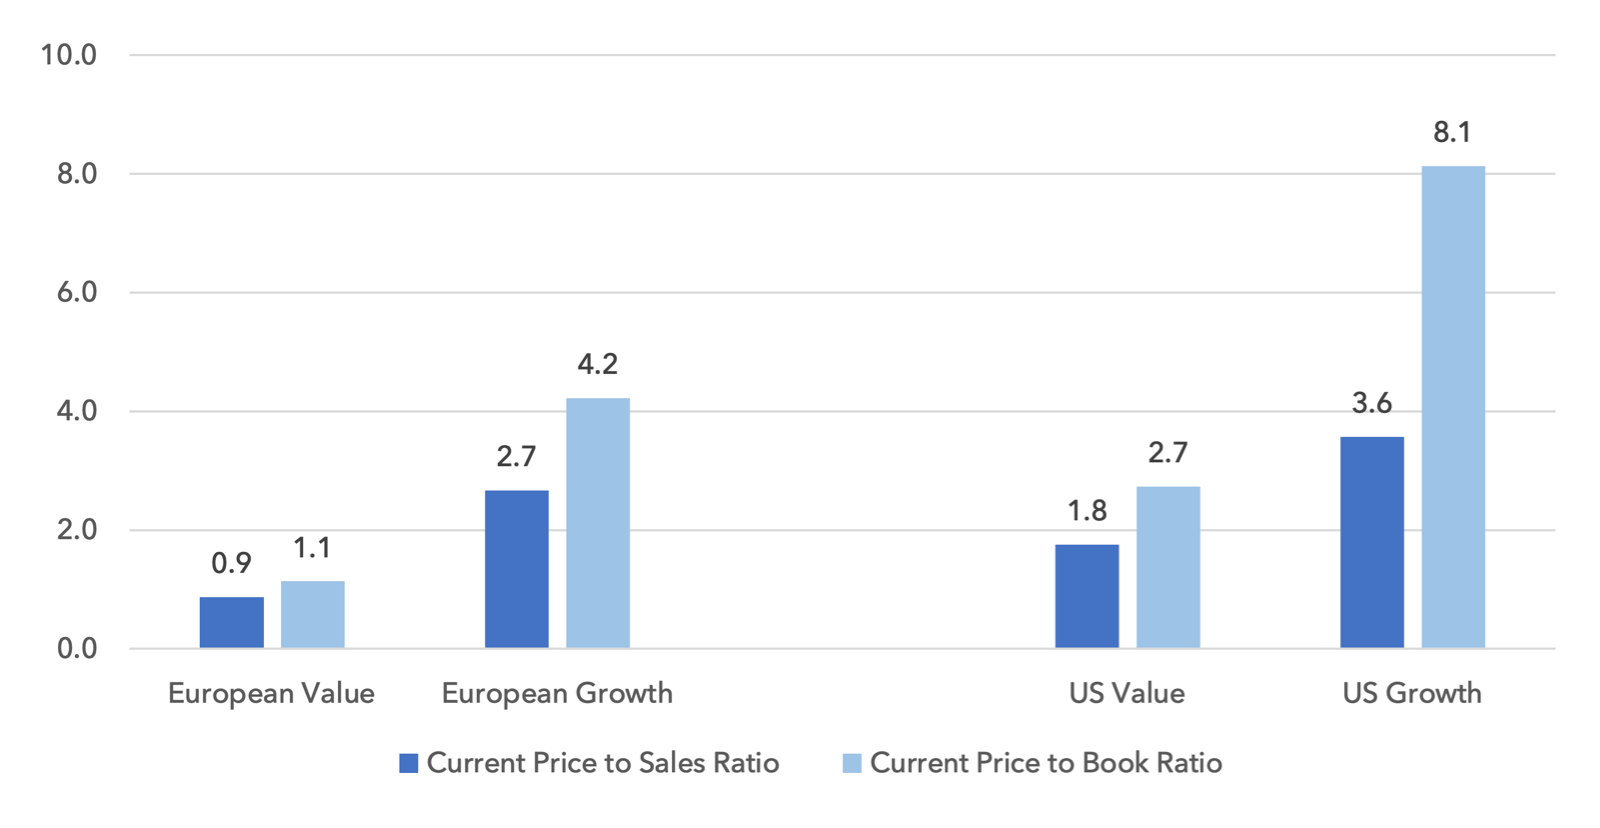
Europe also stands out in absolute valuation terms vs the US, with European value equities half the price of US value. In a market regime with valuation as a major force impacting returns, Europe has the potential to continue to outperform the US, as we have seen since the end of August.
Current Valuations for European & US Value & Growth Equities
Inflation and the market multiple
Whilst this all sounds constructive, we still see headwinds for 2023 index returns, like in 2022. Valuations of large parts of the equity market are still built on the principle that inflation and bond yields will fall back to 2% or lower in the medium term. European growth equities still trade at over 20x forward earnings with US growth equities at 23x. As the chart above shows, price to sales and price to book ratios are also elevated for growth equities. These valuation metrics are also expensive vs their post-1995 averages.
If inflation does not fall below 2% and bond yields do not fall back to similar levels, then large numbers of long-duration assets, particularly growth equities, are vulnerable to further price falls. We all know headline inflation is set to fall in the coming months for base effect reasons – the question is where it settles. Whilst we cannot be certain, we take the view that inflation is likely to settle at a level closer to 3-4% than 1-2%, for a number of reasons:
1. The rarity of 2% inflation
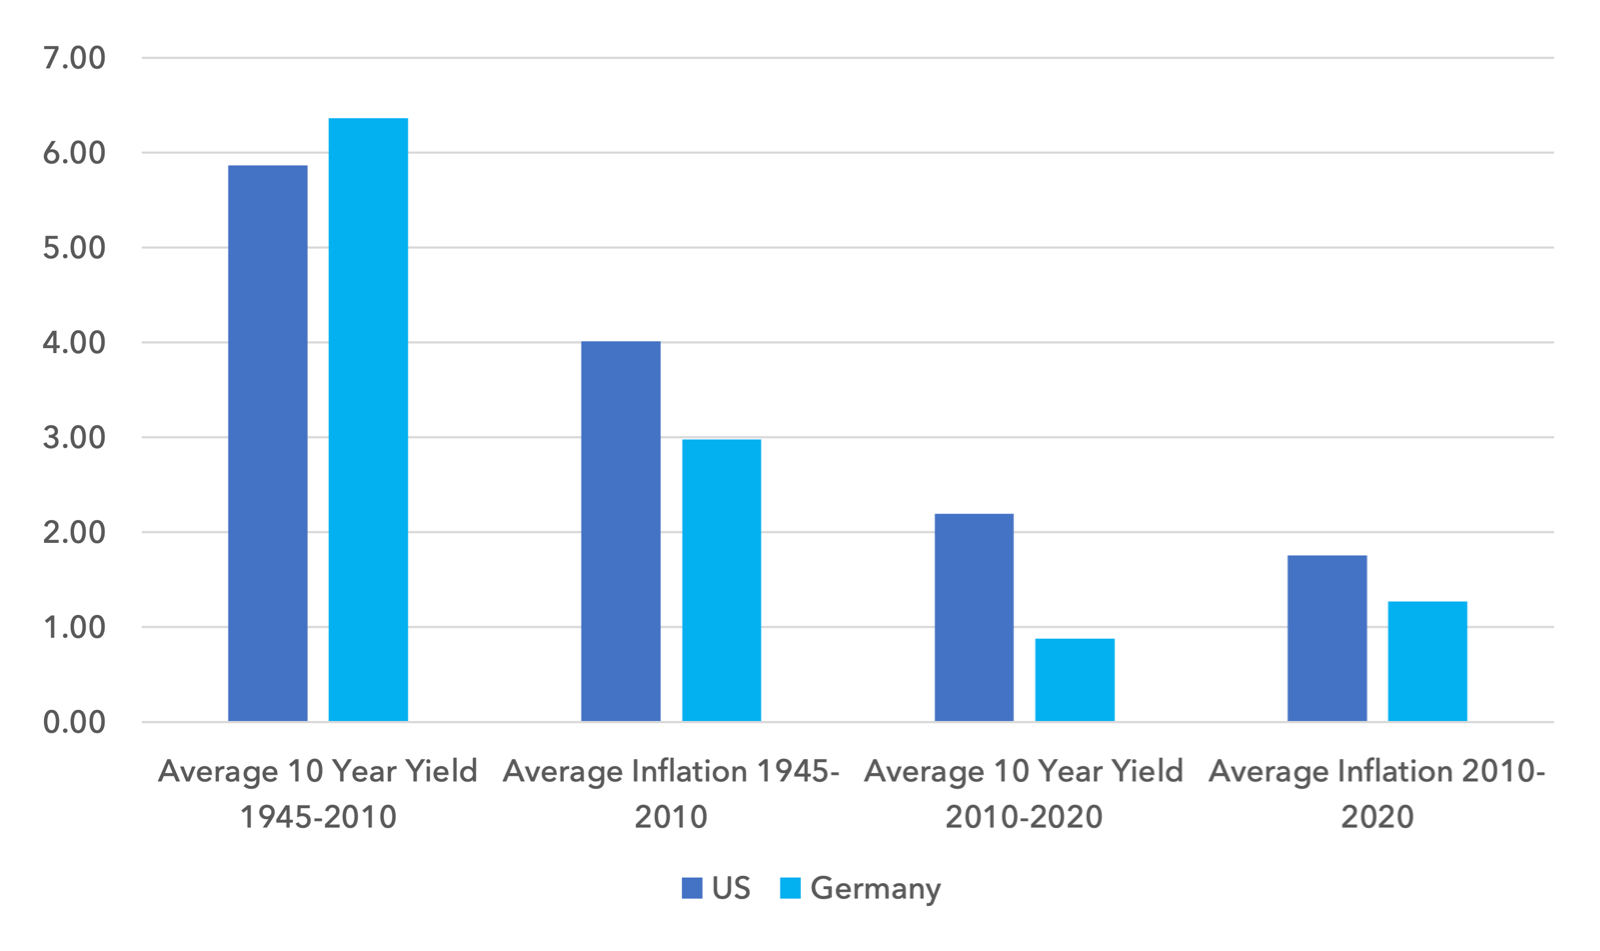
Sub 2% inflation is not common in the post war period. Between 1945 – 2010 Inflation has been 2% or lower for only short periods of time: a few years in the mid 1950’s, the early 1960’s, and a short time in the late 1990’s. The average inflation rate from 1945 – 2010 is 4% in the US and 3% in Germany. The decade from 2010 – 2020 is atypical both from an inflation and interest rate perspective.
What is the normal level of inflation and bond yields?
2. Demographics
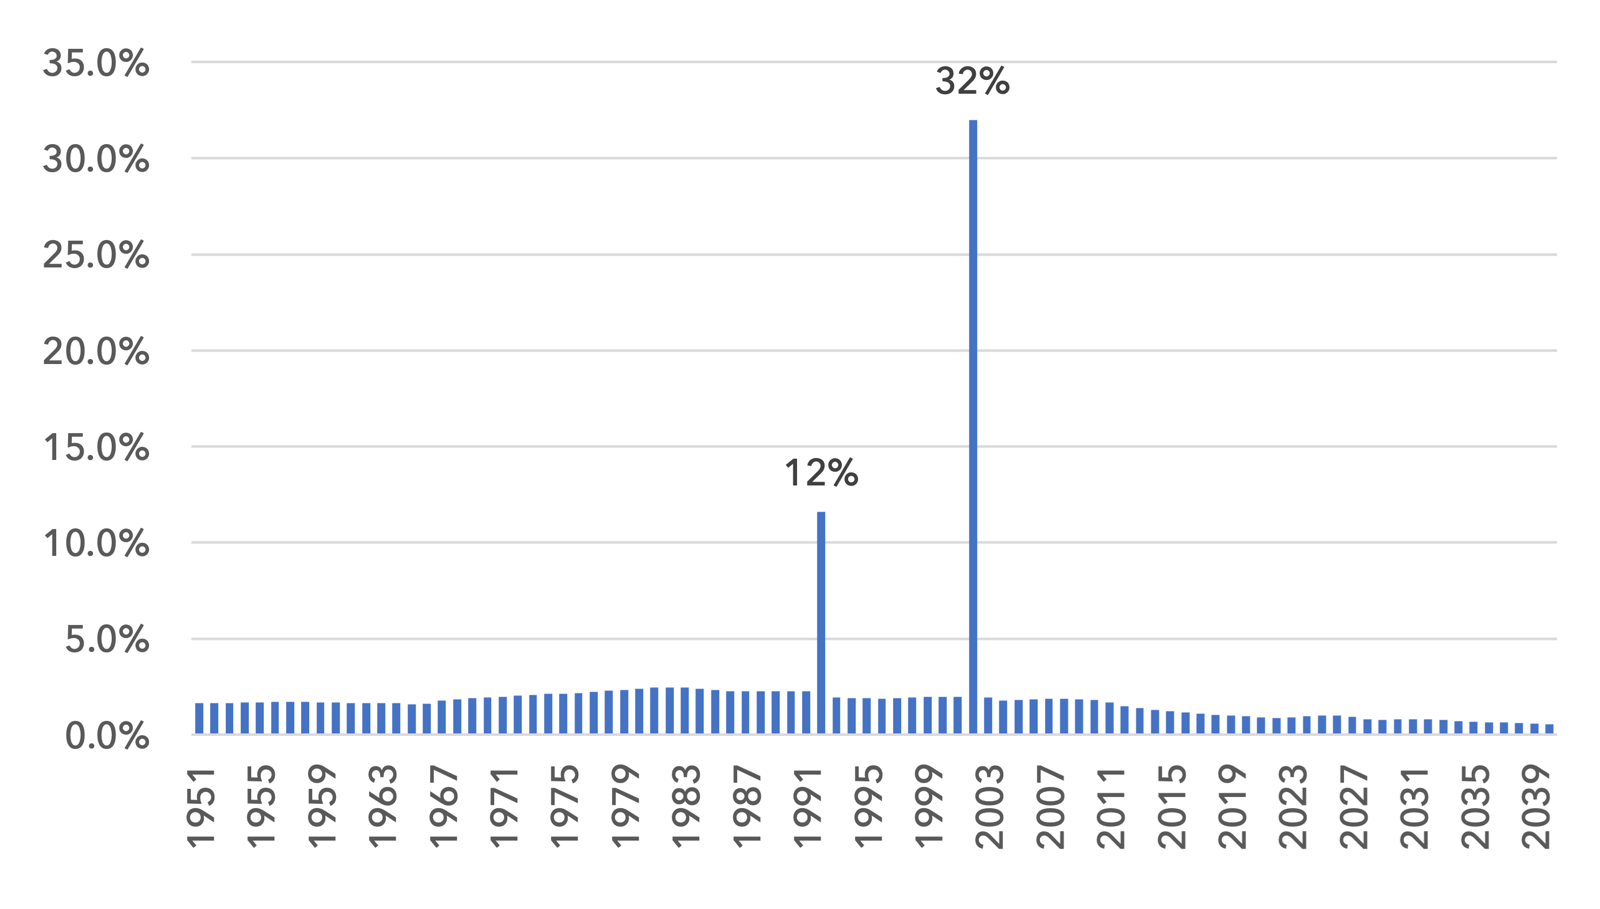
Demographics may have played a major role in the disinflationary period of the last two decades*. The fall of the Berlin Wall added 180m Eastern European workers to the world economy from 1992, representing a 12% increase of the world’s working age population. More significant still, China’s accession to the World Trade Organisation added 780m workers, a staggering 32% increase in the supply of workers to the global economy. Below we show the annual change in the world’s working age population from 1950, with Eastern Europe added in 1992 and China added in 2002. The suddenness and scale of this surge in labour supply is unprecedented in economic history. We show this history with forecasts out to 2040 using the United Nations Population Database.
World Working Age Population Annual Growth in % with Eastern Europe added from 1992 & China from 2002
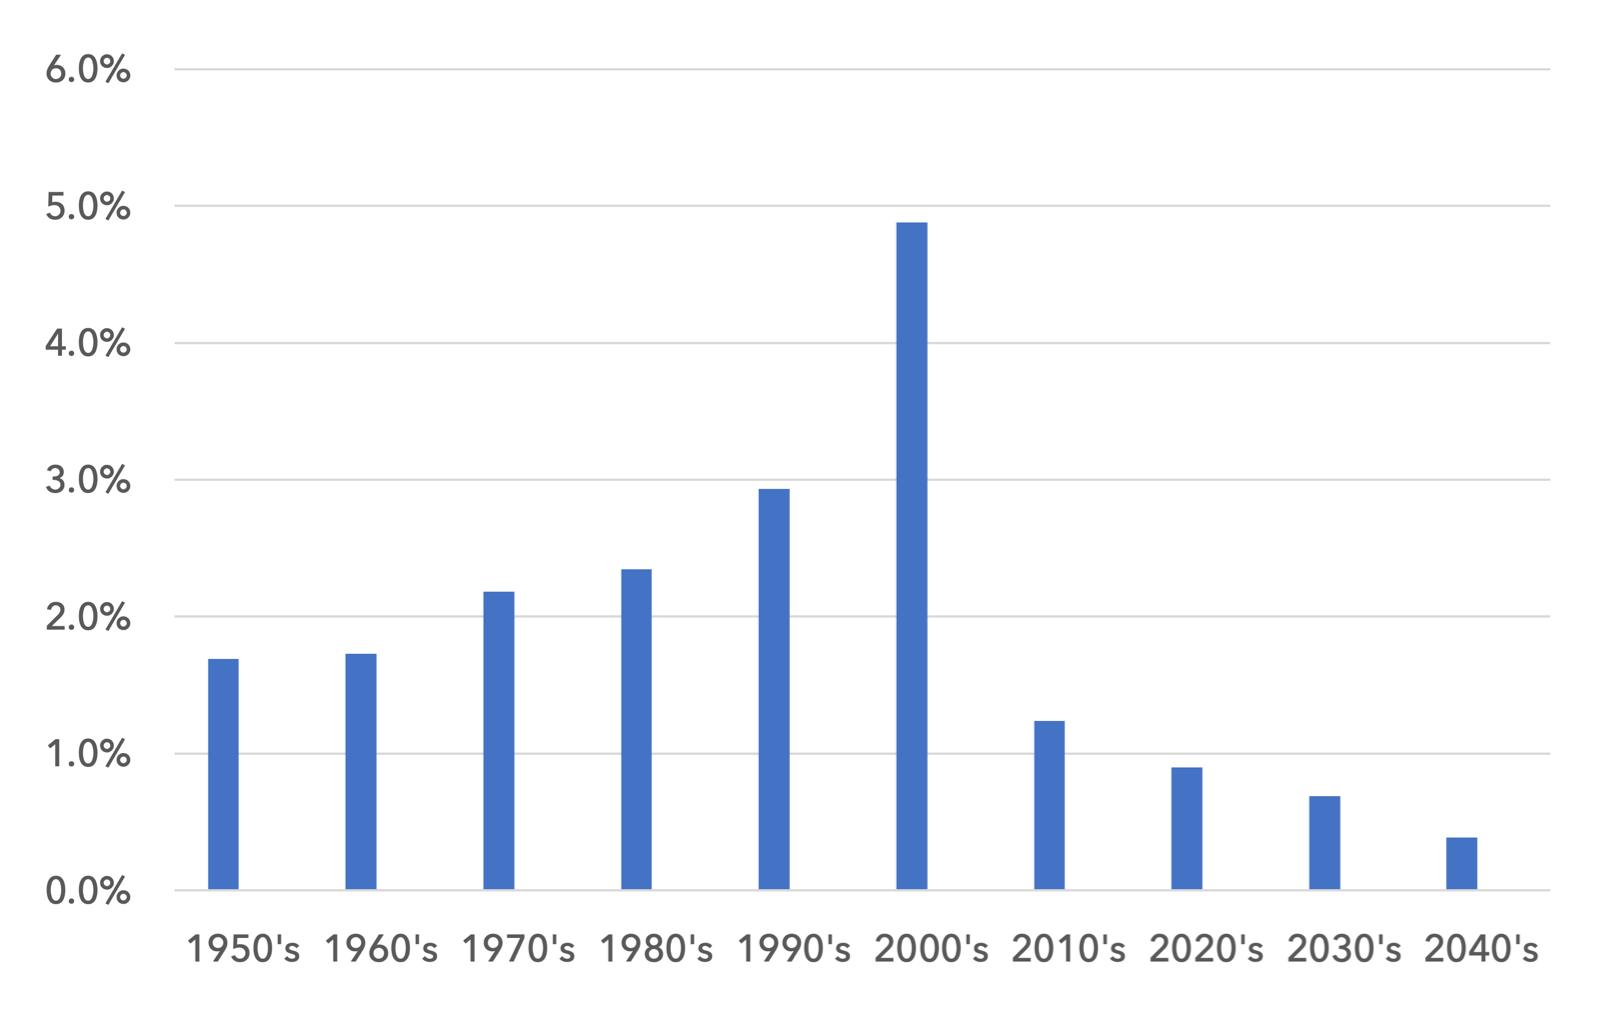
Even when these additions to the working age population are smoothed out by decade, as we show in the chart below, you can see that the 1990’s and 2000’s were outliers in the post-war period. Prior to this, the average annual growth in the world’s working age population was between 1.7% – 2.3%. This compares to nearly 5% in the 2000’s. This surge in labour supply was likely integral in the sharp drop in labour’s pricing power in the ensuing two decades, helping to create deflation and negative real wage growth.
This also helps to explain the depth of Japan’s deflationary experience over the last two and a half decades. From 1970 – 1990 Japan’s inflation averaged 5.6%, in line with many developed world economies. But as an open economy with a strong manufacturing base in East Asia, it was uniquely sensitive to the deflationary impact of China’s 780m workers integrating into the world economy.
What is also noticeable in the data is the sharp drop in the growth rate of the world’s working age population in the current decade. The 2020’s are seeing the lowest working age population growth of any time in the post war period. Labour supply growth has never been this tight before and gets tighter over the coming two decades.
World Working Age Population Annual Growth in % By Decade with Eastern Europe added from 1992 & China from 2002
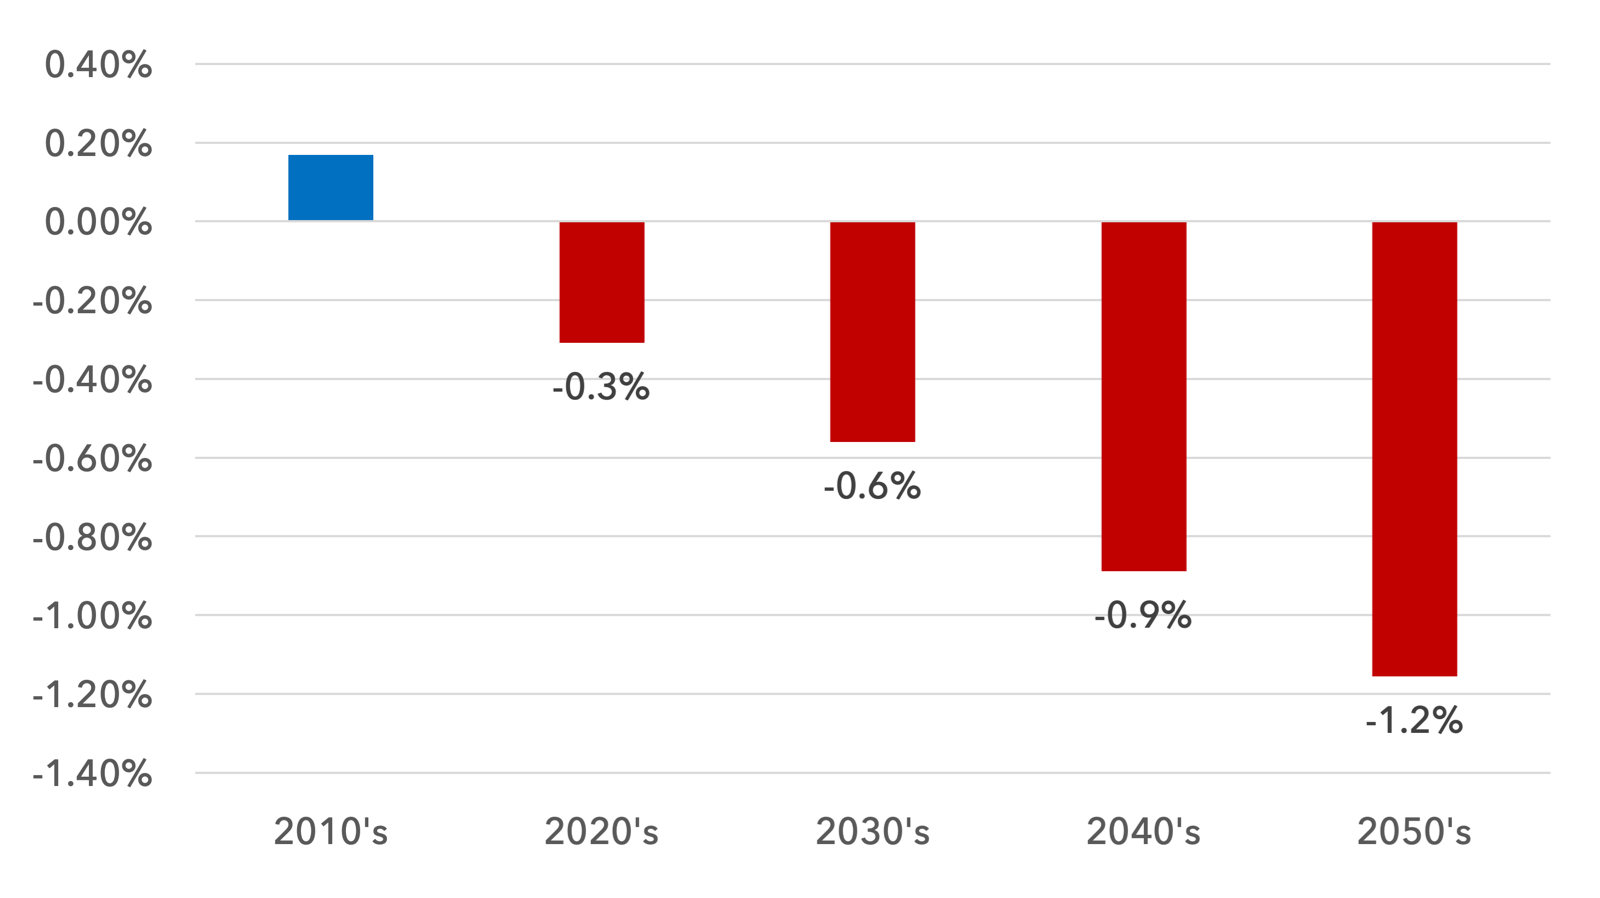
The chart above uses forecasts for the entire planet’s working age population. If we focus simply on the sum of Europe, North America and China, the demographic picture in the coming decades is weaker, with outright declines in the working age population already in place. Recent drops in the participation rate have further tightened this supply picture.
The recent increase in strike action across the developed world is not only a response to the cost of living crisis, but also likely stems from a general sense of worker confidence that comes from labour shortages. Strikes are likely to have more success this decade than in the last two decades.
Working Age Population Annual Growth by Decade for Europe, North America and China to 2060
3. Globalisation in partial reverse.
In May this year we wrote about a new geopolitical alignment taking shape between democracies and autocracies. We highlighted the potential inflationary impact of these developments. Since that note, legislation like the CHIPS Act has been passed and more US companies are looking to bring supply chains closer to home. It is too early to make a judgement on the impact of these developments on prices. But what is more clear is that the deflationary impact of the aggressive offshoring of the last two decades has likely run its course. Companies can no longer make investment decisions purely on cost. Other incentives, be they security of supply, a nation’s geopolitical alignment, or ESG considerations, can all trump cost considerations. All of these elements are likely inflationary at the margin.
4. The ESG transition
The movement to a low carbon economy is enormously expensive and resource intensive. Many basic resources have seen low levels of investment over the last decade and are supply constrained. Commodities could see structurally higher prices for some years. As the building blocks of the economy, higher raw material prices could drive higher inflation. If we are moving into a supply constrained world, even limited amounts of real economic growth could trigger inflation, on a repeated basis.
5. The political imperative: do governments want ≤ 2% inflation?
It may be possible to bring inflation down to 3-4% without a significant rise in unemployment. But to get inflation down to 2% may require more aggressive action, with most economists seeing the need for a recession and a sharp increase in unemployment. Over the course of 2023 this trade-off, between the 2% inflation target and the unemployment rate, will come into sharp relief. If inflation has settled at 3-4%, there will be many arguing that maintaining millions in work and tolerating 3-4% inflation will be a superior option than putting millions out of work and the 2% inflation target being reached. Society will have to debate these two priorities. Common sense suggests the former argument may win out.
High government debt levels may also need a period of inflation. One of the most effective ways to manage debt burdens is through higher inflation, as long as bond yields are below nominal GDP growth. Deflation would be extremely destructive for government debt sustainability over the long term. If the broad conditions of the last year remain, where nominal GDP growth is well above bond yields, debt to GDP levels can decline, potentially quite quickly.
For both of these reasons, it may not be in the interests of governments to push inflation to target.
These five arguments lead us in the direction of assuming that inflation settles at a higher rate than in the 2010 – 2020 period. Quite how high is hard to judge, but perhaps somewhere near the average inflation rate from 1945 – 2010, namely somewhere between the 4% average in the US and the 3% average in Germany. If this is correct, it is significant for asset allocation. Many market prices, particularly expensive long duration assets, are still built on the principle that inflation and interest rates will return to the levels of the last decade, with inflation ≤ 2% and near-zero interest rates.
Low inflation means low nominal GDP growth. In a low nominal growth world, earnings growth is scarce, and so the handful of companies delivering that growth merit a premium. But when nominal GDP is higher, earnings growth tends to be more prevalent. If a variety of companies are delivering reasonable earnings growth, there is no logic in paying high prices for it if the same earnings growth is available at much cheaper valuations. This has been the story of the last two years and most of the last century.
We believe 2023 will be similar to 2022. Whilst conditions may be challenging for the index, it does not mean positive absolute returns are out of reach for certain European equity market strategies. We remain confident that the Lightman European funds can deliver positive absolute and relative returns in 2023.
Sources:
* The Great Demographic Reversal, Charles Goodhart, Manoj Pradhan. United Nations, MSCI, Bloomberg, Lightman Investment Management.
Legal
Disclaimer
This communication and its content are owned by Lightman Investment Management Limited (“Lightman”, “we”, “us”). Lightman Investment Management Limited (FRN: 827120) is authorised and regulated by the Financial Conduct Authority (“FCA”) as a UK MiFID portfolio manager eligible to deal with professional clients and eligible counterparties in the UK. Lightman is registered with Companies House in England and Wales under the registration number 11647387, having its registered office at c/o Buzzacott LLP, 130 Wood Street, London, United Kingdom, EC2V 6DL.
Target audience
This communication is intended for ‘Eligible Counterparties’ and ‘Professional’ clients only, as described under the UK Financial Services and Markets Act 2000 (“FSMA”) (and any amendments to it). It is not intended for ‘Retail’ clients and Lightman does not have permission to provide investment services to retail clients. Generally, marketing communications are only intended for ‘Eligible Counterparties’ and ‘Professional’ clients in the UK, unless they are being used for purposes other than marketing, such as regulations and compliance etc. The Firm may produce marketing or communication documents for selected investor types in non UK jurisdictions. Such documents would clearly state the target audience and target jurisdiction.
Collective Investment Scheme(s)
The collective investment scheme(s) – WS Lightman Investment Funds (PRN: 838695) (“UK OEIC”, “UK umbrella”), and WS Lightman European Fund (PRN: 838696) (“UK sub-fund”, “UK product”) are regulated collective scheme(s), authorised and regulated by the FCA. In accordance with Section 238 of FSMA, such schemes can be marketed to the UK general public. Lightman, however, does not intend to receive subscription or redemption orders from retail clients and accordingly such retail clients should either contact their investment adviser or the Management Company Waystone Management (UK) Limited (“Waystone UK”) in relation to any fund documents.
The collective investment scheme(s) - Elevation Fund SICAV (Code: O00012482) (“Luxembourg SICAV”, “Luxembourg umbrella”), and Lightman European Equities Fund (Code: O00012482_00000002) (“Luxembourg sub-fund”, “Lux product”) are regulated undertakings for collective investments in transferrable securities (UCITS), authorised and regulated by the Commission de Surveillance du Secteur Financier (CSSF) in Luxembourg. In accordance with regulatory approvals obtained under the requirements of the Law of 17 December 2010 relating to undertakings for collective investment, the schemes can be marketed to the public in Luxembourg, Norway, Spain, and Republic of Ireland. Lightman, however, does not intend to receive subscription or redemption orders from any client types for the Lux product and accordingly such client should either contact a domestic distributor, domestic investment advisor or the Management Company Link Fund Solutions (Luxembourg) S.A. (“Link Luxembourg”) in relation to any fund documents.
Luxembourg umbrella and Luxembourg sub-fund are also approved for marketing to professional clients and eligible counterparties in the UK under the UK National Private Placement Regime (NPPR). UK registration numbers for the funds are as follows: Elevation Fund SICAV (PRN: 957838) and Lightman European Equities Fund (PRN: 957839). Please write to us at compliance@lightmanfunds.com for proof of UK registration of the funds.
Luxembourg sub-fund is also approved for marketing to qualified investors in Switzerland, within the meaning of Art. 10 para. 3 and 3ter CISA. In Switzerland, the representative is Acolin Fund Services AG, Leutschenbachstrasse 50, 8050 Zurich, Switzerland, whilst the paying agent is NPB Neue Privat Bank AG, Limmatquai 1 / am Bellevue, 8024 Zurich, Switzerland.
Accuracy and correctness of information
Lightman takes all reasonable steps to ensure the accuracy and completeness of its communications; we however request all recipients to contact us directly for the latest information and documents as issued documents may not be fully updated. We cannot accept any liability arising from loss or damage from the use of this communication.
Wherever our communications refer to a third party such as Waystone, Link, Northern Trust etc., we cannot accept any responsibility for the availability of their services or the accuracy and correctness of their content. We urge users to contact the third party for any query related to their services.
Important information for non-UK persons (Including US persons)
This communication is not intended for any person outside of the UK, Switzerland, or the European Economic Area (EEA). Lightman or any of the funds referenced in this communication are not approved for marketing outside of the UK, Switzerland, or the EEA. All such persons must consult their domestic lawyers in relation to services or products offered by Lightman.
Risk warning to all investors
The value of investments in any financial assets may fall as well as rise. Investors may not get back the amount they originally invested. Past performance is not an indicator of future performance. Potential investors should not use this communication as the basis of an investment decision. Decisions to invest in any fund should be taken only on the basis of information available in the latest fund documents. Potential investors should carefully consider the risks described in those documents and, if required, consult a financial adviser before deciding to invest.
Offer, advice, or recommendation
No information in this communication is intended to act as an offer, investment advice or recommendation to buy or sell a product or to engage in investment services or activities. You must consult your investment adviser or a lawyer before engaging in any investment service or product.
GDPR
Lightman may process personal information of persons using this communication. Please read our privacy policy.
Copyright
This communication cannot be distributed or reproduced without our consent.