
It sounds radically contrarian to anticipate a rise in yields. Recession is expected, inflation is forecast to decline further and so bond yields ought to fall. Certainly the case for higher yields is not clear cut, but investor expectations appear committed to lower rates, setting up an asymmetry in the risk profile of asset prices. Falling yields appear to be discounted, but rising yields are not.
This sets the scene for another round of multiple compression for expensive equities, raising risks for parts of the equity market.
There are three broad reasons why yields could rise, in no particular order:
- The economy stays more resilient than expected, meaning investors remove forecast rate cuts
- Inflation does not fall as much as anticipated and remains above target
- Debt sustainability concerns and Treasury supply and demand factors, catalysed by the pending debt ceiling debate, permeate Sovereign bond markets and drive up the term premium
Before discussing the possible drivers of higher yields, it is worth assessing investor expectations and recent valuation changes. At the time of writing, the market sees the Fed cutting rates by 75bps before the end of the year and by more than 200bps over 3 years. This expectation has helped push up the price of Treasuries over the last 6 months with the long end of the curve down 100bps.
Treasury Positioning
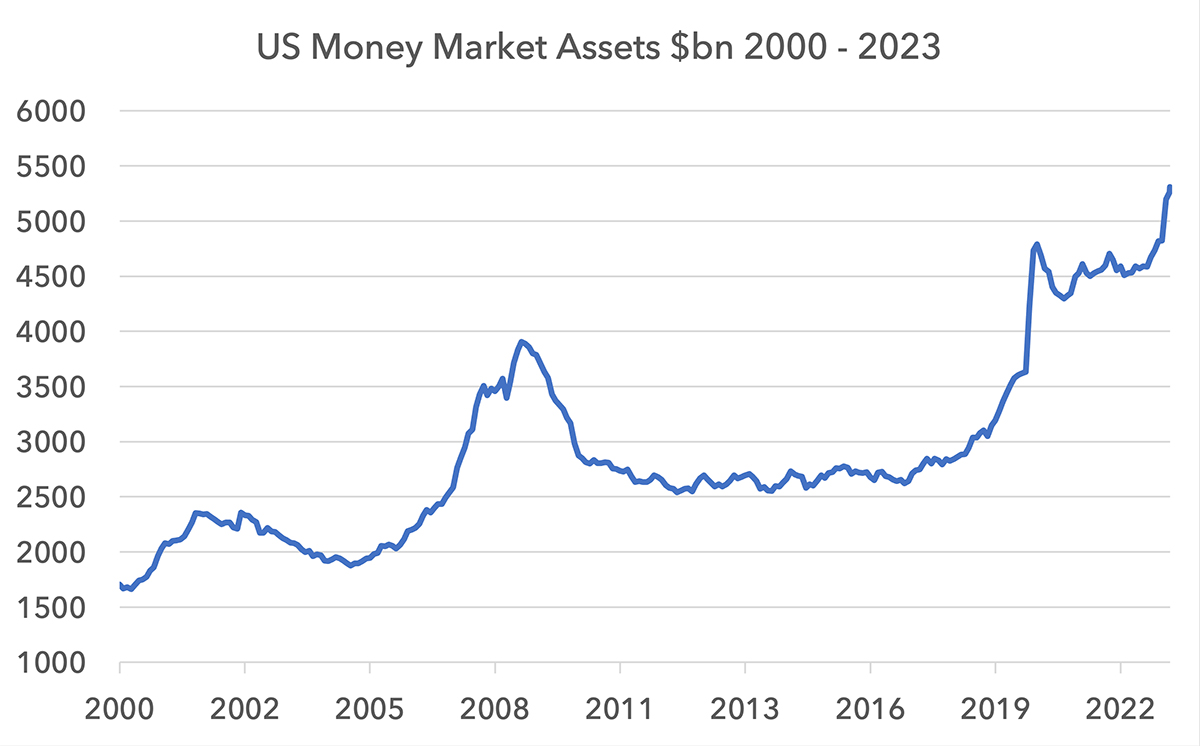
Investors have poured money into Treasuries and Treasury-like products. US Money Market funds have seen inflows of $725bn since October 2022.
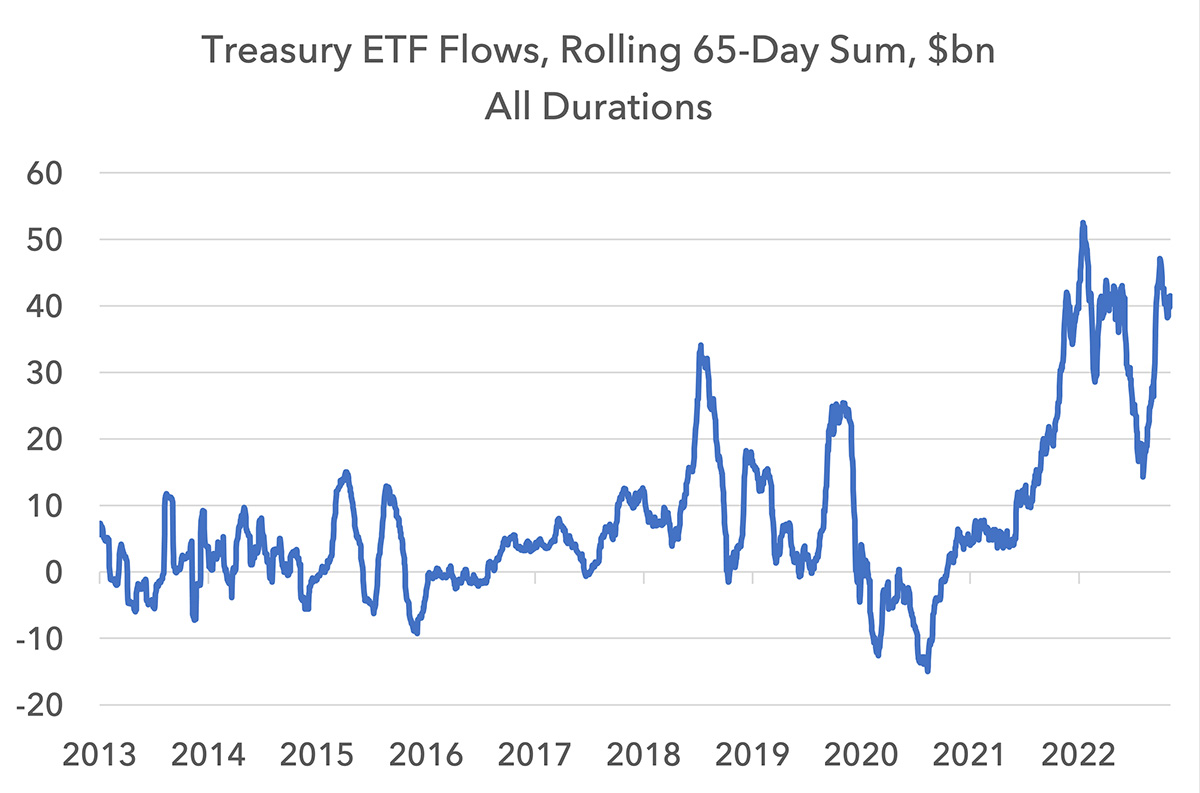
If we look at a rolling 65-day sum of flows into Treasury ETF products we also see historically high inflows.
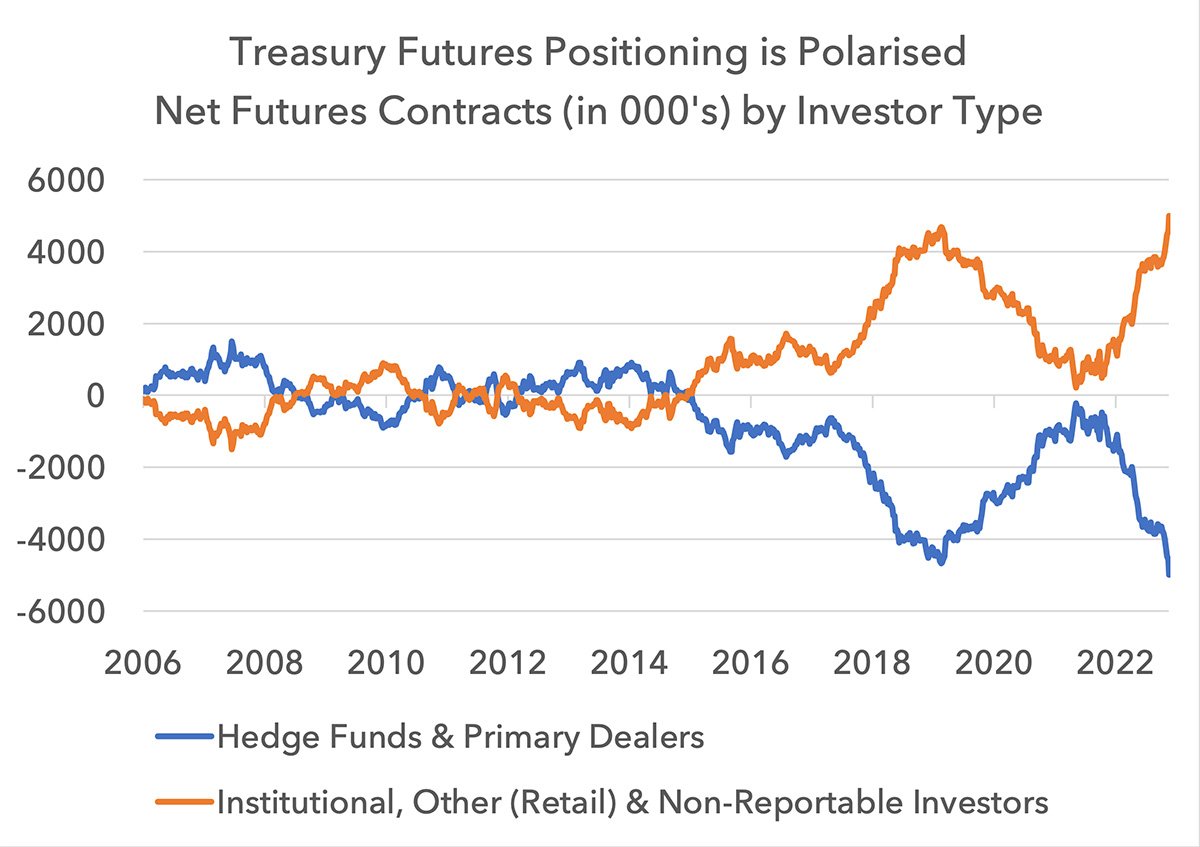
In Treasury Futures, the sum of all investor positions must always net out to zero. The Commodity Futures Trading Commission aggregates this data by investor category in its Commitment of Traders Report. Today we see a large long position from Institutional, Retail and Non-Reportable Investors, compared to a large short position from Hedge Funds and Primary Dealers. There is limited predictive power in this data and no investor category has the monopoly on being right. But it is worth knowing that real money institutional investors and retail investors appear to be long Treasuries in both cash markets and in futures. There is also a question mark over the mechanics of the Hedge Fund short position. Short positions may be hedged as part of basis trades where futures are taken against long positions in cash Treasuries to arbitrage price differences. If this were the case, this would understate the actual long bias in Treasuries.
Either way, Treasury futures’ market positioning is polarised today, which may increase volatility.
The institutional overweight to bonds is corroborated by the Bank of America April 2023 Fund Manager Survey. This showed the largest overweight to bonds since March 2009.
Equity valuation changes
Equities have benefitted from the decline in bond yields over the last 6 months, with certain sectors benefitting more than others.
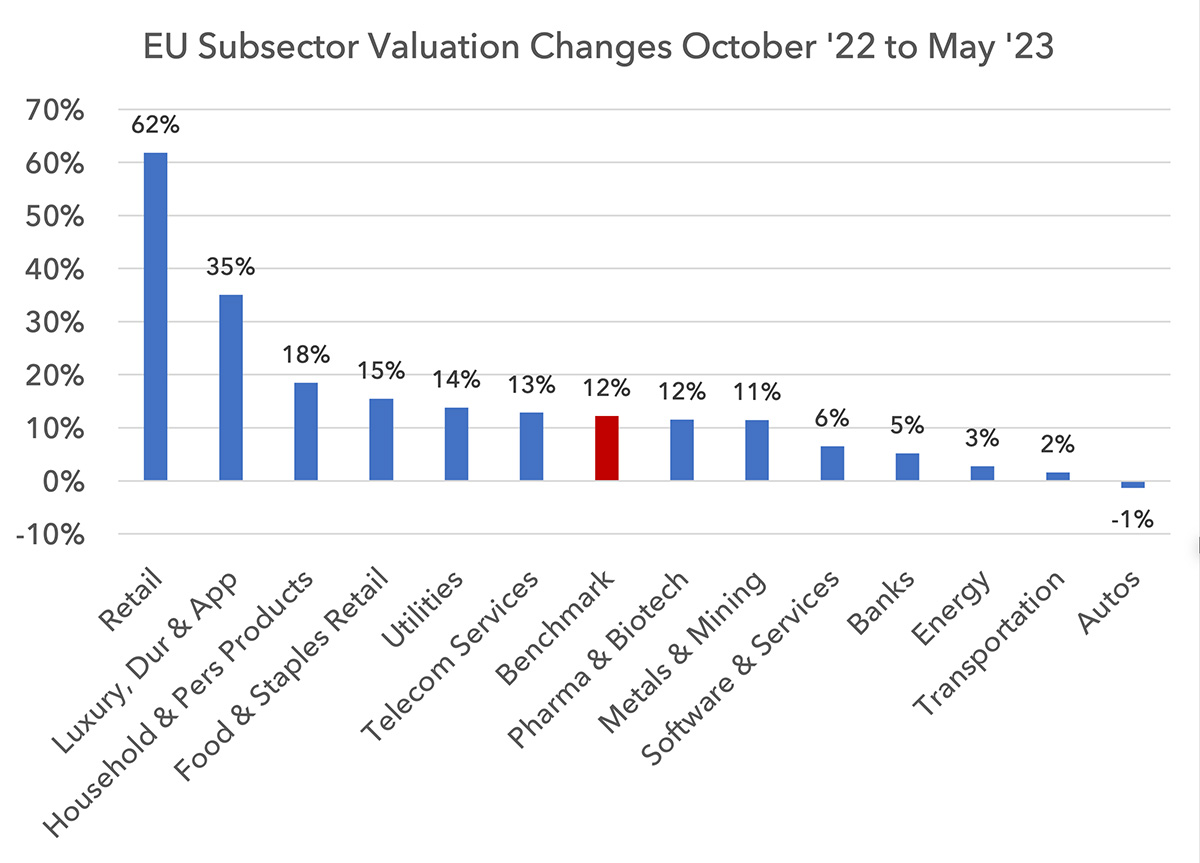
Below we use the median percentage change of a combination of price to earnings, price to book, price to cash earnings and the dividend yield. The index has re-rated by 12% in recent months, but consumer-facing sectors (excluding autos) have re-rated by much more. Defensive sectors have also re-rated versus more-cyclical sectors, as could be expected given recession fears.
Long-term valuation status
Where does this leave longer-term valuations? Below we show a chart of European sub-sector valuations. This includes both absolute valuations and valuations versus history. The top right of the chart is expensive on both counts, the bottom left is cheap on both counts.
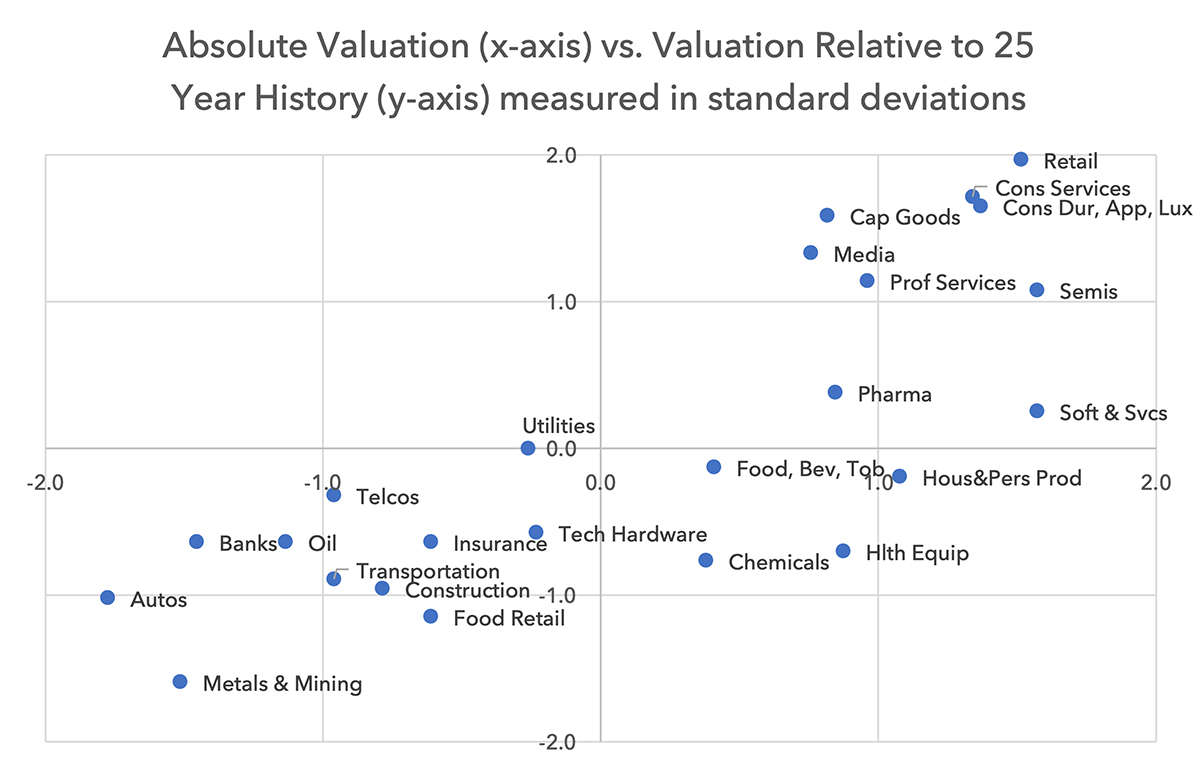
Metals & Mining, Oil and Telecoms, three of our large overweights, stand out positively on both valuation metrics. Banks and Autos are also cheap on this basis. But we believe Autos may have over-earned in recent years and we have concerns about increasing competition and declining affordability. Our caution over future profitability leads us to view the sector as a potential value trap for now, but there is no doubt that if the sector’s operational performance can be maintained, valuations will rise. With Banks we reduced our exposure significantly earlier this year as discussed in an update published in March. Banks are in an extreme special situation and we will discuss them further below.
Outside of Autos, consumer-facing sectors are expensive. Retail and Luxury are high conviction underweights. Investors have re-rated these companies on the basis of lower interest rates and lower energy prices – two elements that may not materialise – and valuations are very high. If rates and the oil price do not fall further, we could see significant underperformance from parts of the Discretionary sector. We view Oil as being more defensive this cycle and a resilient oil price should start to constrain valuations in consumer-facing companies. Industrials (excluding Transportation) are also screening expensively, as are Semiconductors.
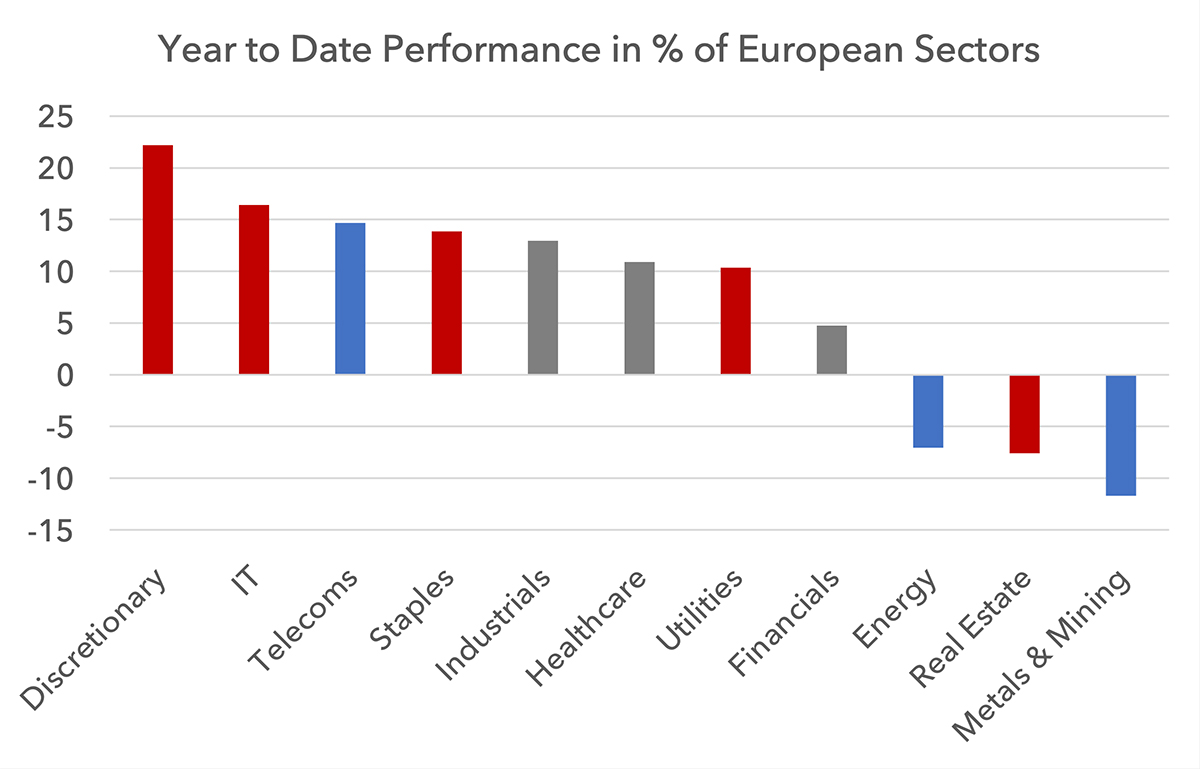
Year-to-date this outlook has not paid well in performance terms. Below we show year-to-date performance of the major European sectors in percentage change terms, with the Metals & Mining sub-sector broken out. We are underweight those sectors in red, overweight those in blue, and neutral to lightly underweight those in grey. The fund’s asset allocation in the first five months of the year has been poor, but we expect performance to improve.
The case for higher yields
1) A more resilient economy
Every day that the economy is resilient is a surprise to most investors. Given that rates have moved up over the last year at the fastest pace in 40 years, recession-like conditions are expected to arrive at any moment. But unlike previous cycles, western economies do not suffer from major imbalances. Most industries have not seen the kind of over-investment that can lead to a severe bust. In fact, underinvestment is prevalent. We have spoken about this in the context of commodities, but it is also prominent in other industries like housing.
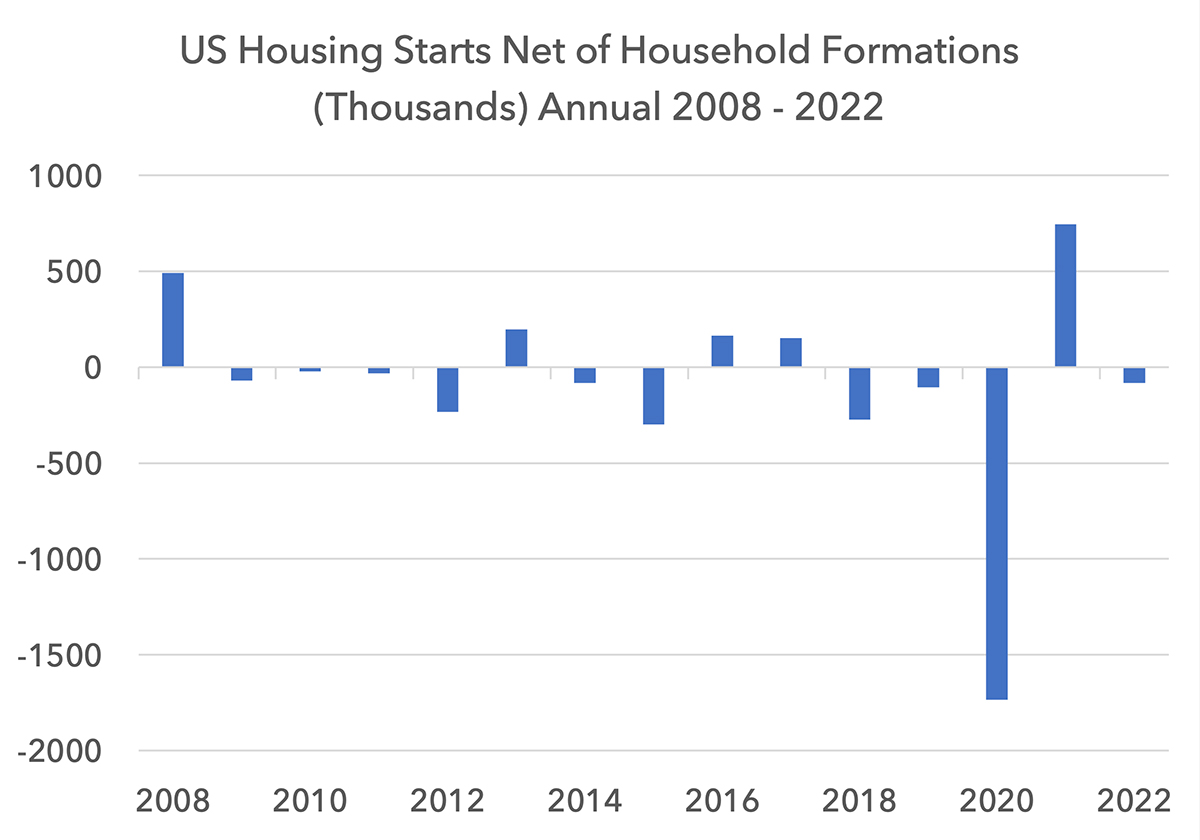
Housing
Housing starts have been running below household formation in the US for 10 of the last 14 years. In the UK and Europe we have experienced similar under-supply.
We recently listened to a US housing call run by a specialist research firm called John Burns Research & Consulting. They perform surveys, channel checks and fundamental research for all elements of the US housebuilding process, from land to zoning to demographics to raw materials and financing. The message was unequivocal: as of now, US homebuilding is accelerating. Large US housebuilders are able to provide their own financing for mortgages at below market rates and the recent regional bank problems have not impacted the new-build market so far.
Given that over 90% of US mortgages are fixed rate, the majority of home owners have not felt the interest rate squeeze. Given housing contributes 15-18% of GDP, a resilient housing market is an important support for the economy in the short term.
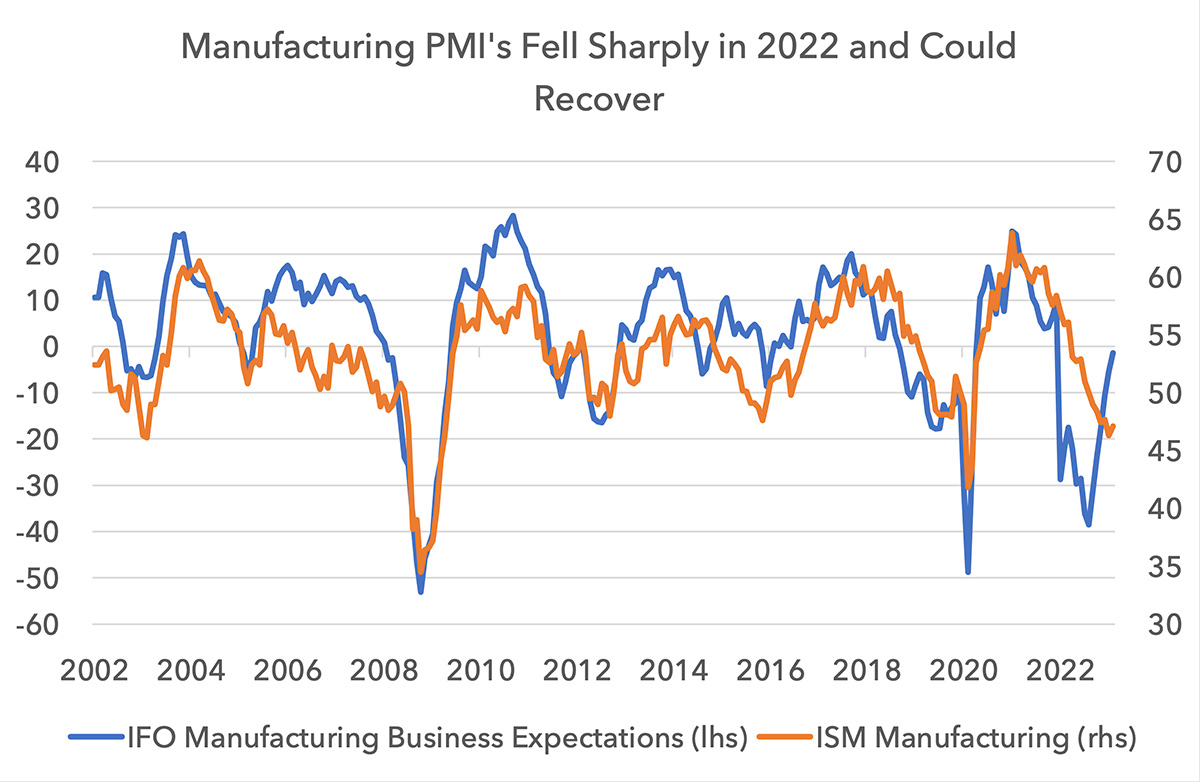
Manufacturing turning up
Because recession fears rose sharply in the summer of 2022, manufacturing businesses started to reduce production and cut inventories. Manufacturing PMI’s turned down sharply in 2022, falling by similar amounts to past recessions. As recession has not yet materialised, with inventories low, PMIs have started to rise.
Whilst China’s reopening has been priced into consumer stocks this year, the evidence of its industrial reopening has been more tentative. But European management commentary during Q1 earnings calls in recent days has started to suggest the Chinese industrial reopening is gaining momentum in the second quarter. We should not rule out the possibility of global manufacturing PMI’s turning up further in the coming months as China’s recovery broadens.
Income from savings has risen sharply
We noted the $725bn increase in money market assets in recent months, bringing AUM towards $5.5 trillion. Given the sharp increase in interest rates, these funds can now provide consumers and corporates with $20bn of interest income per month, compared to negligible amounts just 2 years ago. This extra income amounts to 1% of GDP.
2) Inflation does not fall as much as anticipated
We have already written about the longer-term outlook for inflation. Our argument was built on five ideas: the rarity of sub 2% inflation; changing demographics adding pricing power to labour; globalisation in partial reverse; the ESG transition; and the political imperative – namely do governments actually want inflation back to 2%. Each of these arguments makes the case that it is unlikely for us to return to the ultra-low inflation of the 2010 – 2020 period.
Today, inflation swaps are discounting longer-term inflation expectations of 2.5% in Europe and the US. Asset prices reflect the expectation that inflation will reach that level. In order to see more incremental gains from long duration assets, inflation needs to fall below that 2.5% number.
Below we show US equity valuations by inflation tranche with the current reading in red. In the post-war period, the level of inflation that generates the highest multiple is 0-2% and as inflation goes higher, the multiple tends to contract. Today the trailing multiple is 18.5x, suggesting an optimal level of inflation is already discounted.
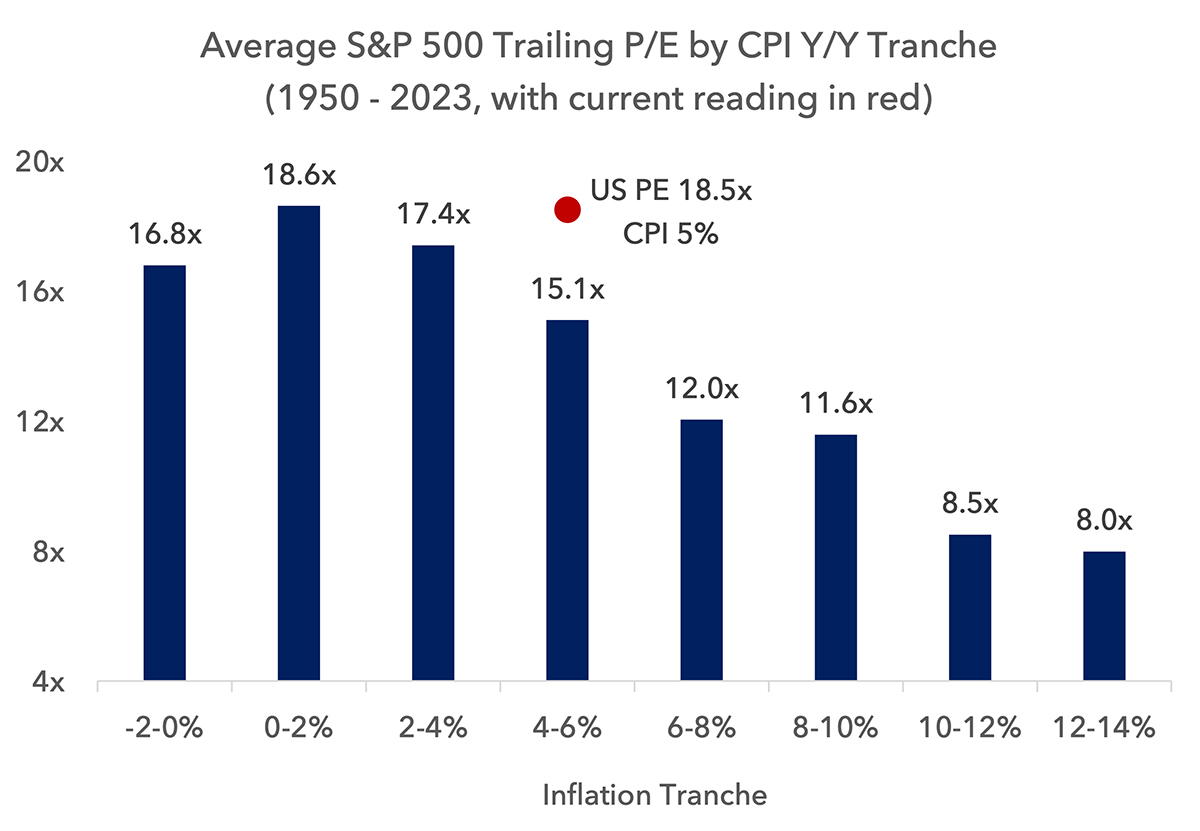
Like rates, the implication here is of an asymmetric risk profile. The surprise can only be if inflation does not fall. Asset prices have limited to zero upside if inflation falls, but significant downside if it does not.
3) Debt sustainability concerns pushing up bond yields
Unsustainable levels of Government borrowing
During the financial crisis, numerous commentators flagged sovereign debt sustainability concerns as governments had to borrow to offset and solve the financial crisis. Outside of peripheral Europe’s crisis of 2011-2012 these wider concerns did not materialise. Many believe it is close to impossible for the US government to have debt sustainability issues but this risk can no longer be ruled out.
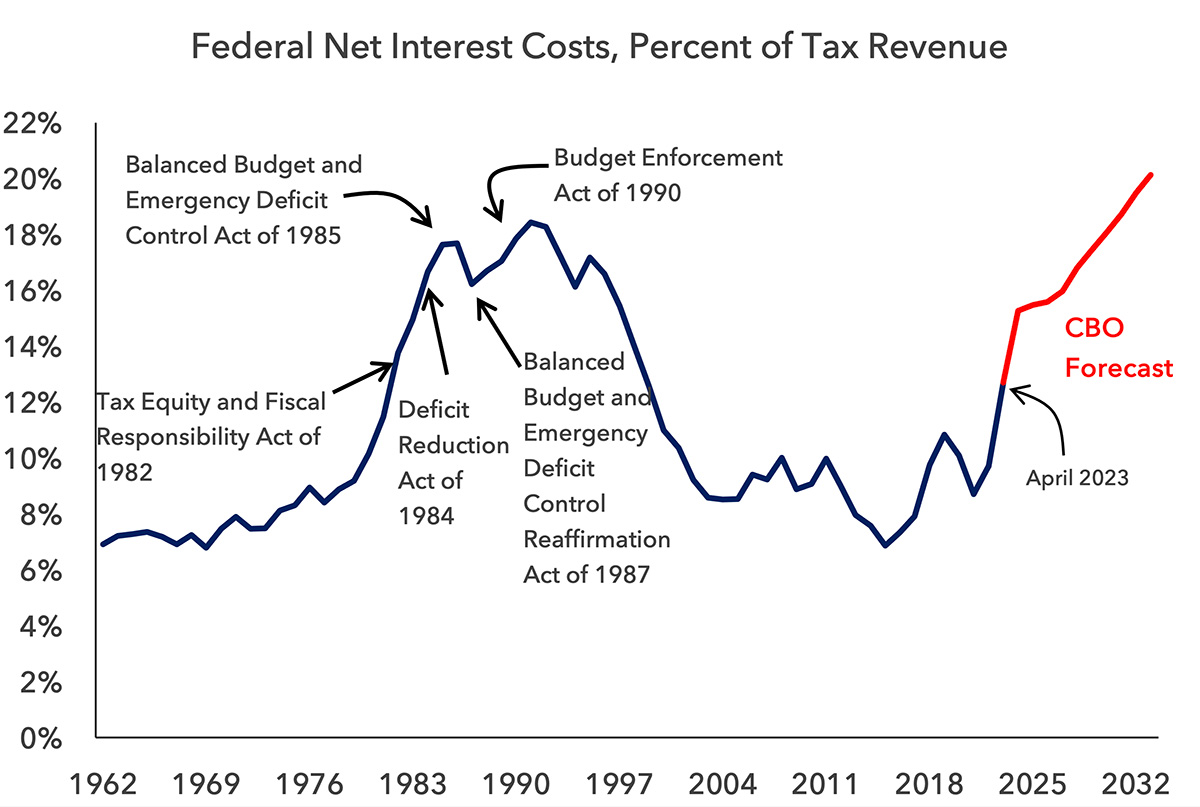
Below we show a chart that was put together by Strategas’s Washington Policy Team. It shows Federal net interest costs as a percentage of tax revenue. The forecast in red incorporates the Congressional Budget Office’s best estimate of government spending. This estimate is based on long-term interest rates of only 3.3% in 2030. If rates were to rise above this, costs would jump higher. Today, interest costs are already approaching 13% of tax revenue. This has jumped from 7% in 2016.
The chart annotations show deficit control legislation that was passed the last time interest costs were high. The argument here is that when interest costs reach c.13-14% of tax revenue, the bond market starts to pressurise the government. “Bond market vigilantes” in this circumstance may push up yields to a point that makes the US government take action to reduce spending.
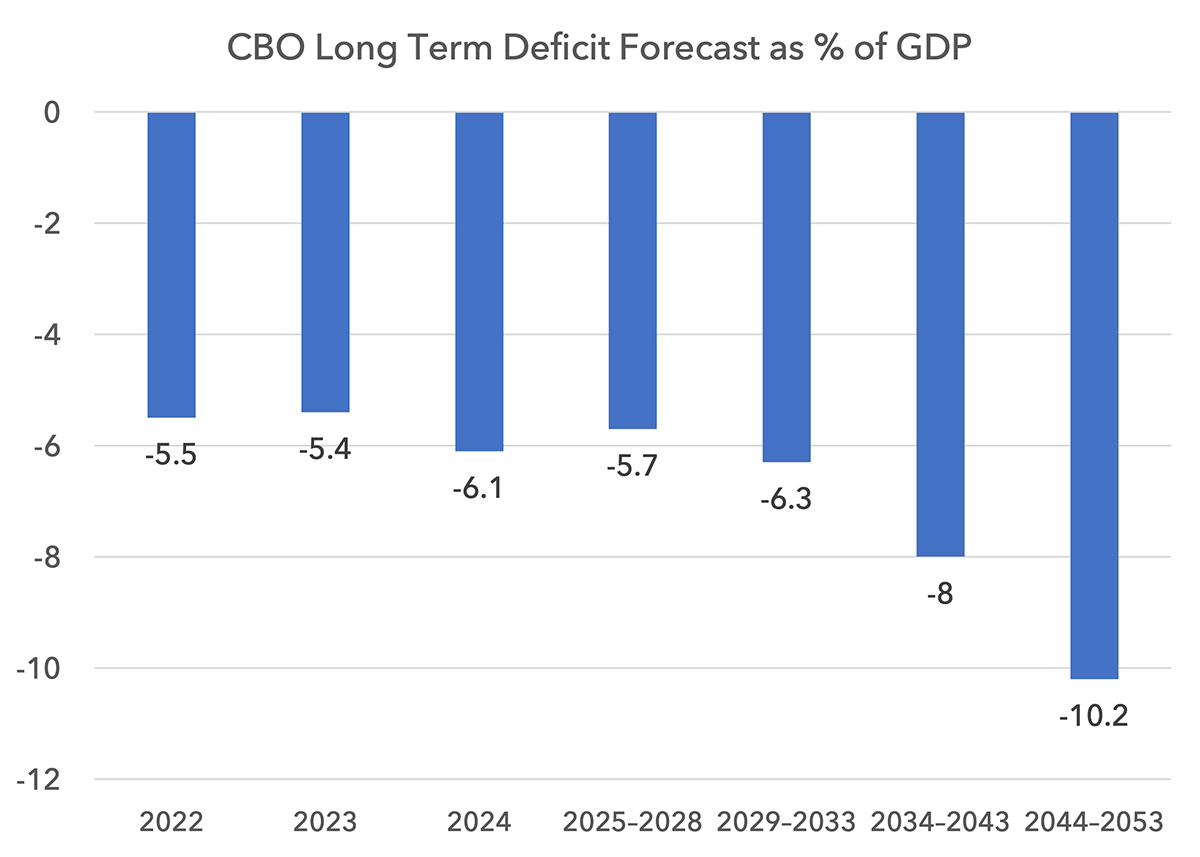
The CBO’s February 2023 long-term budget projection is shown below. It assumes 3.5% to 4.5% annual nominal GDP growth out to 2053. As is obvious in the chart, the deficit is scheduled to keep widening. This means Treasury issuance is set to rise significantly. If interest rates rise, the need for more issuance rises as the government needs to finance its own interest costs. In this circumstance the bond market could find itself in a vicious circle: higher yields mean more borrowing which means higher yields. The circuit breaker would be a bipartisan consensus to cut sharply government spending and entitlements. We would assume this would be achieved eventually but the journey could be fraught.
Term Premium Normalising
Bond yields can rise irrespective of the macro if the term premium rises. The term premium is the component of bond yields that is supposed to compensate investors for the risk that today’s perception of future inflation or growth might be wrong. The longer the duration, theoretically, the more significant the term premium should be. Similarly, the more complicated and confused the political and economic outlook is, the stronger the logic for a higher term premium.
Below we show the term premium as calculated by the New York Fed from 1963 to 2023. The current reading of -0.5% is incredibly low given today’s inflation and growth uncertainties. It is very rare to see it negative, for obvious reasons.
There was a brief moment in negative territory in 1962 during the Cuban Missile Crisis and the flight to safety that occurred during that time. The all-time low was during the pandemic in March 2020, happening at a time when 10-year nominal yields briefly touched 30-40 basis points.
These recent low readings make some sense when looking in the rear-view mirror. We have had a long period of relentlessly declining inflation which became predictable. Investors did not require any compensation for the risk of investing in Government bonds. Demographics also drove a surge in the demand for savings relative to investment, driving down interest rates. Quantitative easing pushed yields even lower. All of these elements combined to create the conditions for a negative term premium. But none of these conditions persists today.
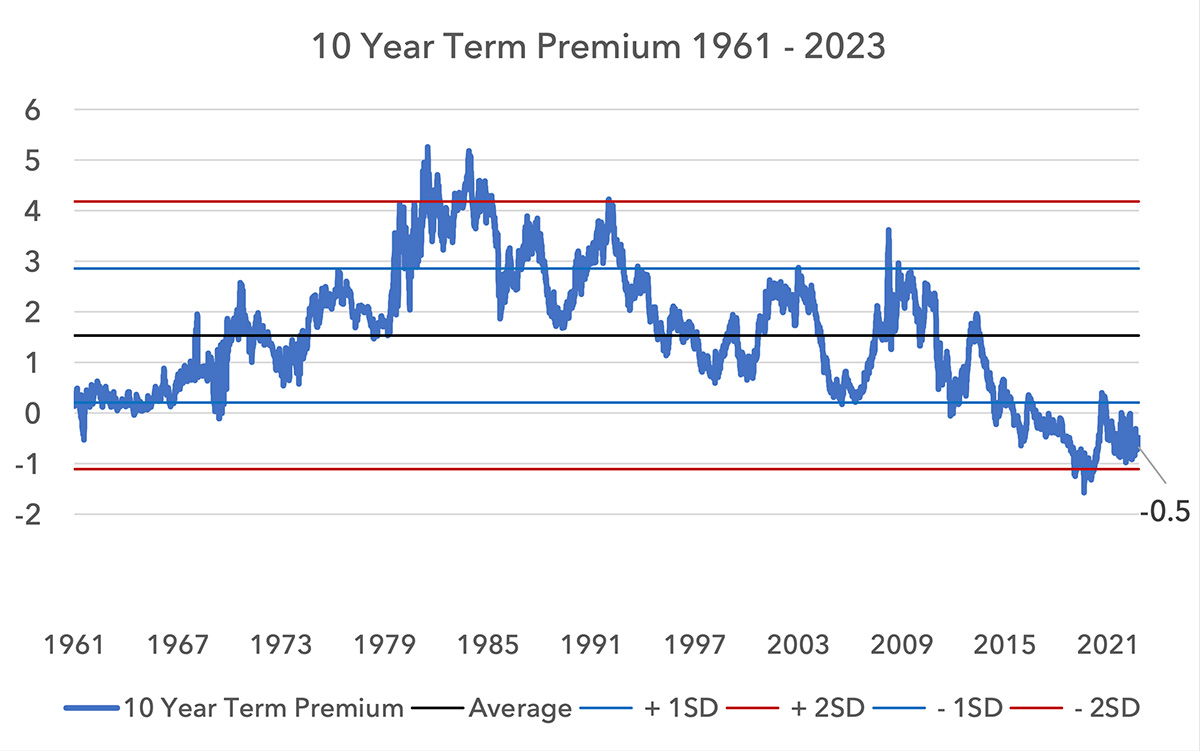
The average term premium over the last 60 years is 1.5%. Given the uncertainty around inflation, politics and growth, it would make sense if the term premium moved higher, carrying nominal yields up with it.
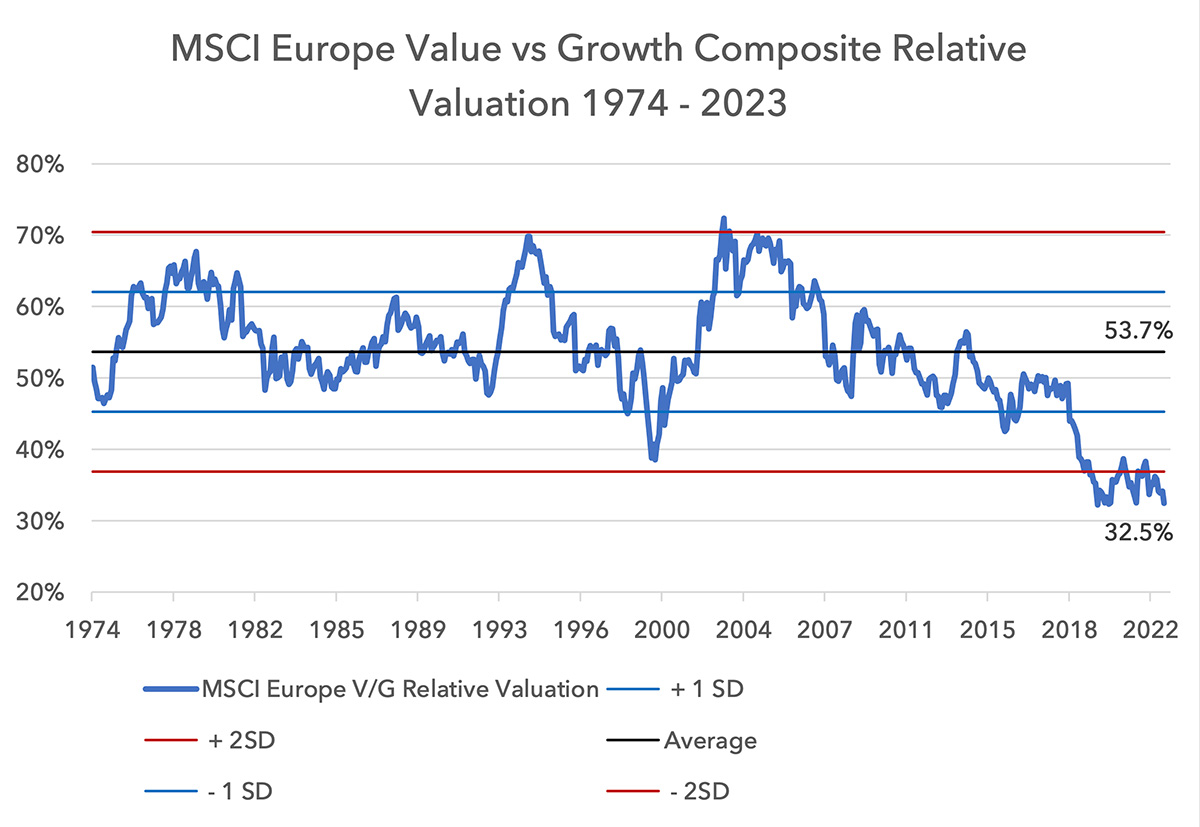
Does this matter for equities?
You might ask, so what if bond yields rise? Does this even matter for equities, or specifically for European equities? But given the degree of polarisation in valuation today, it likely will be a big issue, with some equities vulnerable to multiple compression.
Below we show the valuation of European equity Value compared to European equity Growth over the last 50 years. Value is now as cheap as it ever has been relative to Growth, as cheap as it was in March 2020 at the pandemic low. Implicit in this polarisation in valuation is the expectation of both recession and low rates. If this does not materialise, the recovery of value could be sharp.
Within value, there are clearly pockets of potential weakness. If yields rise you would expect consumer-facing stocks to underperform. Autos might underperform in this context.
Banks are in a difficult position
Higher yields have become a risk for Banks. In fact, in the US the regional banking crisis is purely driven by higher yields. There are two pain points for banks, both coming from higher yields. On the one hand, mark-to-market losses on Treasuries are impacting equity. On the other side, high yields are incentivising deposits to move out of the banking system and into money market funds. If yields were to move higher still, more US banks could fail.
Many investors are looking at US regional bank share price performance and assuming it is a signal of a severe recession that is soon to arrive. The assumption here is that the market “knows” that loan-losses are going to rise steeply and this is why the share prices are falling so much.
We would see it differently. At this moment US regional banks are extremely vulnerable and therefore extremely sensitive to higher yields. To state the obvious, this is because higher yields could cause outright insolvency. In this light the incredible weakness in US regional bank share prices may be the canary in the coal mine that higher yields are coming.
In Europe the situation is nothing like as severe, but there are risks. Regulation is better, more debt securities are marked to market and deposit erosion is mild. But the principle remains: sharply higher yields could see losses in debt securities portfolios and deposit erosion could pick up. This means deposit beta is set to rise. As a result Banks are in a pinch: lower yields would provide systemic relief, but lower net interest margins, whilst higher yields could increase systemic pressure.
We have reduced our position in European banks further and the current weight is 6%. The index weight of commercial banks and capital markets banks is now 7.87%. Stripping out capital markets, the index weight to commercial banks is now 6.75%.
We still view Banks as being undervalued. The question is around their operational momentum. Once we can have a clearer line of sight around their net interest margins and have a higher sense of security around the valuations of their debt portfolios, we will become more interested again.
A difficult regime for asset prices
For the last few years we have been more concerned about asset prices than we have been about the economy. This remains. Conversely, investors are more concerned about the economy when they should be more concerned about asset prices.
A movement higher in yields could upend valuations, and we believe a selective value approach can hedge these risks best. The Lightman European Funds have a 2023 P/E ratio of 8.5x and a price to sales ratio of 0.8x. The weighted forecast 2023 dividend yield of our holdings is 5.1%.
Sources:
Strategas, The Congressional Budget Office, The Commodities Futures Trading Commission, The New York Fed, John Burns Research & Consulting, Renmac, Outokumpu, BHP Billiton, Sandvik, MSCI, Bloomberg, Lightman Investment Management
Legal
Disclaimer
This communication and its content are owned by Lightman Investment Management Limited (“Lightman”, “we”, “us”). Lightman Investment Management Limited (FRN: 827120) is authorised and regulated by the Financial Conduct Authority (“FCA”) as a UK MiFID portfolio manager eligible to deal with professional clients and eligible counterparties in the UK. Lightman is registered with Companies House in England and Wales under the registration number 11647387, having its registered office at c/o Buzzacott LLP, 130 Wood Street, London, United Kingdom, EC2V 6DL.
Target audience
This communication is intended for ‘Eligible Counterparties’ and ‘Professional’ clients only, as described under the UK Financial Services and Markets Act 2000 (“FSMA”) (and any amendments to it). It is not intended for ‘Retail’ clients and Lightman does not have permission to provide investment services to retail clients. Generally, marketing communications are only intended for ‘Eligible Counterparties’ and ‘Professional’ clients in the UK, unless they are being used for purposes other than marketing, such as regulations and compliance etc. The Firm may produce marketing or communication documents for selected investor types in non UK jurisdictions. Such documents would clearly state the target audience and target jurisdiction.
Collective Investment Scheme(s)
The collective investment scheme(s) – WS Lightman Investment Funds (PRN: 838695) (“UK OEIC”, “UK umbrella”), and WS Lightman European Fund (PRN: 838696) (“UK sub-fund”, “UK product”) are regulated collective scheme(s), authorised and regulated by the FCA. In accordance with Section 238 of FSMA, such schemes can be marketed to the UK general public. Lightman, however, does not intend to receive subscription or redemption orders from retail clients and accordingly such retail clients should either contact their investment adviser or the Management Company Waystone Management (UK) Limited (“Waystone UK”) in relation to any fund documents.
The collective investment scheme(s) - Elevation Fund SICAV (Code: O00012482) (“Luxembourg SICAV”, “Luxembourg umbrella”), and Lightman European Equities Fund (Code: O00012482_00000002) (“Luxembourg sub-fund”, “Lux product”) are regulated undertakings for collective investments in transferrable securities (UCITS), authorised and regulated by the Commission de Surveillance du Secteur Financier (CSSF) in Luxembourg. In accordance with regulatory approvals obtained under the requirements of the Law of 17 December 2010 relating to undertakings for collective investment, the schemes can be marketed to the public in Luxembourg, Norway, Spain, and Republic of Ireland. Lightman, however, does not intend to receive subscription or redemption orders from any client types for the Lux product and accordingly such client should either contact a domestic distributor, domestic investment advisor or the Management Company Link Fund Solutions (Luxembourg) S.A. (“Link Luxembourg”) in relation to any fund documents.
Luxembourg umbrella and Luxembourg sub-fund are also approved for marketing to professional clients and eligible counterparties in the UK under the UK National Private Placement Regime (NPPR). UK registration numbers for the funds are as follows: Elevation Fund SICAV (PRN: 957838) and Lightman European Equities Fund (PRN: 957839). Please write to us at compliance@lightmanfunds.com for proof of UK registration of the funds.
Luxembourg sub-fund is also approved for marketing to qualified investors in Switzerland, within the meaning of Art. 10 para. 3 and 3ter CISA. In Switzerland, the representative is Acolin Fund Services AG, Leutschenbachstrasse 50, 8050 Zurich, Switzerland, whilst the paying agent is NPB Neue Privat Bank AG, Limmatquai 1 / am Bellevue, 8024 Zurich, Switzerland.
Accuracy and correctness of information
Lightman takes all reasonable steps to ensure the accuracy and completeness of its communications; we however request all recipients to contact us directly for the latest information and documents as issued documents may not be fully updated. We cannot accept any liability arising from loss or damage from the use of this communication.
Wherever our communications refer to a third party such as Waystone, Link, Northern Trust etc., we cannot accept any responsibility for the availability of their services or the accuracy and correctness of their content. We urge users to contact the third party for any query related to their services.
Important information for non-UK persons (Including US persons)
This communication is not intended for any person outside of the UK, Switzerland, or the European Economic Area (EEA). Lightman or any of the funds referenced in this communication are not approved for marketing outside of the UK, Switzerland, or the EEA. All such persons must consult their domestic lawyers in relation to services or products offered by Lightman.
Risk warning to all investors
The value of investments in any financial assets may fall as well as rise. Investors may not get back the amount they originally invested. Past performance is not an indicator of future performance. Potential investors should not use this communication as the basis of an investment decision. Decisions to invest in any fund should be taken only on the basis of information available in the latest fund documents. Potential investors should carefully consider the risks described in those documents and, if required, consult a financial adviser before deciding to invest.
Offer, advice, or recommendation
No information in this communication is intended to act as an offer, investment advice or recommendation to buy or sell a product or to engage in investment services or activities. You must consult your investment adviser or a lawyer before engaging in any investment service or product.
GDPR
Lightman may process personal information of persons using this communication. Please read our privacy policy.
Copyright
This communication cannot be distributed or reproduced without our consent.